
Abstract
Background:
Concentrations of soluble amyloid-β (Aβ) oscillate with the sleep-wake cycle in the interstitial fluid of mice and cerebrospinal fluid (CSF) of humans. Further, the concentration of Aβ in CSF increases during sleep deprivation. Stress and disruption of the circadian clock are additional mechanisms hypothesized to increase CSF Aβ levels. Cortisol is a marker for stress and has an endogenous circadian rhythm. Other factors such as glucose and lactate have been associated with changes in sleep-wake activity and/or Aβ.
Objective:
In this exploratory study, we used samples collected in a previous study to examine how sleep deprivation affects Aβ, cortisol, lactate, and glucose in plasma and CSF from healthy middle-aged adults (N = 11).
Methods:
Eleven cognitively normal participants without evidence of sleep disturbance were randomized to sleep deprivation or normal sleep control. All participants were invited to repeat the study. Cortisol, lactate, glucose, and Aβ were measured in 2-h intervals over a 36-h period in both plasma and CSF. All concentrations were normalized to the mean prior to calculating mesor, amplitude, acrophase, and other parameters.
Results:
One night of sleep deprivation increases the overnight concentration of Aβ in CSF approximately 10%, but does not significantly affect cortisol, lactate, or glucose concentrations in plasma or CSF between the sleep-deprived and control conditions.
Conclusion:
These data suggest that sleep deprivation-related changes in CSF Aβ are not mediated by stress or circadian disruption as measured by cortisol.
INTRODUCTION
Alzheimer’s disease (AD) is a progressive neurodegenerative disease characterized clinically by aggregation of amyloid-β (Aβ) as insoluble plaques, intracellular tau tangles, neuronal loss, and cognitive dysfunction [1, 2]. Concentrations of soluble Aβ oscillate with the sleep-wake cycle in the interstitial fluid (ISF) of mice [3] and cerebrospinal fluid (CSF) of humans [4–6]. Further, Aβ concentration in CSF increases during sleep deprivation due to increased production [7, 8].
Stress [9] and disruption of the circadian clock [10] are additional mechanisms hypothesized to increase CSF Aβ during sleep deprivation. Glucocorticoids, including cortisol, modulate the response to stress and influence metabolism and energy balance, immunity, behavior, and cognition. Cortisol concentrations oscillate with an endogenous circadian rhythm in humans [11] that is both driven by the circadian clock [12] and also entrains the clock [13]. The nadir of plasma cortisol occurs between 22:00–04:00 and then peaks between 04:00–08:00 [14], although the peak time may vary with age [15]. In addition to daily oscillations in cortisol, there are circadian fluctuations in hormones, such as melatonin, and daily rhythms in temperature that fluctuate across the 24-h day. The circadian relationship among these biomarkers remains stable, even in the setting of sleep deprivation [16–18]. Sleep deprivation increases cortisol in saliva and blood in humans under either controlled light exposure [19], chronic sleep restriction [20], or circadian misalignment [21]. CSF cortisol also increases in sleep-deprived primates [22]. We have previously shown in humans that CSF cortisol closely parallels the plasma cortisol rhythm under normal sleep conditions [23], but the effects of sleep deprivation have not been reported.
Other metabolic factors, such as glucose, are associated with increased Aβ [24]. ISF lactate concentrations in mice fluctuate with the sleep-wake cycle and are hypothesized to be a biomarker for sleep [25]. Therefore, lactate would be predicted to increase with Aβ in human CSF and would be a useful marker for sleep loss. In this exploratory study, we used samples collected in a previous study [7] to examine the relationship of plasma and CSF cortisol, lactate, and glucose to CSF Aβ40 and Aβ42 under control and sleep-deprived conditions.
METHODS
Participants and sleep interventions
Eleven cognitively normal participants without evidence of sleep disturbance were recruited from both a longitudinal study of aging and AD at the Knight Alzheimer’s Disease Research Center and a research volunteer registry at Washington University [7]. Study protocols were approved by the Washington University Institutional Review Board and written informed consent was obtained from all participants.
Participants were randomized to sleep deprivation or normal sleep control as previously described [7]. Each participant was invited to repeat the study. Five of the 11 participants completed both the control and sleep-deprived conditions and were previously reported [7]. Participants were randomized and there was a washout period of 4–6 months between undergoing each condition. Six additional participants completed only one group (3 control, 3 sleep-deprived), and were age, sex, and body mass index (BMI) matched. Prior to admission to the Clinical Research Unit (CRU), participants wore an activity monitor for up to 7 days (Actiwatch2, Respironics, Bend, OR). Polysomnography, placement of the indwelling lumbar catheter, meal and snack times, and sample collection were performed as previously described [7].
Sample collection
Six milliliters of CSF and plasma were obtained every 2 h for 36 h. CSF Aβ was measured as previously described [7]. CSF cortisol was measured by sensitive enzyme linked immunosorbent assay (ELISA) (Salimetrics, State College, PA). The assay detection level is 0.07 ng/ml; cross-reactivity with cortisone is 0.13%. Cortisol was measured in plasma by chemiluminescent immunometric assay (Siemens Healthcare Diagnostics, Tarrytown, NY). The assay detection level is 10 ng/ml; cross-reactivity with cortisone is <0.1%. Glucose and lactate concentrations were measured in each plasma and CSF sample using a YSI 2700 analyzer (YSI incorporated, Yellow Springs, OH).
Statistics
Before analysis, all concentrations of CSF and plasma cortisol, lactate, glucose, and Aβ were normalized to the mean across the 36-h sampling period (percent of the mean). Using cosinor analysis as previously described [5], the mesor (midline of the oscillation), amplitude (distance between the peak and the mesor), acrophase (time corresponding to the peak of the curve), and linear rise over 36 h were calculated for each participant (Graphpad Prism, Version 8.1.2, San Diego, CA). All longitudinal measurements were analyzed with general linear mixed models as previously described [7] (SPSS Statistics, IBM Corp., Version 25.0. Armonk, NY) and were not blinded. The overnight period was defined from hour 16 (23:00), the first sample collected after the intervention began, to hour 28 (11:00) when all transit from the brain to lumbar catheter during sleep would be completed for all participants. Differences in participant characteristics and cosinor parameters were assessed with mixed models but without the time factor. All pairwise comparisons were made without correction for multiple comparisons. Statistical significance was defined as p < 0.05 and was non-directional (i.e., two-tailed).
RESULTS
Participant characteristics and baseline circadian activity levels
The sex, race, age, BMI, cognitive status, and Aβ42 :40 ratio were not significantly different between groups (Table 1). Actigraphy for all participants followed a similar daily pattern in both the control and the sleep-deprived groups prior to admission to the CRU and the amplitude, acrophase, and mesor were not significantly different (Fig. 1A-B, Table 1). During the 36-h CRU stay, activity levels were decreased due to bedrest and overnight total sleep time measured by polysomnography was significantly different between the sleep-deprived and control groups.
Participant characteristics
Intervention groups include repeat participants and are not independent groups. Data are shown this way to highlight effect of sleep conditions in each group. Significance tests for treatment differences were made using mixed models to accommodate the nonindependence of the measurements. *Statistically significant. Total sleep time and sleep efficiency are significantly lower in the sleep-deprived condition compared to control (total sleep time: F1,166 = 201.5, p < 0.0001; sleep efficiency: F1,8 = 139.8, p < 0.0001). y, year; SD, standard deviation; M, male; F, female; C, Caucasian; AA, African-American; kg, kilogram; m2, meters squared; MMSE, Mini-Mental State Exam; Aβ, amyloid-β; CRU, clinical research unit; min, minute.

Participant activity levels and time courses for CSF and plasma cortisol, lactate, glucose, and Aβ over 36 h. Baseline mean activity counts from actigraphy monitoring over 4 days preceding admission to the CRU and during the admission for the control group (A) and sleep-deprived group (B). All concentrations for cortisol, lactate, glucose, and Aβ were normalized to percent of the mean before analysis. The shaded area indicates a 12-h overnight period, 23:00–11:00. Vertical dashed lines show the start of the intervention. Cosinor fits and differences between sleep-deprived and control participants are shown in plasma and CSF for cortisol (C-F), lactate (G-J), and glucose (K-N). Concentrations of CSF Aβ40 and Aβ42 (O-R) collected over 36 h for the control and sleep-deprived participants. Concentrations were significantly elevated in sleep-deprived group from 23:00 to 11:00 on day 2. (**p < 0.01. n.s: not significant. Error bars show standard error. Blue/Black = control. Red/Gray = sleep-deprived. Aβ, amyloid-β; CSF, cerebrospinal fluid; CRU, clinical research unit).
Cortisol
Sleep deprivation did not increase overnight CSF or plasma cortisol compared to control (Fig. 1C-F). For plasma cortisol concentration, the overnight estimated difference between sleep-deprived and control conditions was +1.9% (standard error (SE) 7.6, 95% confidence interval (CI) –13.3 –17.1, p = 0.81). For CSF cortisol, the overnight estimated difference was +1.9% (SE 6.98, 95% CI –12.0 –15.8, p = 0.79). The amplitude, acrophase, mesor, and linear rise of cortisol also did not differ between the conditions in either CSF or plasma (Table 2, Fig. 2A-D). Within the sleep-deprived condition, however, the acrophase and mesor differed between CSF and plasma (acrophase mean estimated difference +2.8, SE 0.3, 95% CI 2.0–3.5, p < 0.0001; mesor estimated difference –19.8, SE 8.1, 95% CI –38.9- –0.7, p = 0.04; Table 2). Plasma cortisol levels peak between 04:00–08:00 [14] and this was delayed in CSF by ∼1.5–3 h (Fig. 2B). The difference between the plasma cortisol in the control and sleep-deprived groups increased early in the night, then decreased (Fig. 1D); this pattern was similar for CSF cortisol under the sleep deprivation condition (Fig. 1F).
Comparison of cosinor parameters between interventions and biofluid compartments for cortisol
CI, confidence intervals; df, degrees of freedom; CSF, cerebrospinal fluid; SD, sleep deprivation; h, hour.
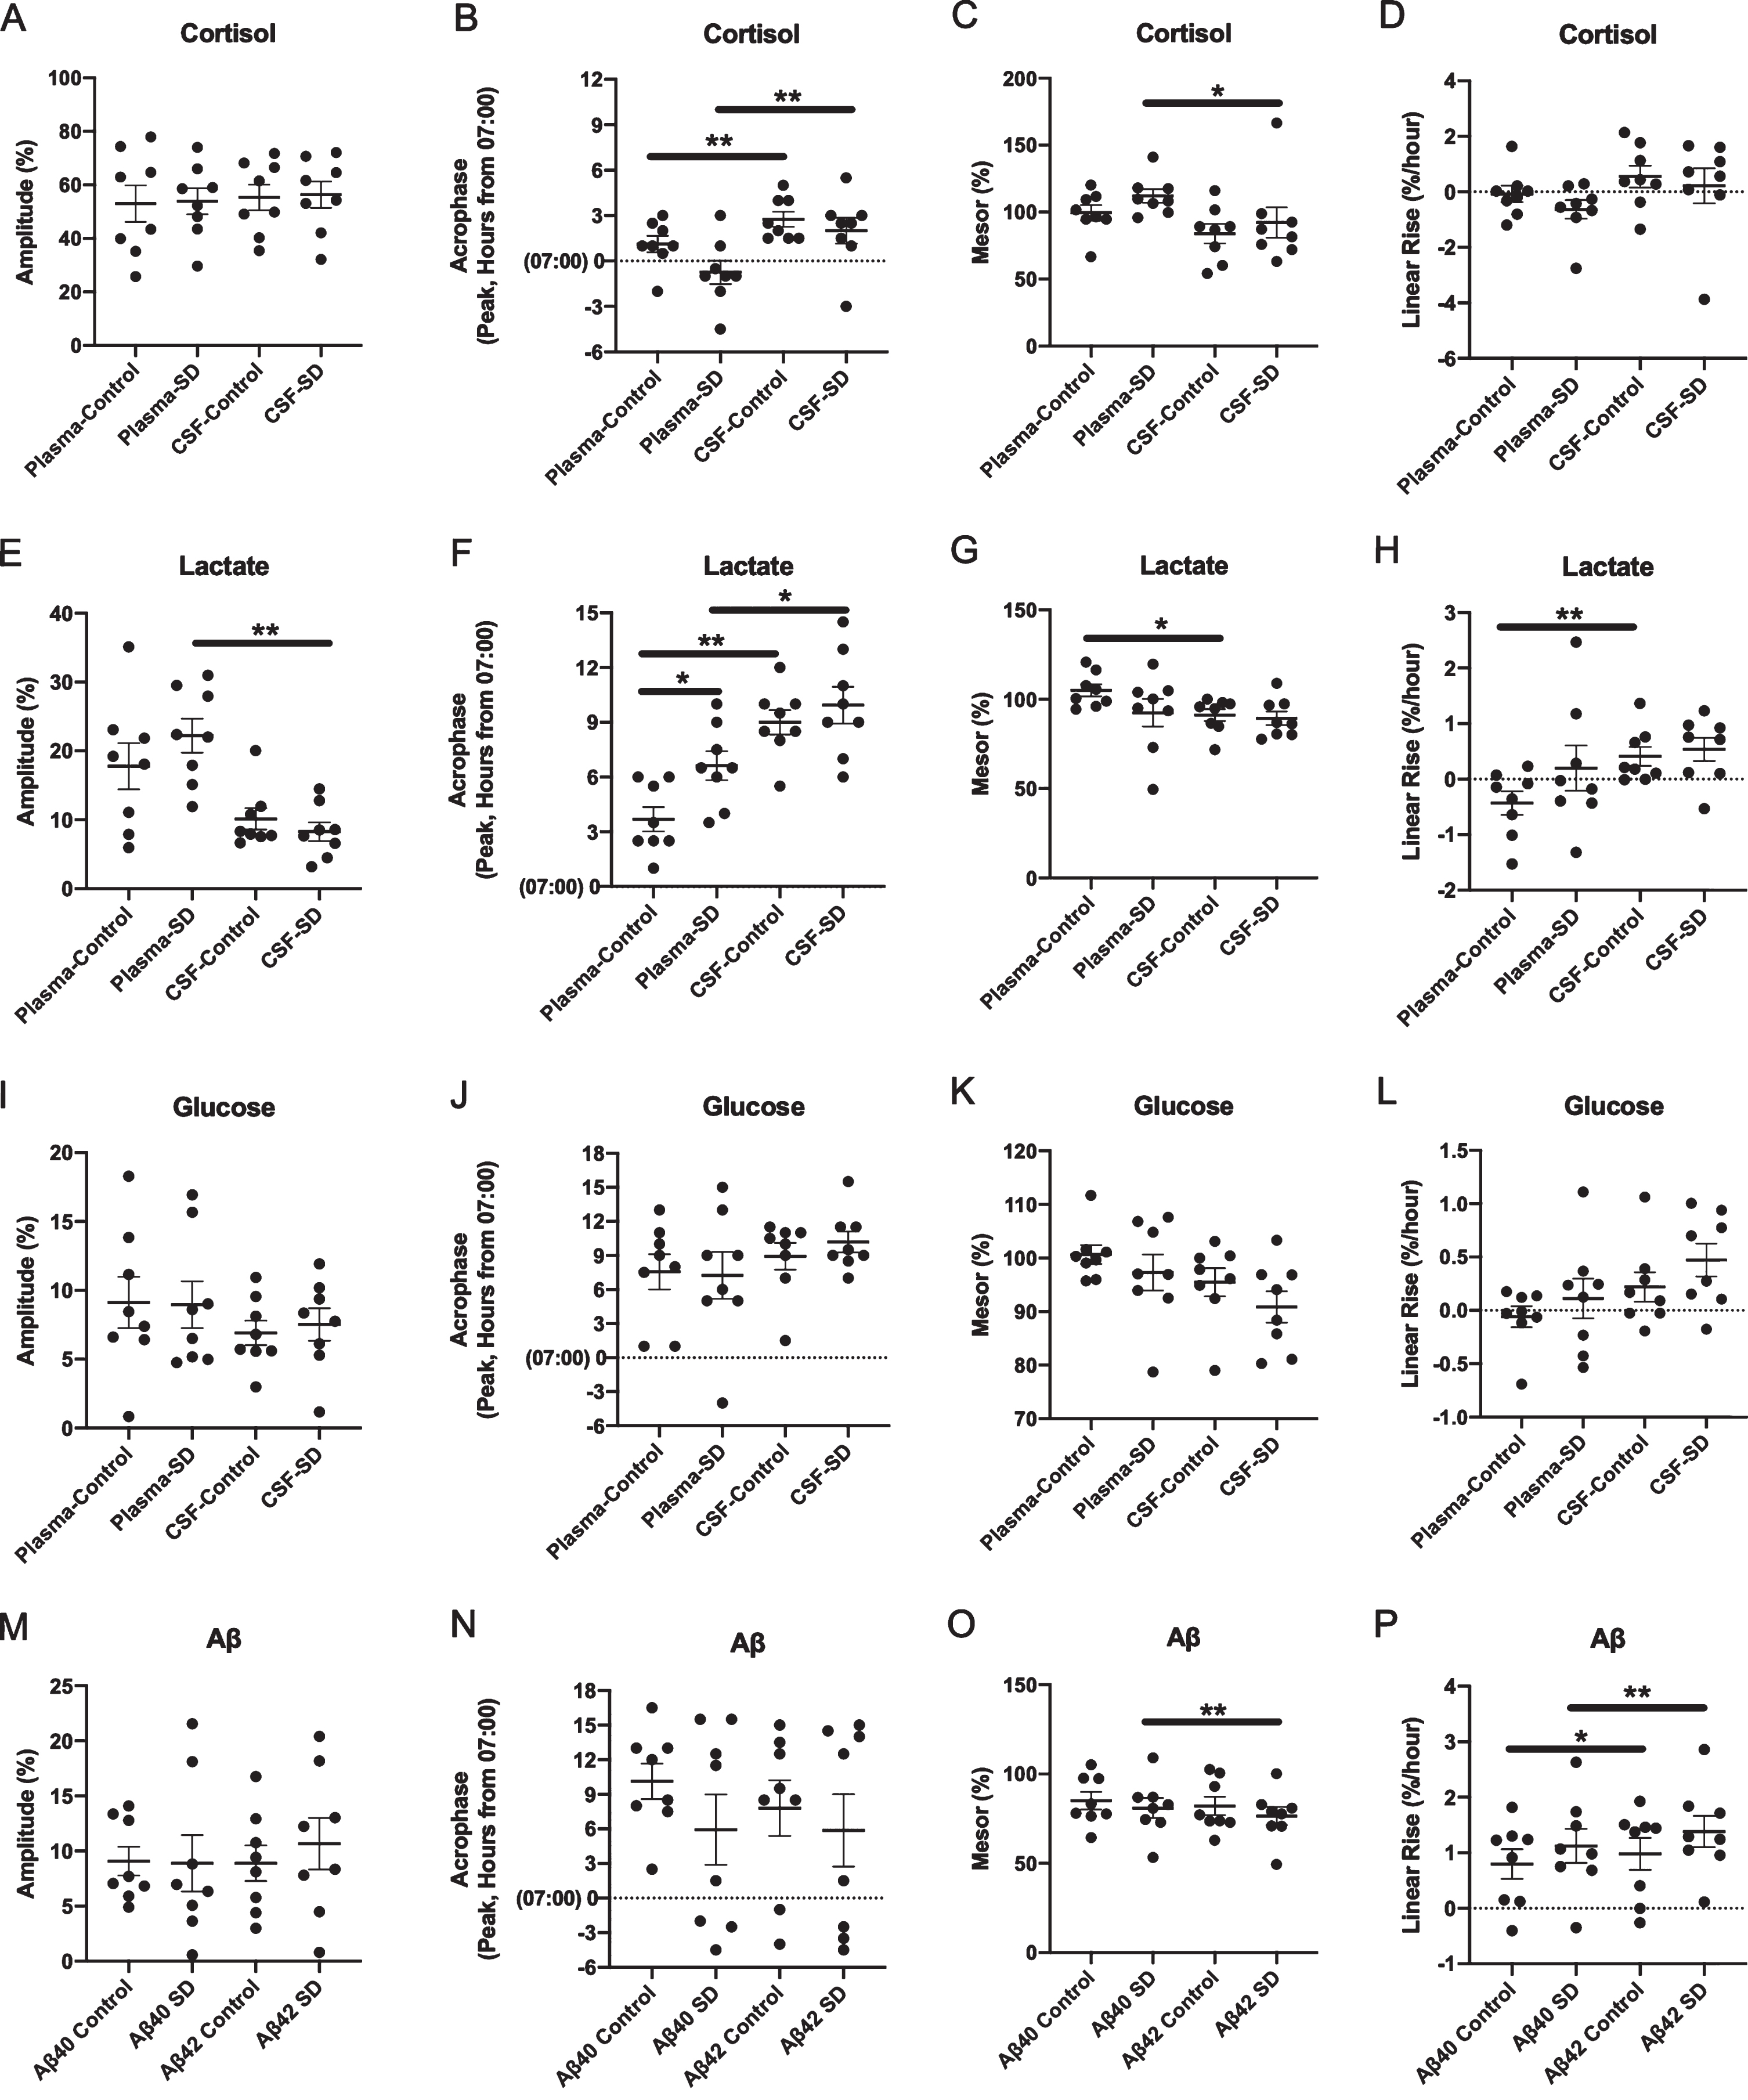
Differences in cosinor parameters between CSF and plasma cortisol (A-D), lactate (E-H), glucose (I-L), and Aβ (M-P) under sleep-deprived and control conditions. All concentrations of cortisol, lactate, glucose, and Aβ were normalized to percent of the mean before analysis. Acrophase was calculated based on time elapsed from the start of sample collection to the first peak. (*p < 0.05; **p < 0.01. Error bars show standard error. SD, sleep deprivation; CSF, cerebrospinal fluid; Aβ, amyloid-β).
Lactate
Sleep deprivation did not increase overnight CSF or plasma lactate compared to control (Fig. 1G-J). For plasma lactate, the overnight estimated difference between sleep-deprived and control conditions was +2.4% (SE 4.3, 95% CI –6.1–11.0, p = 0.57). For CSF lactate, the overnight estimated difference was +2.3% (SE 1.9, 95% CI –1.5–6.2, p = 0.23). Sleep deprivation delayed the plasma lactate acrophase by ∼3 h compared to control (estimated difference –2.9, SE 0.9, 95% CI –5.2–0.7, p = 0.02), while the amplitude was not significantly different (Table 3). Within each condition, the acrophase of CSF lactate was greater than plasma lactate (control: estimated difference +5.3, SE 0.67, 95% CI 3.7–6.9, p < 0.0001, sleep-deprived: estimated difference +3.3, SE 1.3, 95% CI 0.35–6.3, p = 0.03; Table 3, Fig. 2E-H). In the sleep-deprived group, plasma lactate had a significantly higher amplitude compared to CSF (estimated difference –0.14, SE 0.03, 95% CI –0.2- –0.07, p = 0.002). In the control group, the plasma lactate mesor was higher than in the CSF (estimated difference –0.14, SE 0.04, 95% CI –0.2- –0.04, p = 0.01) while the CSF lactate linear rise was greater than in plasma (estimated difference + 0.01, SE 0.002, 95% CI 0.003–0.01, p = 0.008). All other cosinor parameters were not significantly different between plasma and CSF lactate (Table 3).
Comparison of cosinor parameters between interventions and biofluid compartments for lactate
CI, confidence intervals; df, degrees of freedom; CSF, cerebrospinal fluid; SD, sleep deprivation; h, hour.
Glucose
As with cortisol and lactate, sleep deprivation did not increase overnight CSF or plasma glucose compared to control and cosinor parameters were not different (Table 4, Fig. 1K-N, Fig. 2I-L). For plasma glucose, the overnight estimated difference between sleep-deprived and control conditions was +4.2% (SE 2.7, 95% CI –1.2–9.6, p = 0.13). For CSF glucose, the overnight estimated difference was +0.6% (SE 1.7, 95% CI –2.8–3.9, p = 0.74). Subtle differences between the plasma and CSF glucose in the control and sleep-deprived conditions appear to approximate meal times (09:00, 13:00, 18:00) rather than to specific intervention times (Fig. 1L, N).
Comparison of cosinor parameters between interventions and biofluid compartments for glucose
CI, confidence intervals; df, degrees of freedom; CSF, cerebrospinal fluid; SD, sleep deprivation; h, hour.
Glucose/lactate ratio
Sleep deprivation acutely decreased the glucose/lactate ratio in CSF, but not in plasma (Fig. 3). In the period following the intervention (time points 16–22 or 23:00–05:00), CSF glucose/lactate ratio normalized to percent of mean increased in controls relative to the sleep deprivation group (estimated difference +4.8%, 95% CI: 1.3–8.3, p = 0.009). This difference is not significant in the plasma glucose/lactate ratio normalized to percent of mean (estimated difference –6.9%, 95% CI: –19.5–5.7, p = 0.274). Widening the analysis to include all time points after intervention (time points 16–28 or 23:00–11:00), as done with the other analyses in Fig. 1, demonstrated no statistically significant difference between interventions in the plasma or CSF glucose/lactate ratio (Plasma: estimated difference 3.7, SE 4.2, 95% CI –4.6 –11.9, p = 0.38; CSF: estimated difference –1.3, SE 1.3, 95% CI –3.8 –1.3, p = 0.32).
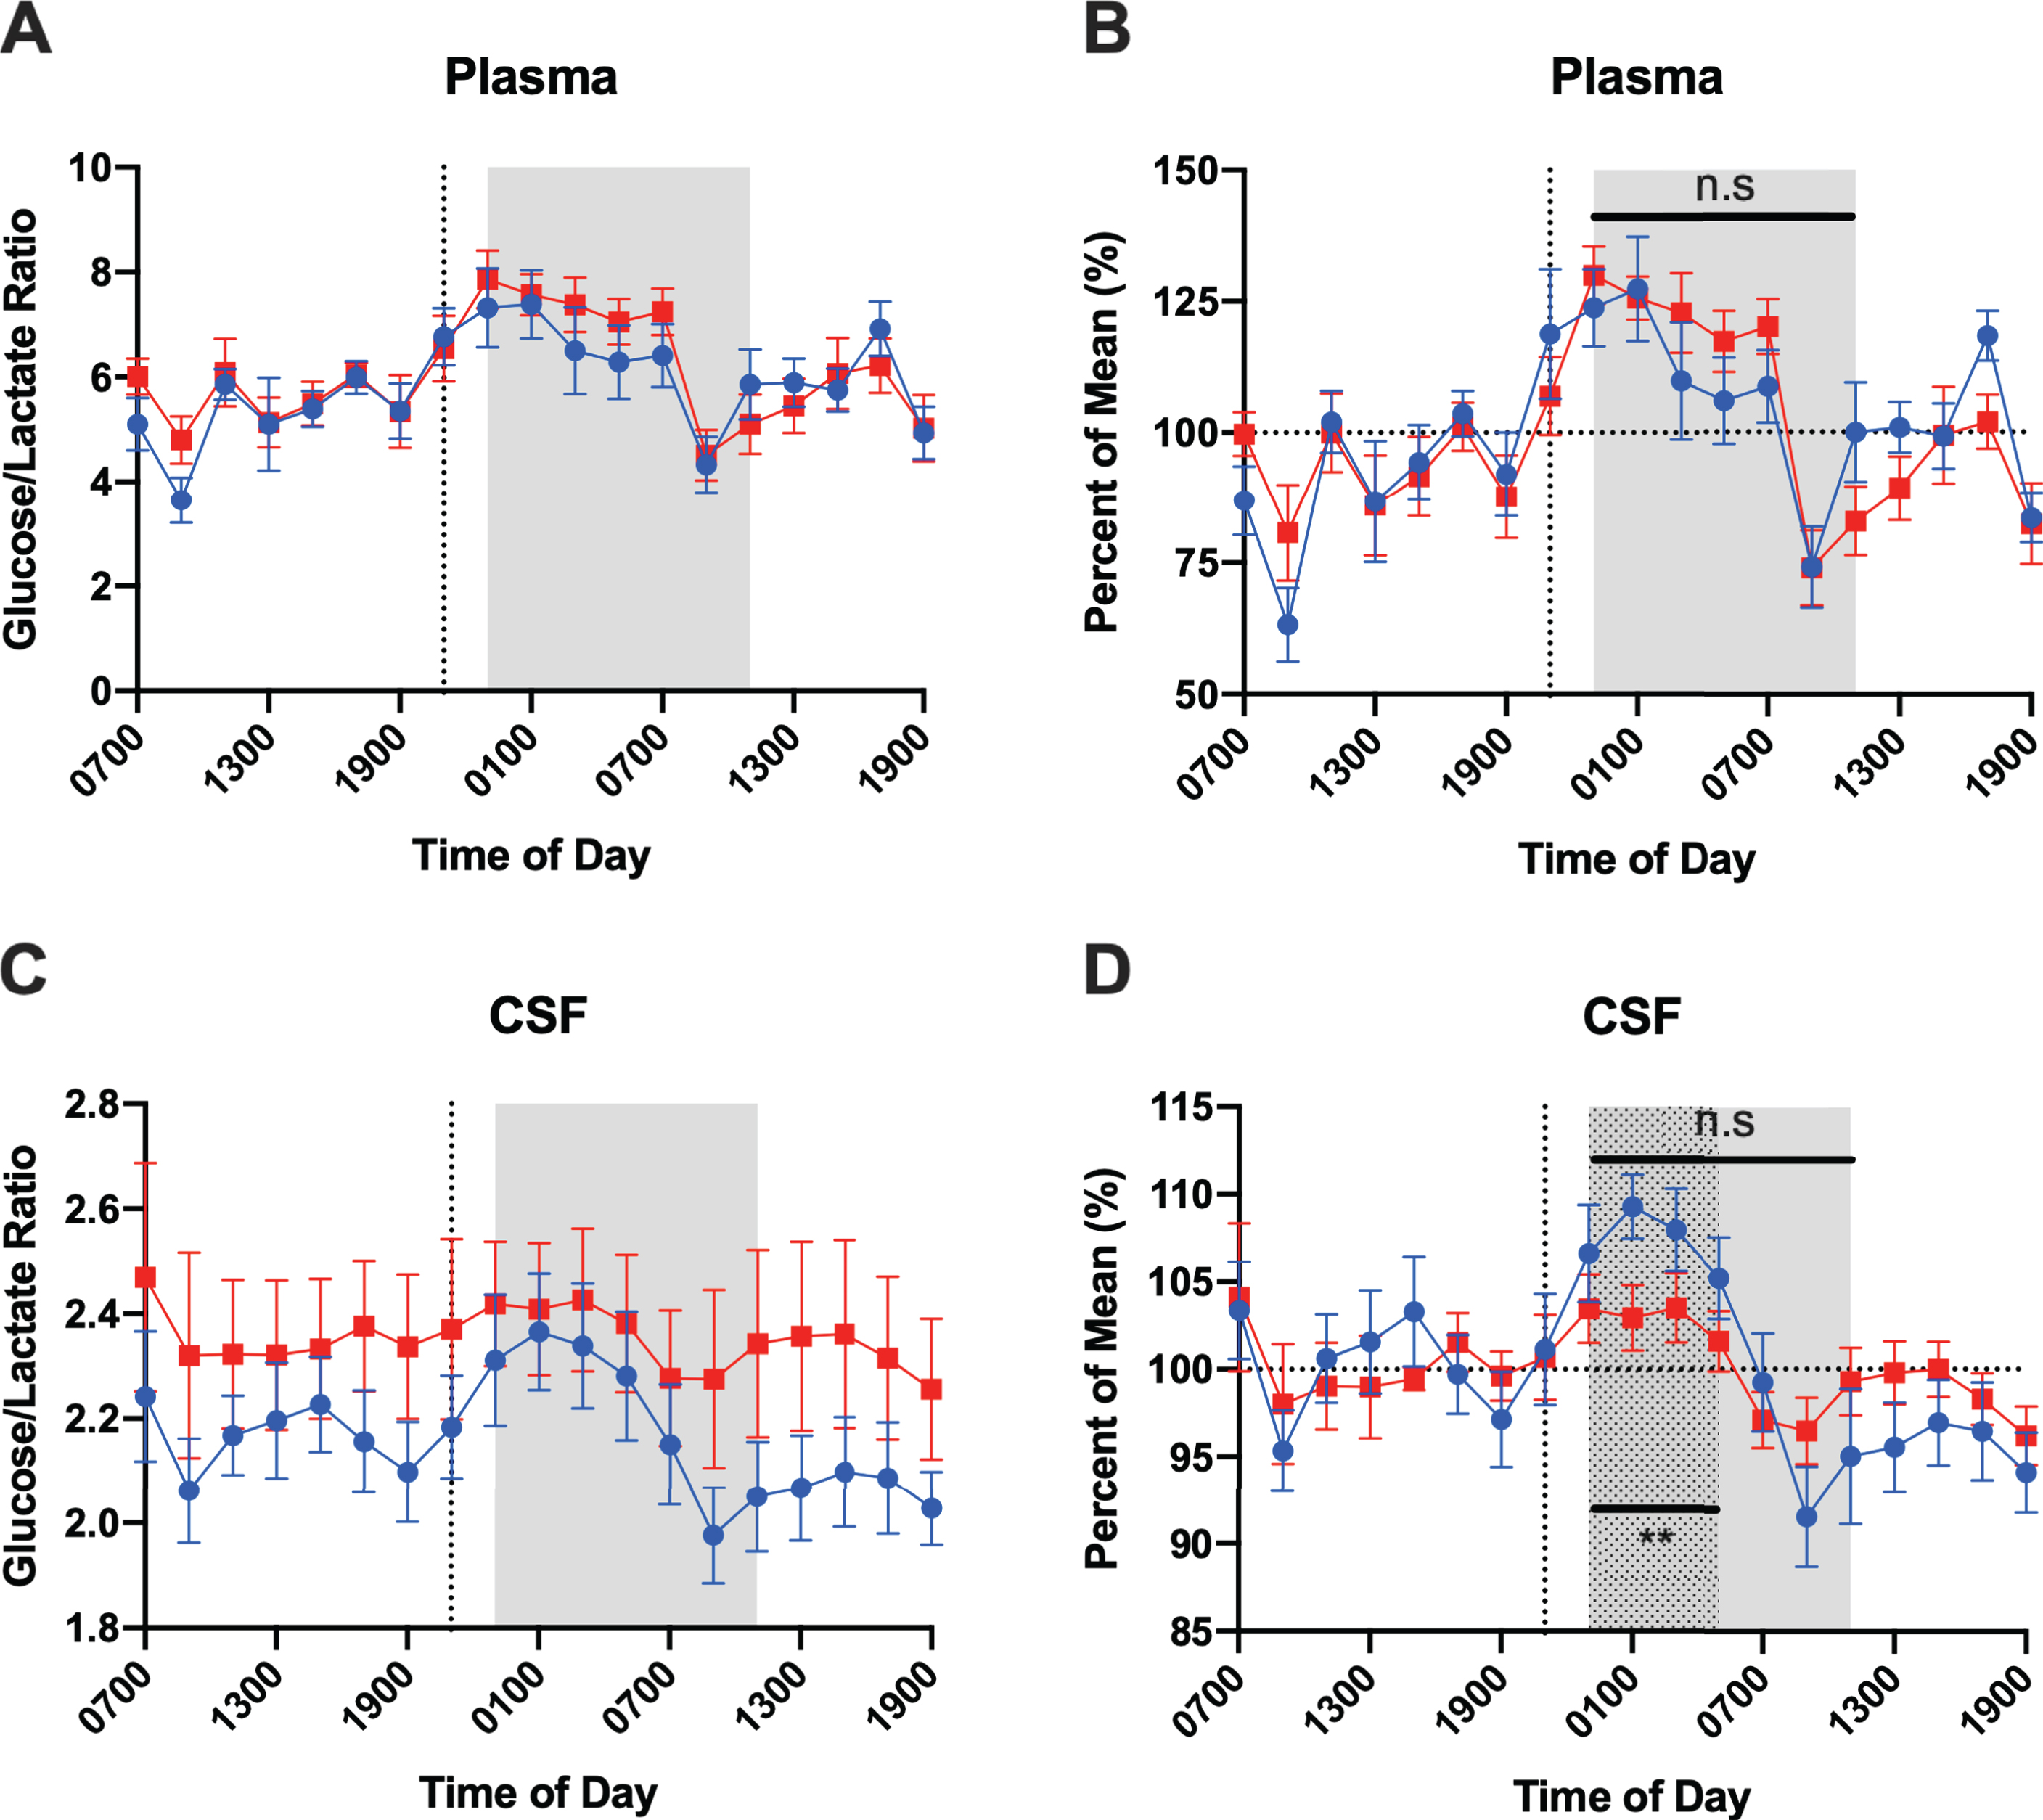
Glucose/lactate ratio in plasma (A and B) and CSF (C and D) over the collection period. Glucose/lactate ratio is shown both without (A, C) and with normalization to percent of the mean (B, D). Mixed model analysis of time points after the intervention, 16–28 (23 : 00–11 : 00, gray shaded area) demonstrated no statistically significant difference between interventions in the plasma or CSF glucose/lactate ratio. Restricting the analysis to the time range 16–22 (23 : 00–05 : 00, dotted area) demonstrates that CSF glucose/lactate ratio increases more in the control group than sleep-deprived group while this difference is not significant in plasma glucose/lactate ratio. (Error bars show standard error. Blue/Black circle = control, Red/Gray square = sleep-deprived; CSF, cerebrospinal fluid. **p < 0.01).
Aβ
In contrast to cortisol, lactate, and glucose, sleep deprivation increased overnight CSF Aβ40 and Aβ42 ∼10% above baseline compared to control (Fig. 1O-R). For Aβ40, the overnight estimated difference between sleep-deprived and control conditions was +9.1% (SE 2.9, 95% CI 3.4 –14.8, p = 0.002). For Aβ42, the overnight estimated difference over the same period was +8.6% (SE 3.1, 95% CI 2.4 –14.9, p = 0.007). There was no significant difference in cosinor parameters between the sleep-deprived and control conditions for Aβ40 and Aβ42 (Table 5). Within intervention groups, Aβ42 linear rise was greater than Aβ40 under both sleep-deprived and control conditions (control: estimated difference –0.19, SE 0.07, 95% CI –0.36 - –0.01, p = 0.04; sleep deprivation: estimated difference –0.26, SE 0.04, 95% CI –0.35- –0.16, p < 0.001, Table 5, Fig. 2M-P). In the sleep-deprived group only, the Aβ40 mesor was greater than for Aβ42 (estimated difference +4.48, SE 0.75, 95% CI 2.7 –6.3, p = 0.001).
Comparison of cosinor parameters between interventions and isoforms for CSF Aβ40 and Aβ42
Aβ, amyloid-beta; CI, confidence intervals; df, degrees of freedom; CSF, cerebrospinal fluid; SD, sleep deprivation; h, hour.
DISCUSSION
We examined the relationship of cortisol, lactate, and glucose in plasma and CSF to CSF Aβ40 and Aβ42 under control normal sleep and 1-night of sleep deprivation conditions. We found that sleep deprivation increases Aβ40 and Aβ42 as previously reported [7] but this increase was not associated with increased stress or circadian disruption as measured by cortisol. Cortisol increases from stressors such as motion sickness [26], surgery [27], bacterial meningitis [28], and delirium [29]. The persistence of the cortisol circadian oscillation during sleep deprivation has been described and is consistent with our results [30]. These findings suggest that the effect of sleep deprivation on Aβ is not a function of increased stress or circadian disruption.
Increased CSF Aβ42 concentration following sleep deprivation has previously been reported in healthy middle-aged subjects [8]; however, we also detected a significant increase in Aβ40 concentration resulting from sleep deprivation. This could be due to differences in sampling frequency in the conditions or differences in assay sensitivity.
We also observed diurnal oscillations of lactate and glucose in both plasma and CSF. Glucose concentrations and cosinor parameters were not significantly different between conditions or between CSF and plasma. This was expected since glucose has not been reliably associated with changes in sleep-wake activity. Previous descriptions of CSF glucose fluctuations over the day have been associated with meal intake rather than circadian oscillation [31]. While ISF lactate in mice increases during wakefulness and decreases with sleep [25], we did not find that lactate concentration increased with sleep deprivation, although there was a delayed acrophase (or time to first peak) in plasma during sleep deprivation. Further, the CSF lactate acrophase was delayed relative to plasma when comparing both between and within conditions. While these results suggest changes in lactate due to sleep deprivation, the response is minimal compared to mice most likely due to sampling CSF in the lumbar region rather than from ISF in the brain. Intriguingly, the CSF glucose/lactate ratio decreased in the sleep-deprived group compared to controls for 6 hours after sleep deprivation began but did not persist over the 12-h overnight period tested in the other analyses and that was significant for CSF Aβ. These findings suggest that CSF glucose/lactate ratio may be acutely responsive to sleep deprivation. Future studies are needed to investigate the relationship between CSF glucose and lactate under different sleep conditions.
Interactions of circadian markers, such as melatonin or temperature variance (which typically oscillate in a predictable circadian pattern despite acute sleep deprivation) with CSF Aβ concentration were not directly measured, and may be an opportunity for future study. Endogenous circadian rhythms are disrupted in individuals with AD [32] and it is not known how this disturbance affects CSF AD biomarkers. In older subjects and in subjects with mild AD, the variability of CSF Aβ42 concentration over the day is relatively small relative to younger healthy subjects [33], suggesting these circadian oscillations and responses to sleep deprivation may be blunted with age. Future studies may further clarify the interaction of age, endogenous circadian rhythms, sleep deprivation, and CSF biomarkers.
In this study, we found that sleep deprivation increased CSF Aβ40 and Aβ42. Interestingly, previous studies found alteration in CSF metabolites and proteins with sleep-disordered breathing (e.g., obstructive sleep apnea) that have been associated with decreased CSF Aβ40 and Aβ42 [34, 35]. Our study included only participants without sleep-disordered breathing. These findings may suggest that the influence of sleep-disordered breathing on CSF proteins is not from sleep deprivation alone. The metabolic changes and hypoxia characteristic of sleep-disordered breathing that are not present in sleep deprivation may account for these differences. Further, sleep-disordered breathing may cause greater physiologic stress than sleep deprivation alone. Though exploratory, these results may further support sleep deprivation as an independent risk factor for AD, distinct from circadian disruption or stress. If true, these results may have implications for clinical screening for sleep disruption in middle-aged cognitively normal individuals.
In addition to the oscillation of CSF Aβ concentration over the 24-h day, other neuroproteins associated with neurodegenerative disease have also been studied in response to sleep deprivation. For instance, CSF tau increases with sleep deprivation while CSF α-synuclein concentration, which often coexists with Aβ neuropathologically, has been reported to both increase in response to sleep deprivation and not fluctuate diurnally [36–38]. Future studies are needed to ascertain the relationship between these proteins with changes in sleep-wake activity.
A strength of this study is the controlled sleep conditions with concurrent serial 2-h sampling of plasma and CSF for 36 h. Light exposure, however, was not controlled. Another limitation is that the sample size is small, although 5 of 11 participants repeated both intervention groups. We also did not adjust for multiple comparisons when comparing conditions and biofluids, potentially increasing type I error. Future studies in humans, such as constant routine under controlled light exposure or different dietary conditions, are needed to determine the effect of the circadian and metabolic systems on CSF Aβ. Future studies could also include randomized crossover designs with appropriate washout periods.
Footnotes
ACKNOWLEDGMENTS
We thank the participants for their contributions to this study. This study was supported by the National Institutes of Health: UL1 TR000448 and KL2 TR000450 (National Center for Advancing Translational Sciences); R03 AG047999, K76 AG054863, P50 AG005681, P01 AG026276 (National Institute on Aging); R01 NS065667 (National Institute of Neurological Disorders and Stroke); R01 DK093920 (National Institute of Diabetes and Digestive and Kidney Diseases). Additional support was provided by the McDonnell Center for Systems Neuroscience at Washington University School of Medicine, and discretionary funds from MetLife Foundation Award for Medical Research. The funding sources had no role in the study design, data collection, management, analysis, interpretation of the data, or manuscript preparation. We thank Dr. David Holtzman for use of the YSI analyzer.