
Abstract
Suspected non-Alzheimer’s disease pathology (SNAP) characterizes individuals showing neurodegeneration (e.g., hypometabolism) without amyloid-β (Aβ). Findings from previous studies regarding clinical and structural trajectories of SNAP are inconsistent. Using data from the Alzheimer’s Disease Neuroimaging Initiative, patients with amnestic mild cognitive impairment (MCI) were categorized into four groups: amyloid positive with hypometabolism (Aβ+ND+), amyloid only (Aβ+ND–), neither amyloid nor hypometabolism (Aβ–ND–), and SNAP (Aβ–ND+). Aβ+ND+(n = 33), Aβ+ND–(n = 32), and Aβ–ND–(n = 36) were matched to SNAP for age, gender, apolipoprotein E4 (apoE4) genotype, and scores on the Montreal Cognitive Assessment. Elderly controls (n = 40) were also matched to SNAP for age, gender, and apoE4 genotype. Longitudinal changes were compared across groups in terms of hippocampal volume, clinical symptoms, daily functioning, and cognitive functioning over a 2-year period. At baseline, no difference in cognition and functioning was observed between SNAP and Aβ+groups. SNAP showed worse clinical symptoms and impaired functioning at baseline compared to Aβ–ND–and controls. Two years of follow-up showed no differences in hippocampal volume changes between SNAP and any of the comparison groups. SNAP showed worse functional deterioration in comparison to Aβ–ND–and controls. However, Aβ+ND+ showed more severe changes in clinical symptoms in comparison to SNAP. Thus, patients with MCI and SNAP showed 1) more severe functional deterioration compared to Aβ–ND–and controls, 2) no differences with Aβ+ND–, and 3) less cognitive deterioration than Aβ+ND+. Future studies should investigate what causes SNAP, which is different from typical AD pathology and biomarker cascades.
INTRODUCTION
Patients with mild cognitive impairment (MCI) are believed to have greater cognitive functioning than patients with Alzheimer’s disease (AD), but worse cognitive functioning than healthy controls [5]. According to the amyloid cascade hypothesis, the central pathological event in AD is the lowering of cerebrospinal fluid (CSF) amyloid-β (Aβ), or accumulation of cortical Aβ [6]. Deposition of cortical Aβ has been widely accepted as hallmark of AD pathology [7]. The hypothetical model of AD biomarkers proposes that there is a temporal occurrence of biomarkers associated with AD; decreased CSF Aβ/increased cortical Aβ is the triggering event of this cascade, which is followed by tau-mediated neuronal injury, cortical hypometabolism, atrophy, and ultimately, cognitive deterioration [1, 2]. Based on the above-mentioned model, those who manifest downstream neurodegenerative biomarkers (e.g., cortical hypometabolism) will also show evidence of cortical Aβ. This notion is also corroborated by the strong association between the levels of cortical Aβ and hypometabolism, assessed using positron emission tomography (PET) [3]. Further, the synergistic effect of Aβ and cortical hypometabolism promotes cognitive decline in elderly controls, thus supporting that their interacting roles contribute to AD symptomatology [4].
Nevertheless, increasing evidence suggests that downstream neurodegeneration still occurs without the presence of Aβ. Individuals with suspected non-Alzheimer’s pathology (SNAP), which is a biomarker-based concept, are those who do not show evidence of Aβ but show manifestations of other neurodegenerative markers [8–10]. The current understanding of SNAP posits that it is a distinct illness group, which does not have a typical AD pathophysiological pathway [11, 12]. Approximately 25% of patients with mild to moderate probable AD do not have signs of cortical Aβ, suggesting that cortical Aβ accumulation may not be necessary for triggering AD symptomatology [13]. In addition, a PET study focusing on patients with amnestic MCI (aMCI) reported that 70% of amyloid negative patients showed signs of medial temporal atrophy [14], further reinforcing the evidence of neurodegenerative processes in the absence of Aβ.
Recently, investigating longitudinal clinical outcomes in individuals with SNAP has been of great interest. Several studies have focused on comparing trajectories of pathological or structural changes and cognitive deterioration between SNAP and different subgroups of preclinical AD (e.g., patients showing evidence of Aβ (Aβ+), patients showing evidence of both Aβ and neurodegeneration or neuronal injuries (e.g., cortical hypometabolism), and patients showing absence of both [4, 15–18]. Nevertheless, there are inconsistencies in the results of previous studies with respect to observed clinical and structural trajectories between the SNAP and comparison groups. Few studies are suggestive of profound progressive cognitive deterioration in SNAP. Petersen et al. showed that the highest conversion to dementia from MCI occurred among patients with Aβ+ND+ and SNAP, but not among patients with Aβ+ND–, suggesting that patients with SNAP may be at an advanced neurodegenerative stage akin to patients with Aβ+ND+ [17]. Similarly, Caroli et al. found that both MCI SNAP and Aβ+ND+ showed worse cognitive trajectories, as assessed by scores on the Mini-Mental State Examination (MMSE), in comparison to MCI Aβ–ND–[18]. The authors also observed the most severe hippocampal atrophy in the MCI SNAP group in comparison to MCI Aβ+, MCI Aβ+ND+, and MCI Aβ–ND–groups. These aforementioned findings undermine the amyloid cascade hypothesis by showing that structural deficits and cognitive decline still occur without Aβ.
However, some studies provide evidence supportive of the role of Aβ role in promoting cognitive decline; Aβ groups (Aβ+ND+ and Aβ+ND–) [11] and an Aβ+ND+ group from healthy elderly individuals show progressive cognitive deterioration [4], while SNAP and Aβ–ND–groups from cognitively normal elderly population show comparable clinical outcomes [15]. Similarly, there are negative findings regarding prominent changes in hippocampal volumes in the SNAP group of cognitive normal older adults [11, 16]. A recent review also reported that the risk of cognitive decline in patients with MCI is greatest in the Aβ+ND+ group, intermediate in the SNAP group, and lowest in Aβ+ ND–and Aβ–ND–groups [8]. Wisse et al. also found that patients with SNAP showed cognitive outcomes intermediate between Aβ+ND+ and Aβ–ND–[12].
Clinical and demographic factors, such as age, gender, baseline cognition, and apolipoprotein E (apoE4) differences strongly influence the longitudinal clinical and structural trajectories of individuals with Aβ+ND+, Aβ+ND–, Aβ–ND–, and SNAP. Previous literature reported higher age in the SNAP group in comparison to the Aβ–ND–group [12]. Moreover, lower proportions of apoE4 carriers have been reported in the SNAP group in comparison to Aβ+ [12, 19]. There are also differences in baseline clinical demographics between apoE4 carriers and non-carriers; among individuals with presence of AD pathology, apoE4 carriers showed faster rates of cognitive deterioration in comparison to non-carriers [11]. In addition, individuals with SNAP showed worse and better baseline cognition in comparison to individuals with Aβ–ND–and Aβ+ND+, respectively [12, 18]. Given that poor baseline cognitive functioning also predicts progression to AD [20], differences in age, apoE4 genotype profile, and baseline cognition among the groups may not allow for the sole investigation of the effects of biomarkers on progressive structural, functional, and cognitive deterioration in different subgroups of aMCI. Therefore, our study took these aforementioned variables into account while investigating longitudinal clinical and structural trajectories.
To the best of our knowledge, there has been no longitudinal study elucidating how cortical hypometabolism without Aβ pathology affects changes in hippocampal volume, clinical symptoms, daily functioning, and verbal learning and memory in MCI. Previous studies mainly focused on individuals with SNAP from cognitively healthy elderly individuals [4, 21] or individuals with subjective complaints [22]. In this study, we matched four comparison groups of MCI to the SNAP group in age, gender, apoE4 genotype profile, and baseline cognition; the four comparison groups were: 1) patients with MCI with amyloid and cortical hypometabolism (Aβ+ND+), 2) patients with MCI with amyloid only (Aβ+ND), 3) patients with MCI without amyloid nor cortical hypometabolism (Aβ–ND–), and 4) elderly controls without cognitive impairment. Unlike previous studies that have included patients with Aβ–ND–as a reference group, in the present study, the clinical and structural trajectories of other subgroups of MCI were compared to the MCI SNAP group.
MATERIALS AND METHODS
Participants and assessments
The entire database was downloaded from ADNI-1, ADNI-2, and ADNI Grand Opportunity (ADNI-GO) databases on October 22, 2015. Briefly, in ADNI-1, 800 participants, including controls, patients with aMCI, and patients with mild AD were recruited from 50 different sites in Canada and the United States. Detailed information regarding eligibility criteria is found in ADNI website (ADNI, http://www.adni.loni.usc.edu). In ADNI-2, 100 early-stage aMCI patients and 150 late-stage aMCI patients were recruited from 55 different sites from Canada and the United States. In ADNI-GO, 200 participants, including patients with mild AD and early aMCI were recruited. Eligibility criteria in ADNI-2 and ADNI-GO were identical to those in ADNI. Scores on the Functional activities questionnaire (FAQ) and Geriatric Depression Scale (GDS) were obtained from ADNI-1, ADNI-2, and ADNI-GO. For the present study, GDS were assessed within 6 months of temporal proximity from other clinical assessments.
Controls had scores on MMSE between 24–30 and a score on clinical dementia rating (CDR) of 0, and were not depressed, not MCI, and not demented. Patients with MCI had scores on MMSE between 24–30, a memory complaint, memory loss measured by Wechsler Memory Scale Logical Memory II, a score on CDR of 0.5, absence of significant levels of impairment in other cognitive domains, such as activities of daily living, and an absence of dementia.
Comparison groups (Aβ+ND+, Aβ+ND–and Aβ–ND–) were matched to SNAP at baseline based on gender, apoE4 genotype (number of allele: 0, 1, or 2), age, and scores on the Montreal Cognitive Assessment (MoCA). Controls were also matched to SNAP at baseline based on age, gender, and apoE4genotype.
Positron emission tomography
All imaging data including PET scans were collected from the ADNI database following the standard method listed in previous literature [23]. For our study, 18F-Fludeoxyglucose (FDG) PET and 18F-Florbetapir (AV-45) PET scans were used to measure cerebral glucose metabolism and levels of cortical Aβ, respectively. Global AV-45 standardized uptake value ratios (SUVR) were obtained by dividing the reuptake values of cortical regions-of-interests (ROIs) that are associated with increased Aβ (frontal, anterior cingulate, precuneus, and parietal) to those of the reference region cerebral grey matter. For the FDG-PET scans, the sum of SUVR of pre-defined ROIs, also known as “meta-ROIs”— the right and left angular gyri, bilateral posterior cingulate gyrus, and left and right middle/inferior temporal gyrus— with pons and vermis as a reference region, wereused.
CSF biomarkers and white matter hyperintensities
Data for CSF levels of tau, phosphorylated tau (p-tau), and Aβ42 is available on the ADNI website. Further description of how they were collected is included within previous literature [24]. Median values were used if more than one measurement was collected at a timepoint. Data for white matter hyperintensities (WMH) volumes was obtained from the ADNI website. They were adjusted for total intracranial volume and log-transformed for better normality. Further description of how they were collected is published within previous literature [25]. For the present study, WMH volumes were collected within 6 months of temporal proximity from other clinical or imagingassessments.
Magnetic resonance imaging and hippocampal volume analysis
All T1 structural images were obtained from the ADNI website. For the estimation of total brain volume (TBV), which is equivalent to the sum of grey matter and white matter, all T1 scans were analyzed using the Voxel-based morphometry (VBM)-8 toolbox (http://www.neuro.uni-jena.de/vbm/) using Statistical Parametric Mapping 8.0 (SPM8 - http://www.fil.ion.ucl.ac.uk/spm/) running on Matlab 6.5.
Using the Multiple Automatically Generated Templates (MAGeT Brain) algorithm [26, 27], fully automated segmentation of the hippocampal subfields was carried out. MAGeT Brain allows a modified multi-atlas segmentation that utilizes high resolution manually segmented MRI-labeled atlases as input files. In our study, the hippocampal subfields atlas was used [28]. Manually delineated hippocampus atlases are propagated through image registration to template images, which are the subset MRI scans from each group that serve as representatives of the group. Given that different field strengths existed among the T1 weighted images available in ADNI, template images were separately chosen for distinct participant subsets based on diagnosis (e.g., SNAP, Aβ+ND+, Aβ+ND–, Aβ–ND–, and controls) and tesla units (e.g., 3T and 1.5T). Where appropriate, 21 representative template images were selected, ensuring that group and tesla units were representative of subjects and remained consistent among each template set; when less than 21 subjects existed within a participant subset, a maximum odd number of templates was selected [26]. More details of MAGeT procedure are found within previous literature [29] using MAGeT methods. Hippocampus volumes, determined separately for the left and the right side, were calculated by taking the sums of cornus ammonis (CA) 1, CA2/CA3, CA4/dentate gyrus, stratum radiatum/stratum lacunosum/stratum moleculare, and subiculum volumes.
Suspected non-amyloid pathology
Patients with SNAP were defined as patients with aMCI who had AV-45 SUVR values <1.10 and global FDG SUVR 1 standard deviation (SD) below the baseline global FDG SUVR (sum of FDG SUVR of left and right angular, bilateral posterior cingulate and left and right temporal regions) of controls in ADNI (n = 521). Controls had global FDG SUVR mean values of 6.52 with SD of 0.56. Thus, patients with aMCI who had FDG SUVR <5.95 were considered to be cortical hypometabolic. The average SUVR of aforementioned five ROIs <1.19, which equals to 5.95 divided by 5 ROIs, was also used as a threshold for defining ND in previous literature [12]. An SUVR value of 1.10 was set as a threshold to distinguish amyloid positive from amyloid negative based on current literature using AV-45 to define amyloid positivity [30].
Comparison groups
There were total of three comparison groups consisting of patients with aMCI: Aβ+ND+, Aβ+ND–, and Aβ–ND–.
Aβ+ND+ patients were defined as patients with aMCI who showed AV-45 SUVR >1.10 and global FDG SUVR values <5.95.
Aβ+ND–patients were defined as patients with aMCI who showed AV-45 SUVR >1.10; these individuals had global FDG SUVR values >5.95.
Aβ–ND–patients were defined as patients with aMCI who showed AV-45 SUVR <1.10 and global FDG SUVR values >5.95.
The last comparison group was the control group. Controls were defined as elderly individuals who were diagnosed as controls without cognitive impairment at baseline. A flow chart of selecting patients with SNAP and four comparison groups is described in Fig. 1.

Flow chart showing selection of patients with SNAP and four comparison groups. Aβ, amyloid-β; AV-45, florbetapir; FDG, fludeoxyglucose; MCI, mild cognitive impairment; SNAP, suspected non-Alzheimer’s pathology; SUVR, standardized uptake value ratio.
Conversion to dementia was defined when subjects were either diagnosed as aMCI to dementia or dementia at the final time point.
Statistical analysis
Paired t-tests for continuous variables, Mcnemar’s test for binary discrete variables, and chi-square or Fisher’s Exact tests for non-binary discrete variables were performed among different subgroups. For the paired t-tests comparisons of CSF biomarker measurements, when only one or both of the matched pair was missing CSF biomarker data, the entire pair was excluded. Thus, paired t-tests for CSF biomarkers were carried out between only matched pairs that had CSF biomarker data.
Mixed-effect models were carried out to observe longitudinal changes: in clinical symptoms of dementia, as assessed by scores on clinical symptoms of dementia rating sum of box (CDRSB) and Alzheimer’s disease Assessment 13 items (ADAS-13); daily functioning, as assessed by scores on the FAQ; verbal learning and memory as assessed by different subdomain scores on Rey-auditory verbal learning tests (RAVLT); global cognition, as assessed by scores on MoCA; structural changes, as assessed by changes in hippocampal volume. The aforementioned clinical variables over the 2-year period were compared between 1) the SNAP and Aβ+ND+ group, 2) the SNAP and Aβ+ND–group, 3) the SNAP and Aβ–ND–group, and 4) the SNAP and control group; mixed model analysis, which included baseline aforementioned variables as covariates, group, time, and interaction between group and time as fixed effects, and a subject-specific intercept as a random effect was carried out. Similarly, hippocampal volumes over the 2-year period were compared, including TBV as a covariate, group, time, and interaction between group and time as fixed effects, and a subject-specific intercept as a random effect.
Statistical analyses were performed using Statistical Package for the Social Sciences Version 21.0 (IBM, New York, US). Threshold for statistical significance was set at p < 0.05.
RESULTS
SNAP versus Aβ+ND+
Baseline demographic and clinical profile
There were 33 patients with aMCI with Aβ+ND+ matched to patients with SNAP. There was no difference in clinical or demographic variables except for AV-45 SUVR. There was also no difference in WMH between groups. Levels of total tau and p-tau were higher in the Aβ+ND+ group in comparison to the SNAP group. There was lower CSF Aβ42 (thus, higher cortical Aβ) in the Aβ+ND+ group. Table 1 shows the baseline clinical and demographic variable comparisons between the SNAP and Aβ+ND+ group.
Comparison of baseline demographic and clinical profiles between the SNAP and matched Aβ+ND+ group
Aβ+ND+, patients with mild cognitive impairment with cortical Aβ and hypometabolism; ADAS-11, Alzheimer’s Assessment Scale 11 items; ADAS-13, Alzheimer’s Assessment scale 13 items; AV-45 SUVR, Florbetapir standardized uptake value ratio; CDRSB, Clinical dementia rating score sum of boxes; CVD, cardiovascular disease; FAQ, Functional Assessment Questionnaire; FDG SUVR, Fludeoxyglucose standardized uptake value ratio; GDS, Geriatric Depression Scale score; MMSE, Mini-Mental State Examination score; MoCA, Montreal Cognitive Assessment; p-tau, phosphorylated tau protein; RAVLT immediate, Rey Auditory Verbal Learning Test immediate recall score (sum of 5 trials); RAVLT forgetting, Rey Auditory Verbal Learning Test forgetting score (trial 5- delayed); RAVLT learning, Rey Auditory Verbal Learning Test learning (trial 5- trial 1); RAVLT_ % forgetting, Rey Auditory Verbal Learning Test percentage of forgetting; SNAP, suspected non-Alzheimer’s pathology; tau, total tau protein; TBV, total brain volume; WMH, white matter hyperintensities. apaired t-test; bMcNemar’s test; cchi-square test; dFisher’s Exact test. *indicates statistical significance p < 0.05.
Longitudinal clinical trajectories
Mixed model analysis showed that the Aβ+ND+ group showed more rapidly deteriorating clinical symptoms of dementia, as assessed by scores on CDRSB, controlling for baseline CDRSB score (p = 0.01) (Fig. 2a) and immediate learning memory assessed by RAVLT immediate, controlling for baseline RAVLT immediate score (p = 0.01) (Fig. 2b). A summary of clinical and structural trajectories between the SNAP and all comparison groups is shown in Table 4.
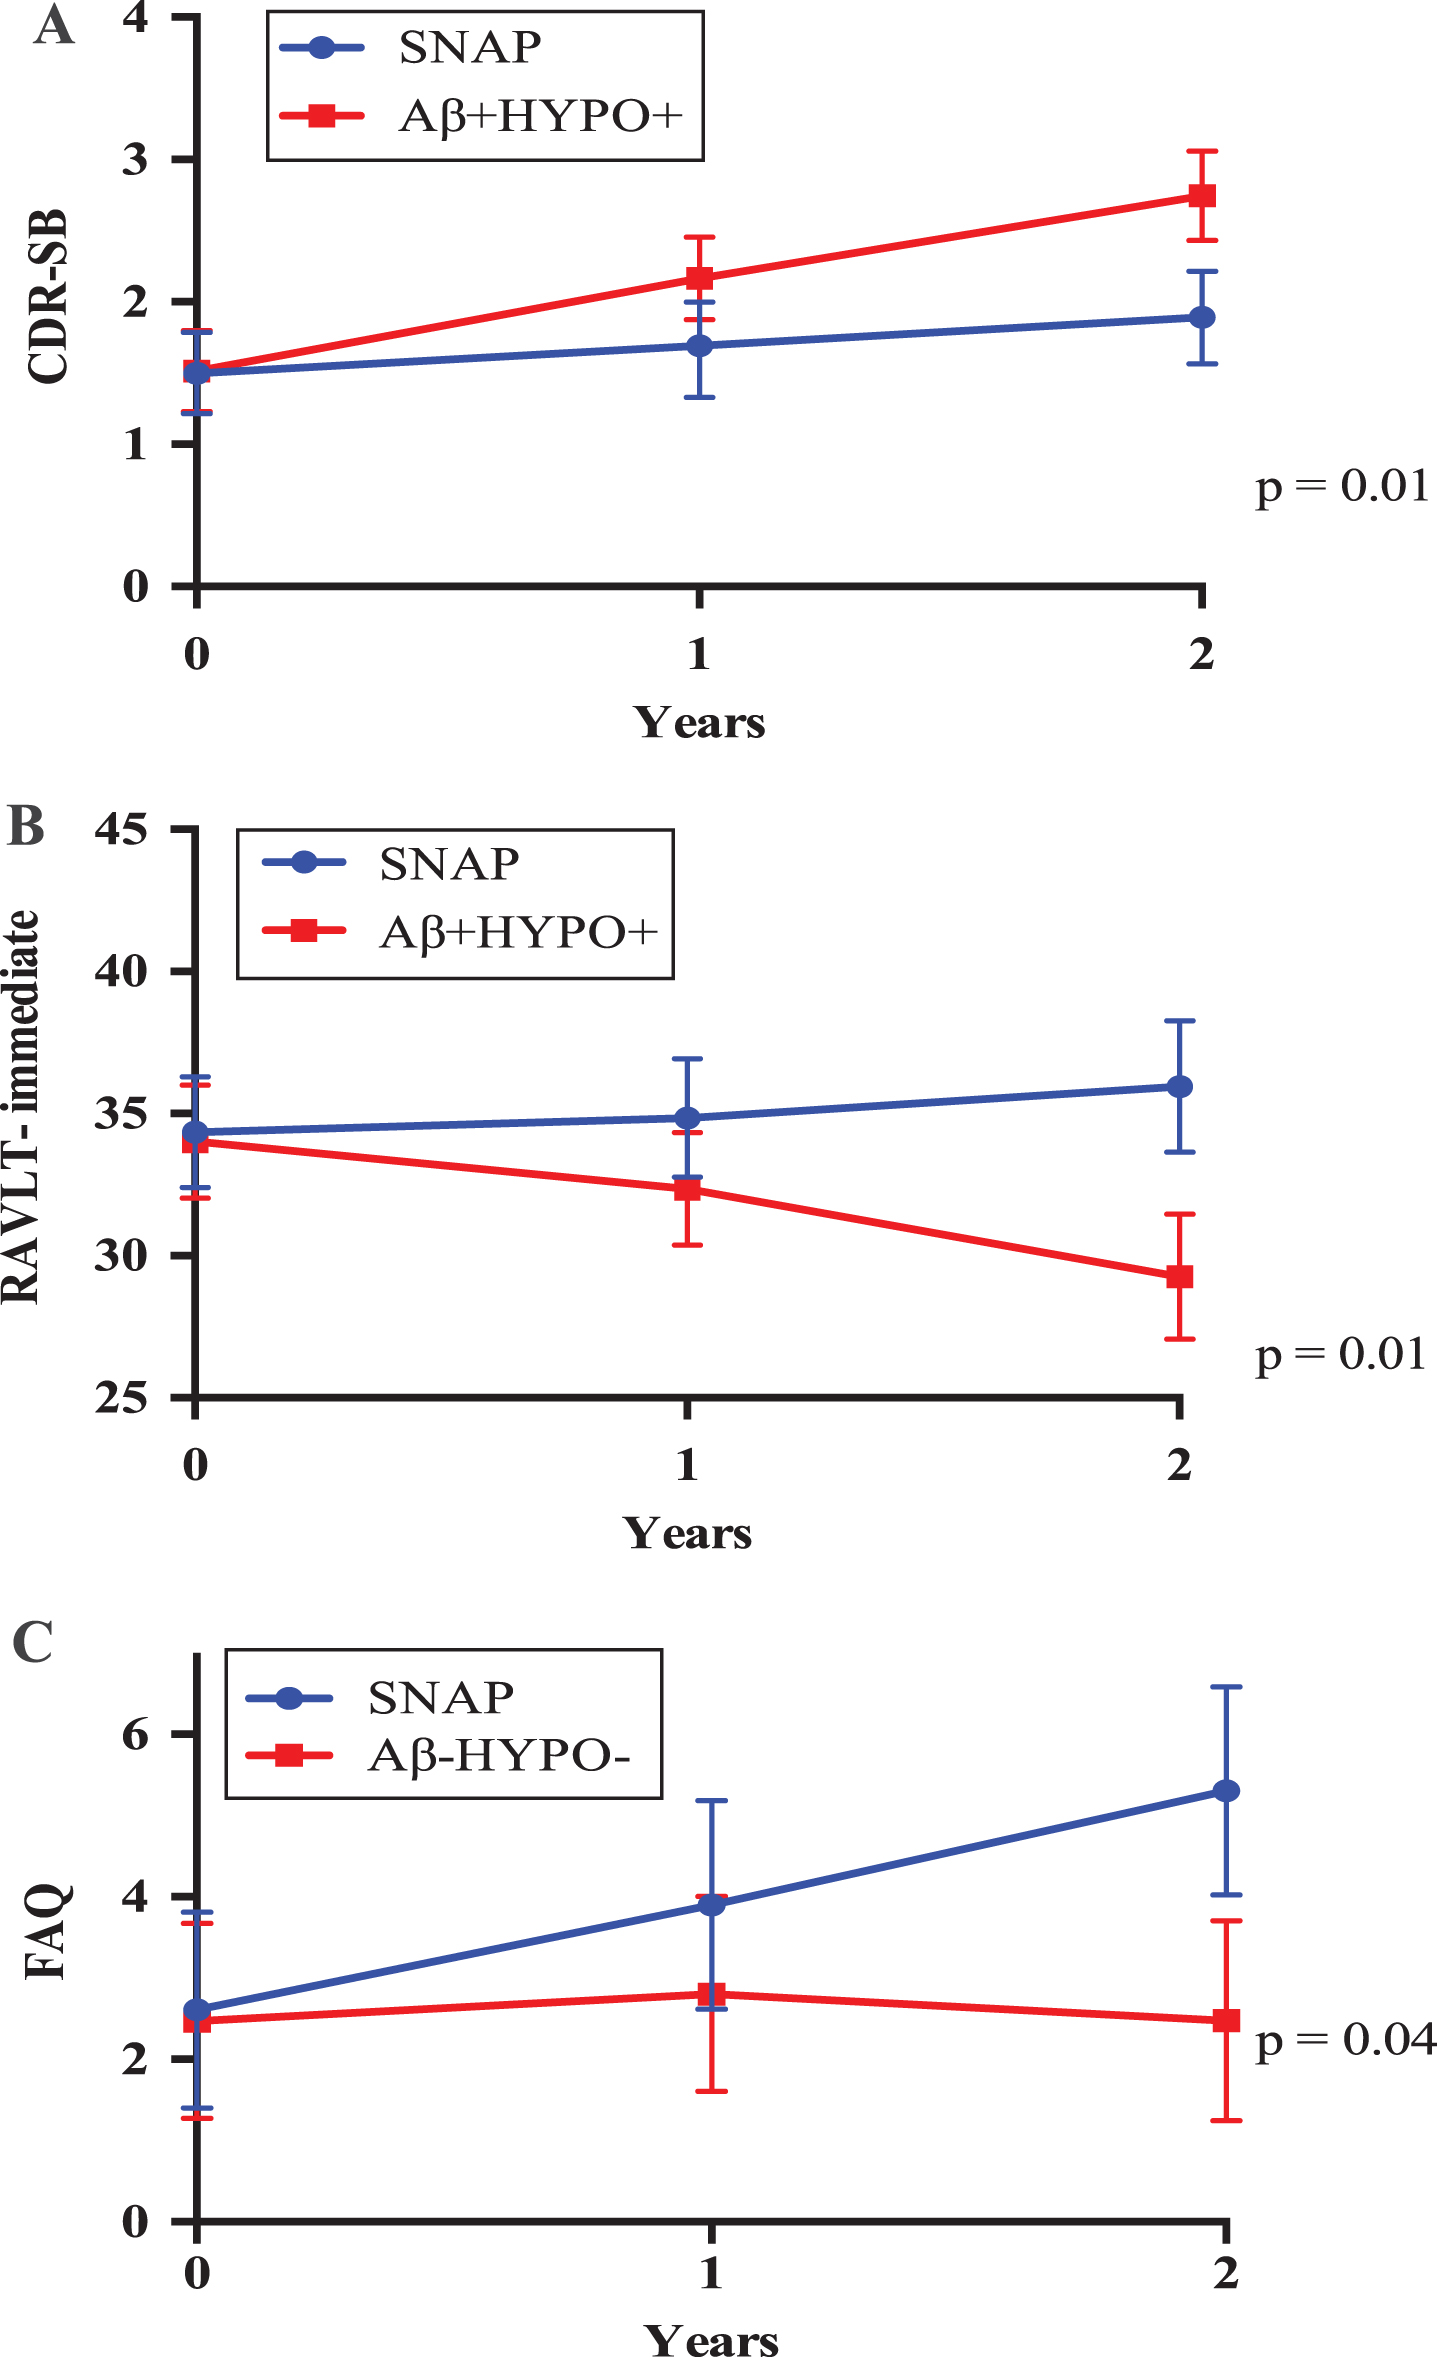
Changes in (A) clinical symptoms of dementia and (B) RAVLT-immediate score between the SNAP and matched Aβ+ND+ group over 2 years; (C) changes in functions between the SNAP and matched Aβ–ND–group over 2 years. Estimated marginal means correspond to means of scores on (A) CDRSB, (B) RAVLT-immediate, (C) FAQ, adjusted for baseline scores on CDRSB, RAVLT-immediate and FAQ, respectively, with 95% confidence intervals. Aβ+ND+, patients with mild cognitive impairment with cortical Aβ and hypometabolism; Aβ–ND–, patients with mild cognitive impairment without cortical Aβ and hypometabolism; CDRSB, Clinical dementia rating score sum of boxes; FAQ, Functional Assessment Questionnaire; SNAP, suspected non-Alzheimer’s pathology.
Comparison of baseline demographic and clinical profiles between the SNAP and matched Aβ+ND–group
Aβ+ND–, patients with mild cognitive impairment with cortical Aβ only; ADAS-11, Alzheimer’s Assessment Scale 11 items; ADAS-13, Alzheimer’s Assessment scale 13 items; AV-45 SUVR, Florbetapir standardized uptake value ratio; CDRSB, Clinical dementia rating score sum of boxes; CVD, cardiovascular disease; FAQ, Functional Assessment Questionnaire; FDG SUVR, Fludeoxyglucose standardized uptake value ratio; GDS, Geriatric Depression Scale score; MMSE, Mini-Mental State Examination score; MoCA, Montreal Cognitive Assessment; p-tau, phosphorylated tau protein; RAVLT immediate, Rey Auditory Verbal Learning Test immediate recall score (sum of 5 trials); RAVLT forgetting, Rey Auditory Verbal Learning Test forgetting score (trial 5- delayed); RAVLT learning, Rey Auditory Verbal Learning Test learning (trial 5- trial 1); RAVLT_% forgetting, Rey Auditory Verbal Learning Test percentage of forgetting; SNAP, suspected non-Alzheimer’s pathology; tau, total tau protein; TBV, total brain volume; WMH, white matter hyperintensities. apaired t-test; bMcNemar’s test; cchi-square test; dFisher’s Exact test. *indicates statistical significance p < 0.05.
Comparison of baseline demographic and clinical profiles between the SNAP and matched Aβ–ND–group
Aβ–ND–, patients with mild cognitive impairment without cortical Aβ and hypometabolism; ADAS-11, Alzheimer’s Assessment Scale 11 items; ADAS-13, Alzheimer’s Assessment scale 13 items; AV-45 SUVR, Florbetapir standardized uptake value ratio; CDRSB, Clinical dementia rating score sum of boxes; CVD, cardiovascular disease; FAQ, Functional Assessment Questionnaire; FDG SUVR, Fludeoxyglucose standardized uptake value ratio; GDS, Geriatric Depression Scale score; MMSE, Mini-Mental State Examination score; MoCA, Montreal Cognitive Assessment; p-tau, phosphorylated tau protein; RAVLT immediate, Rey Auditory Verbal Learning Test immediate recall score (sum of 5 trials); RAVLT forgetting, Rey Auditory Verbal Learning Test forgetting score (trial 5- delayed); RAVLT learning, Rey Auditory Verbal Learning Test learning (trial 5- trial 1); RAVLT_% forgetting, Rey Auditory Verbal Learning Test percentage of forgetting; SNAP, suspected non-Alzheimer’s pathology; tau, total tau protein; TBV, total brain volume; WMH, white matter hyperintensities. apaired t-test; bMcNemar’s test; cchi-square test; dFisher’s Exact test. *indicates statistical significance p < 0.05.
Summary of clinical and hippocampal trajectories between the SNAP and matched four comparison groups
Aβ+ND+, patients with mild cognitive impairment with cortical Aβ and hypometabolism; Aβ+ND–, patients with mild cognitive impairment with cortical Aβ only; Aβ–ND–, patients with mild cognitive impairment without cortical Aβ and hypometabolism; ADAS-11, Alzheimer’s Assessment Scale 11 items; ADAS-13, Alzheimer’s Assessment scale 13 items; CDRSB, Clinical dementia rating score sum of boxes; FAQ, Functional Assessment Questionnaire; MoCA, Montreal Cognitive Assessment; p-tau, phosphorylated tau protein; RAVLT immediate, Rey Auditory Verbal Learning Test immediate recall score (sum of 5 trials); RAVLT forgetting, Rey Auditory Verbal Learning Test forgetting score (trial 5- delayed); RAVLT learning, Rey Auditory Verbal Learning Test learning (trial 5- trial 1); RAVLT_% forgetting, Rey Auditory Verbal Learning Test percentage of forgetting; SNAP, suspected non-Alzheimer’s pathology. aestimated marginal means, which are adjusted for baseline clinical assessments. bestimated marginal means, which are adjusted for total brain volume. *indicates statistical significance p < 0.05.
Three patients out of 26 SNAP patients (11.54%) converted to dementia while 23 patients (88.46%) stayed as MCI during the 2-year follow-up period. Seven patients did not have their final diagnosis reported at the final time points. On the other hand, 11 out of 28 Aβ+ND+ patients (39.29%) converted to dementia while 17 patients (60.71%) stayed as MCI. Five patients did not have their final diagnosis reported. Conversion rate to dementia was higher in the Aβ+ND+ group (p = 0.03).
Longitudinal hippocampal volume loss
Mixed model analysis showed no differences in changes in right (p = 0.47) and left hippocampal volume (p = 0.89) atrophy between the groups, controlling for TBV.
SNAP versus Aβ+ND–
Baseline demographic and clinical profile
There were 32 patients with aMCI with Aβ+ND–matched to patients with SNAP. There was no difference in clinical or demographic variables except for FDG and AV-45 SUVR. Aβ+ND–group showed higher levels of total tau and p-tau in comparison to the SNAP group. There was lower CSF Aβ42 in the Aβ+ND–group. Table 2 shows the baseline clinical and demographic variable comparisons between the SNAP and Aβ+ND–group.
Longitudinal clinical trajectories
Mixed model analysis showed no differences in changes in scores on MoCA, CDRSB, any domain of RAVLT, and FAQ, after controlling for baseline scores on aforementioned assessments.
Two out of 25 SNAP patients (8%) converted to dementia while 22 patients (88%) stayed as MCIduring the 2-year follow-up period. Seven patients did not have their final diagnosis reported at the final time points. On the other hand, all 32 Aβ+ND–patients stayed as MCI. There was no difference in conversion rate to dementia between the groups(p = 0.19).
Longitudinal hippocampal volume change
Mixed model analysis showed no differences in changes in left (p = 0.25) and right (p = 0.19) hippocampal volume between the groups, controlling for TBV.
SNAP versus Aβ–ND–
Baseline demographic and clinical profile
There were 36 patients with aMCI with Aβ–ND–matched to patients with SNAP. Patients with SNAP showed smaller left hippocampal volume in comparison to patients with Aβ–ND–. In addition, cortical hypometabolism, as assessed by PET-FDG, was more severe in the SNAP group. In terms of baseline clinical demographics, the SNAP group showed worse clinical symptoms of dementia, functioning and slightly worse scores on ADAS-11. There was no difference in levels of tau and p-tau between the groups. Table 3 shows the baseline clinical and demographic variable comparisons between the SNAP and Aβ–ND–group.
Longitudinal clinical trajectories
Mixed model analysis showed more rapidly deteriorating function in the SNAP group, controlling for baseline FAQ scores (p = 0.04) (Fig. 2c).
Four out of 28 SNAP patients (14.29%) converted to dementia and 24 patients (85.71%) stayed as MCI during the 2-year follow-up period. Eight patients did not have their final diagnosis reported at the final time points. Nonetheless, two out of 34 Aβ–ND–patients (5.88%) reverted back to control and the remaining 32 patients (94.12%) stayed as MCI during the 2-year follow-up period. Two patients did not have their final diagnosis reported at the final time points. Conversion rate to dementia was higher in the SNAP group (p < 0.04).
Longitudinal hippocampal volume loss
Mixed model analysis showed no differences in changes in left (p = 0.16) and right (p = 0.19) hippocampal volume, after controlling for TBV.
SNAP versus Controls
Baseline demographic and clinical profile
There were 40 controls matched to patients with SNAP. The SNAP group showed smaller bilateral hippocampal volume and worse cortical hypometabolism. SNAP showed worse scores on most clinical and functional assessments in comparison to controls. Supplementary Table 1 shows the baseline clinical and demographic variable comparisons between the SNAP and control group.
Longitudinal clinical trajectories
Mixed model analysis showed a more rapid decline of scores on ADAS-13 (p = 0.03), after controlling for baseline ADAS-13 scores, and function (p = 0.02), after controlling for baseline FAQ scores, in individuals with SNAP in comparison to controls. In addition, there was slightly faster deterioration of scores on RAVLT-learning (p = 0.06), after controlling for baseline RAVLT-learning scores in the SNAP group in comparison to the controlgroup.
Four out of 31 SNAP patients (12.90%) converted to dementia and 27 patients (87.10%) stayed as MCI during the 2-year follow-up period. Nine patients did not have their final diagnosis reported at the final time points. Only one out of 35 controls (2.86%) converted to dementia and one (2.86%) converted to MCI. The remaining 33 controls (94.29%) stayed as controls. Five controls did not have their final diagnosis reported at the final time points.
Longitudinal hippocampal volume loss
Mixed model analysis showed no differences in changes in left (p = 0.54) and right hippocampal volume (p = 0.75), controlling for TBV.
DISCUSSION
Our study investigated baseline and longitudinal clinical and structural profiles between aMCI patients with SNAP and matched aMCI groups (Aβ+ND+, Aβ+ND–, and Aβ–ND–). Groups were matched on age, gender, apoE4 genotype profile, and baseline cognition, and were categorized based on levels of cortical hypometabolism and Aβ using PET.
In terms of baseline clinical profiles, there was no difference between the SNAP and Aβ+ND+ group, except for lower levels of total tau and p-tau in the former. Given that the SNAP group also showed normal (lower) levels of total tau and p-tau in comparison to the matched Aβ+ND–group, amyloid and tau pathology appear to be highly associated with one another. Evidence suggests that there is a bi-directional relationship between Aβ and tau; Aβ triggers the conversion of tau into more toxic forms, whereas tau increases Aβ toxicity [31]. Lower levels of total tau and p-tau in the SNAP group in comparison to the Aβ+ groups have been previously reported [12, 21]. In addition, similar to previous literature [18], our findings also suggested that the SNAP group showed numerically the smallest bilateral hippocampal volume at baseline among all thegroups.
Despite no differences in baseline clinical symptoms of dementia between the SNAP and Aβ+ND+ group, the latter showed worse trajectories of clinical symptoms of dementia. They also showed a higher conversion rate (39.29%) to dementia in comparison to the SNAP (11.54%) group. This number was close to the conversion rate to dementia of patients with Aβ+ND+ previously reported using large samples from the ADNI database (42%) [12]. Thus, our finding was consistent with previous findings by Prestia et al., who found patients with MCI who were positive on three AD biomarkers showed the highest incidence of progression to dementia compared to those who were positive on one or two biomarkers [32].
In addition, we did not see any difference in baseline clinical and demographic profiles and longitudinal trajectories between patients with SNAP and Aβ+ND–. Our findings suggest that cortical hypometabolism and Aβ pathologies in aMCI lead to similar clinical outcomes. This finding is consistent with the finding by Mormino et al., who demonstrated no difference in changes in composite scores in cognition between SNAP and Aβ+ND–. The same authors also noted that SNAP showed worse deterioration in composite cognition scores in comparison to Aβ–ND–, but less severe in comparison to Aβ+ND+. Similarly, we found that more individuals from the SNAP group converted to dementia in comparison to the Aβ+ND–group.There may be two explanations regarding the low rates of progression to dementia in patients with Aβ+ND–, which showed both high levels of cortical Aβ and CSF total tau and p-tau. First of all, by definition from the National Institute of Aging and the Alzheimer’s Association, individuals with Aβ+ND–are in preclinical stage 1 of AD [33]. Previous literature followed up to 6 years to observe high probability of progression to dementia in this group [11]. Therefore, two years of follow-up may have been too short to observe drastic cognitive deterioration. With additional years of follow-up, this group is likely to manifest downstream AD pathology (i.e., cortical hypometabolism), and eventually progress to dementia. This hypothesis is supported by our findings, which indicate that patients with Aβ+ND+, who manifest both elevated Aβ and CSF total tau and p-tau, show higher conversion rates to dementia and more deterioration in clinical symptoms of dementia in comparison to matched SNAP patients. Secondly, the apoE4 gene is known to be essential for deposition of cortical Aβ [34]. Nonetheless, apoE4 genotype profile was matched between SNAP and Aβ+ND–patients. Only 8 out of 32 patients with Aβ+ND–had one or more apoE4 allele; thus, this low proportion of apoE4 carriers in Aβ+ND–group may explain the low incidence of conversion to dementia in this population.
Patients with SNAP showed smaller hippocampal volume at baseline in comparison to Aβ–ND–and controls. SNAP also showed more severe functioning and clinical symptoms of dementia at baseline. Furthermore, the SNAP group showed more prominent functional deterioration longitudinally in comparison to both matched Aβ–ND–and control groups. However, no difference in changes in clinical symptoms of dementia was observed between the SNAP and Aβ–ND–groups over the 2-year period. CDRSB assesses both functioning and different areas of cognition (memory, orientation and problem solving), whereas FAQ specifically measures subjects’ daily functional capacities. This explicates that patients with SNAP specifically show faster deterioration in daily functioning, but not necessarily accelerated exacerbation in cognitive functioning in comparison to Aβ–ND–and controls.
Despite smaller baseline hippocampal volumes in patients with SNAP, no differences in hippocampal volume changes between the SNAP and Aβ–ND–groups, and between the SNAP and controls were found. The Aβ–ND–group did not show hippocampal volume loss over the follow-up period, unlike other comparison groups, who showed progressive hippocampal volume loss over 2 years of follow-up. Aβ–ND–patients are especially interesting since they are diagnosed as aMCI despite showing no evidence of relevant AD pathology. Our 2-year follow-up data showed only 2 out of 34 Aβ–ND–patients reverted back to controls; thus, this low reversion rate rules out the possibility of them being misdiagnosed as aMCI at baseline. Thus, cognitive impairment seen in this group may have causes other than typical AD.
Notably, elderly controls showed higher levels of cortical Aβ at baseline in comparison to SNAP aMCI patients. This finding is of particular interest since the SNAP group showed overall worse daily and cognitive functioning, including higher symptoms of dementia and depressive symptoms, in comparison to controls. The average AV45-SUVR of controls was 1.10, which was the threshold of Aβ positivity used in this study. Further, only one control converted to dementia. Collectively this suggests that elderly controls, despite having relatively high levels of Aβ to patients with aMCI with SNAP longitudinally, may have high cognitive reserve to protect them from developing cognitive impairment [35].
One of the strengths of our study is that we used various assessments to observe clinical and functional trajectories in aMCI, including CDRSB, FAQ, and subdomain scores of RAVLT in addition to scores on MMSE as used by Caroli et al. [18]. Another strength is that unlike previous studies, which utilized two ways of defining ND based on hippocampal atrophies or/and cortical hypometabolism [12, 18], we only used one criterion to define ND, which was cortical hypometabolism assessed by PET-FDG. This specific criterion could eliminate selecting heterogeneous groups of patients with SNAP. Another strength is that we utilized AV-45 to measure levels of cortical Aβ. Measuring cortical Aβ deposition using PET has a high agreement with measuring Aβ using CSF method [36]. Given that we also observed significantly lower levels of CSF Aβ42 both in Aβ+ND+ and Aβ+ND–group in comparison to the SNAP group, we confirmed low levels of Aβ in the SNAP group using both CSF and PET methods.
Our study should be considered in light of its several limitations. First, we defined Aβ positivity and cortical hypometabolism using PET. ADNI database collects PET data using different PET scanners from different sites, thus inter-scanner variability is a common limitation for studies using large databases. ADNI adopted the 3-Dimensional Hoffman brain phantom method to attenuate inter-scanner variability. Nonetheless, it is important to improve this correction method to further reduce variability [37]. Second, our sample sizes were relatively small due to matching of patients with SNAP to the comparison groups based on important confounding variables. However, the SNAP and comparison groups with aMCI were matched in age, gender, apoE4 genotype, and global cognition to reduce the confounding effects of these important aforementioned variables on progressive structural and clinical trajectories. Third, our follow-up of 2 years may have been too short. This period may not allow for the identification of significant changes in clinical profiles and hippocampal volume of patients with aMCI, and may partially explain negative findings regarding hippocampal volume changes between the SNAP and comparison groups. Moreover, we were not able to compare age of conversion to dementia between the SNAP and comparison groups as only a few patients converted to dementia from Aβ–ND–and Aβ+ND–. Fourth, many subjects did not report their final diagnostic and biomarker profiles. Thus, when we estimated the conversion rate to dementia from aMCI, many subjects were not included in the calculation. Further, we were not able to observe how subjects changed with respect to their biomarker profiles after 2 years. Jack and his colleagues have suggested that since a high proportion of individuals with SNAP become Aβ+ over time, many individuals with SNAP may be at a close threshold of Aβ+ at baseline [8]. In our study, due to many subjects missing follow-up PET scans, we were unable to determine how many patients with SNAP turned Aβ+ over time. Lastly, it is important to note that Aβ–independent neurodegeneration in aMCI can be influenced by other forms of neurodegenerative conditions, such as vascular dementia, hippocampal sclerosis, and α-synucleinopathy. As with other ADNI studies, our investigation relies on clinical diagnoses of aMCI for group classification of participants. However, ADNI does not specifically indicate presence of neurodegenerative conditions in participants included in this study.
In conclusion, our study shows that downstream structural alterations like hippocampal atrophy and consequent progressive cognitive decline may also occur without Aβ pathology. Future studies using larger samples and longer follow-up periods should investigate the heterogeneous causes underlying SNAP to help understand this distinct subgroup of patients with MCI.
Footnotes
ACKNOWLEDGMENTS
Data collection and sharing for this project was funded by the Alzheimer’s Disease Neuroimaging Initiative (ADNI) (National Institutes of Health Grant U01 AG024904) and DOD ADNI (Department of Defense award number W81XWH-12-2-0012). ADNI is funded by the National Institute on Aging, the National Institute of Biomedical Imaging and Bioengineering, and through generous contributions from the following: AbbVie, Alzheimer’s Association; Alzheimer’s Drug Discovery Foundation; Araclon Biotech; BioClinica, Inc.; Biogen; Bristol-Myers Squibb Company; CereSpir, Inc.; Cogstate; Eisai Inc.; Elan Pharmaceuticals, Inc.; Eli Lilly and Company; EuroImmun; F. Hoffmann-La Roche Ltd and its affiliated company Genentech, Inc.; Fujirebio; GE Healthcare; IXICO Ltd.; Janssen Alzheimer Immunotherapy Research & Development, LLC.; Johnson & Johnson Pharmaceutical Research & Development LLC.; Lumosity; Lundbeck; Merck & Co., Inc.; Meso Scale Diagnostics, LLC.; NeuroRx Research; Neurotrack Technologies; Novartis Pharmaceuticals Corporation; Pfizer Inc.; Piramal Imaging; Servier; Takeda Pharmaceutical Company; and Transition Therapeutics. The Canadian Institutes of Health Research is providing funds to support ADNI clinical sites in Canada. Private sector contributions are facilitated by the Foundation for the National Institutes of Health (![]() ). The grantee organization is the Northern California Institute for Research and Education, and the study is coordinated by the Alzheimer’s Therapeutic Research Institute at the University of Southern California. ADNI data are disseminated by the Laboratory for Neuro Imaging at the University of Southern California.
). The grantee organization is the Northern California Institute for Research and Education, and the study is coordinated by the Alzheimer’s Therapeutic Research Institute at the University of Southern California. ADNI data are disseminated by the Laboratory for Neuro Imaging at the University of Southern California.
APPENDIX A
The ADNI was launched in 2003 by the National Institute on Aging (NIA), the National Institute of Biomedical Imaging and Bioengineering (NIBIB), the Food and Drug Administration (FDA), private pharmaceutical companies and non-profit organizations, as a $60 million, 5-year public private partnership. The primary goal of ADNI has been to test whether serial magnetic resonance imaging (MRI), positron emission tomography (PET), other biological markers, and clinical and neuropsychological assessment can be combined to measure the progression of mild cognitive impairment (MCI) and early Alzheimer’s disease (AD). Determination of sensitive and specific markers of very early AD progression is intended to aid researchers and clinicians to develop new treatments and monitor their effectiveness, as well as lessen the time and cost of clinical trials. The Principal Investigator of this initiative is Michael W. Weiner, MD, VA Medical Center and University of California –San Francisco. ADNI is the result of efforts of many coinvestigators from a broad range of academic institutions and private corporations, and subjects have been recruited from over 50 sites across the U.S. and Canada. The initial goal of ADNI was to recruit 800 subjects but ADNI has been followed by ADNI-GO and ADNI-2. To date these three protocols have recruited over 1500 adults, ages 55 to 90, to participate in the research, consisting of cognitively normal older individuals, people with early or late MCI, and people with early AD. The follow up duration of each group is specified in the protocols for ADNI-1, ADNI-2 and ADNI-GO. Subjects originally recruited for ADNI-1 and ADNI-GO had the option to be followed in ADNI-2. For up-to-date information, see http://www.adni-info.org.