
Abstract
Background
Individuals with subjective cognitive decline (SCD) are at high risk of preclinical Alzheimer's disease (AD). While olfactory dysfunction is evident in AD and mild cognitive impairment (MCI), its presence and neural mechanism in SCD remain unclear.
Objective
This study examined functional connectivity (FC) alterations across olfactory networks and their mediating role between olfactory and cognitive functions in SCD and MCI.
Methods
Eighty SCD, 51 MCI, and 80 normal controls underwent cognitive and olfactory tests and resting-state functional magnetic resonance imaging scanning. Two olfactory networks (primary and advanced), each with six selected spherical regions, were defined. We compared FCs within and between networks, examined correlations with olfactory and cognitive functions, performed mediation analysis, and evaluated classification via receiver operating characteristic curves.
Results
SCD participants presented increased FCs in key regions with normal olfactory scores, while MCI patients exhibited reduced FCs and olfactory scores. Altered FCs correlated with olfactory performance and mediated the relationship between olfactory and cognitive functions. FC features effectively distinguished SCD from normal controls.
Conclusions
Increased FCs in SCD indicated a significant compensatory neural mechanism for the disrupted FCs in MCI, leading to an apparent normal olfactory function in SCD participants. Moreover, the findings suggest that olfactory deficits may be associated with cognitive decline rather than solely impaired olfactory sensory processing. As such olfactory deficits could be a proxy for cognitive decline in AD and the altered FCs could aid in the early detection of individuals at high risk for preclinical AD.
Keywords
Introduction
Alzheimer's disease (AD) is a progressive neurodegenerative disease, divided into three main stages: preclinical AD, mild cognitive impairment (MCI) due to AD, and AD dementia. 1 Subjective cognitive decline (SCD) refers to a self-perceived decline in memory function, while objective neuropsychological assessments do not meet the criteria for cognitive impairment, representing a high-risk group for the preclinical stage of AD. 2 Since late-stage AD is incurable, neuroscientists are increasingly focusing on the early identification of the preclinical stage of AD such that preventive interventions can be devised before significant neuronal damages occur to delay the onset and slow down the progression of the disease. 3
It is well known that MCI and AD patients have prominent olfactory dysfunction, which appears before the impairment of cognitive functions such as memory can be detected. 4 Previous studies have confirmed that olfactory dysfunction in AD patients is closely related to pathological changes such as amyloid-β (Aβ) and tau protein affecting the brain regions involved in processing olfactory preocessing.5–7 Studies have confirmed that olfactory dysfunction predicts cognitive impairment in the progression of AD.8,9 Research reveals olfactory cortical atrophy 10 and significant changes in the functional connectivity (FC) of olfactory circuits in patients with AD and MCI. 11 Currently, neuroimaging studies related to olfaction in the AD spectrum primarily focus on the imaging characteristics of the entire olfactory system. However, olfactory dysfunction is also common in other neurodegenerative diseases such as Parkinson's disease. 12 The affected brain regions in different neurodegenerative diseases with olfactory dysfunction show both overlap and heterogeneity. 13 Research suggests that the orbitofrontal cortex, entorhinal cortex, piriform cortex, hippocampus, insular cortex, and amygdala, which are involved in processing olfactory information, are vulnerable regions in the course of AD. 4 Additionally, previous research has primarily focused on the olfactory function of MCI and AD patients, 14 while little is known about whether SCD individuals have olfactory impairment and the underlying neural mechanisms.
The present study aimed to identify olfactory deficits in individuals with SCD, to investigate whether the olfactory networks (composed of AD-vulnerable brain regions) undergo reorganization through FC analysis, and to explore the relationship between olfactory function and cognitive performance. We hypothesized that the olfactory function in normal control (NC), SCD, and MCI patients would progressively decrease and that the FCs of the olfactory networks would be significantly altered, leading to olfactory deficits. We also speculated that altered FCs could mediate the relationship between olfactory function and cognitive function and contribute to the differential diagnosis among the three groups.
Methods
Participants
The study was approved by the Ethics Committee of Nanjing Drum Tower Hospital and conducted following the Declaration of Helsinki. All participants signed informed consent statements. The inclusion, exclusion, and diagnostic criteria were all based on the protocol for the Sino Longitudinal Study on Cognitive Decline (SILCODE). 15 Inclusion criteria: 55–79 years old, right-handed, with at least 8 years of educational experience. Exclusion criteria: Severe depression and anxiety; cerebrovascular diseases (such as stroke); other neurological disorders that may lead to cognitive decline (such as brain tumors, Parkinson's disease, encephalitis, epilepsy, etc.); diseases that may affect olfactory function (such as severe rhinitis, nasal polyps, nasopharyngeal carcinoma, and a history of nasal surgery, etc.); and contraindications for magnetic resonance imaging (MRI) examination.
The diagnosis of SCD was based on the criteria proposed by Jessen et al.: 2 (1) A chief complaint of memory decline in the past 5 years; (2) Concerns related to memory decline; (3) Objective cognitive tests did not meet the diagnostic criteria for MCI. The diagnosis of MCI was based on the criteria proposed by Jak et al. 16 Specifically, three cognitive domains each containing two subtests were assessed: Animal Fluency Test (AFT) 17 and Boston Naming Test (BNT) 18 for language function; Auditory Verbal Learning Test (AVLT) long-delayed memory and AVLT recognition test 19 for memory function; Trail Making Test Part A (TMT-A) and part B (TMT-B) 20 for executive function. Participants with no cognitive complaints and associated worries, and who did not meet the diagnostic criteria for MCI, were recruited as NCs. The study included 80 participants with SCD, 51 patients with MCI, and 80 NCs.
Neuropsychological evaluation
All participants completed a set of standardized neuropsychological tests. Specifically, the Mini-Mental State Examination (MMSE) 21 was used to assess global cognition, while the SCD Questionnaire (SCD-Q) was employed for quantitatively assessing the severity of SCD (Supplemental Box 1) and was not used as the diagnostic criteria of SCD. 15 Besides the tests mentioned above, we also used the Clock Drawing Test (CDT) 22 to assess visuospatial function and the Symbol Digit Modalities Test (SDMT) 23 to measure attention function. The mean value of the z-scores of all subtests in each cognitive domain was calculated as the comprehensive score for the cognitive domains. TMT scores were converted into negative z-scores for correlation analysis, with higher scores indicating better executive function.
Olfactory function test
The subjective olfactory dysfunction was evaluated by asking if participants perceived a decrease in olfactory function. The olfactory behavior performance was assessed using the computerized olfactory function assessment instrument (OLFACTTM, Osmic Enterprises, Inc., www.osmicenterprises. com), which includes three aspects: threshold, identification, and memory.
Threshold test: The test used 14 concentration gradients of n-butanol as the stimulus odor, with each gradient halving the concentration of the previous one. Gradient 1 had the highest concentration (4%) and gradient 14 had the lowest concentration. In each trial, participants were presented with two different concentrations of the odor, each lasting 5 s, with a 10-s interval. The control odor for each trial was gradient 14. The test began with gradient 8, and in each trial, participants were required to identify the higher concentration odor. If the answer is correct, the concentration gradient was increased by one level (odor became less concentrated) in the next trial. If the answer is incorrect and the gradient was greater than 8, the concentration gradient was decreased by one level (odor became more concentrated) in the next trial. If the answer was incorrect and the gradient was less than or equal to 8, the concentration gradient was decreased by two levels in the next trial. If participants make correct judgments in two consecutive trials after starting the test, the program records a reversal. If an incorrect judgment is made, two consecutive correct judgments must follow the error for the program to record a reversal. When the instrument recorded three reversals or the concentration gradient was below 2, the test was stopped to avoid prolonged exposure to high concentrations of n-butanol. The final threshold score was the average of the last two reversals. The higher the threshold score, the better the olfactory threshold function. Identification and memory test: This test was divided into two parts. The first part included 10 different odors. The odors were presented to participants in a fixed order. After smelling each odor, participants were required to choose the picture that most closely matches the odor from the four options provided on the computer screen. The second part of the test was conducted 10 min later and included 20 odors, 10 of which were new and 10 were from the first part. Participants must identify each odor and determine whether it was presented in the first part. The total score for the identification test was based on the correct answers out of 20 in the second part, and the score for the olfactory test was based on the correct recall out of 10 in the first part. The specific odors used are shown in Supplemental Table 1.
Image acquisition
The images were acquired on a 3T MRI scanner with a 32-channel phased-array head coil (Philips, Ingenia CX). The resting-state functional MRI (rs-fMRI) was acquired with the following parameters: 35 axial slices, repetition time (TR) = 2 s, echo time (TE) = 30 ms, slice thickness = 4 mm, field of view (FOV) = 192 × 192 mm2, voxel size = 3 × 3 × 4 mm3, and 230 volumes. The participants were required to remain quiet with their eyes closed during rs-fMRI scanning. The acquisition parameters of T1-weighted images (T1WI) were: 196 sagittal slices, TR = 8.10 ms, TE = 3.70 ms, slice thickness = 1 mm, FOV = 256 × 256 mm2, voxel size = 1 × 1 × 1 mm³.
Data preprocessing
The rs-fMRI data were processed using the Data Processing Assistant for Resting-State fMRI, advanced edition (DPARSF). 24 Briefly, all images were corrected for slice timing correction and head motion correction. Participants with head motion exceeding 3 mm or 3° were excluded due to poor image data quality. Nuisance signals, such as Friston 24-head motion parameters, 25 white matter, and cerebrospinal fluid signals were regressed out from each time series. Then all images were spatially normalized into the standard Montreal Neurological Institute (MNI) space, resliced to a voxel size of 3 × 3 × 3 mm3 resolution, and smoothed with a full-width at half-maximum (FWHM) of 6 mm. Finally, a bandpass filter (0.01–0.08 Hz) was conducted to reduce the effect of low-frequency drifts and high-frequency noise. In addition, mean frame-wise displacement (FD, Jenkinson) was extracted as a covariate in subsequent FC comparisons.
Resting-state functional connectivity analysis
The primary olfactory network (priON) and advanced olfactory network (advON) were defined in this study. Specifically, six vulnerable olfactory brain regions associated with the progression of AD were selected based on the current literature, 4 including the orbitofrontal cortex, piriform cortex, entorhinal cortex, hippocampus, insular cortex, and amygdala. The piriform cortex, amygdala, and entorhinal cortex, receiving the projection from the bulb directly, were defined as the priON. 26 The hippocampus, insular cortex, and orbitofrontal are involved in the further processing of olfactory information and were defined as advON.27–29 We defined six regions of interest (ROIs) with a diameter of 6 mm for each olfactory network, based on the coordinates of activated brain regions significantly correlated with olfactory tasks that exhibited high levels in previous literature (Supplemental Table 2).30–32 The coordinates originally defined in Talairach space were converted to MNI standard space. The Data Processing & Analysis for Brain Imaging (DPABI) software package was used to extract the time series of each ROI after preprocessing for each participant, calculate the correlation between the time series of ROIs, i.e., FC, and perform Fisher's Z-transform. The average value of ROI connectivities within and between networks was calculated as well.
Statistical analysis
The statistical analysis was conducted using SPSS 27.0, and p < 0.05 was considered statistically significant. Age, years of education, neuropsychological assessment, and olfactory performance were compared using the one-way ANOVA test while gender distribution and subjective olfactory dysfunction were compared by chi-square test. Post-hoc tests were conducted for the indicators that showed differences among the three groups. One participant in the NC group did not answer whether there was a decrease in subjective olfactory function, so the total number of participants in the evaluation of subjective olfactory decline in the NC group was 79.
The group differences in all FCs within and between networks were compared using a general linear model, with sex, age, years of education, and head motion parameters included as covariates. A post-hoc test was conducted for FCs showing significant differences among groups, with Bonferroni correction applied for multiple comparisons. A total of 69 FCs were included in the analysis. Thus, the corrected significance threshold was set at p = 0.05/69 ≈ 0.0007. When the calculated p-value was <0.0007, the difference was considered statistically significant after Bonferroni correction, reported as: Bonferroni correction, p < 0.05. Partial correlation analysis was used to evaluate the correlations between FCs showing group differences and olfactory function, as well as cognitive function, with sex, age, and years of education included as covariates. Canonical correlation analysis (CCA) was used to examine the association between the two altered FCs and three cognitive domains to create FC scores and cognition scores. Mediation analysis was performed using the PROCESS SPSS macro toolbox to determine if the olfactory identification function affected cognition through FCs. Finally, logistic regression and receiver operating characteristic (ROC) analyses were conducted to evaluate the classification ability of FC parameters with significant differences among groups in differentiating the three groups.
Results
Demographic, neuropsychological, and olfactory function
The demographic, neuropsychological, and olfactory functions of the three groups are listed in Table 1. No significant differences in age, gender distribution, and education years were detected. The MCI group showed lower scores in MMSE, memory, execution, language, attention, and visuospatial function than the other two groups (p < 0.05). The executive function of the SCD group was better than that of the other two groups (p < 0.05). Among the three groups, the SCD participants had the highest SCD-Q scores, followed by the MCI patients, with the NC participants showing significantly lower SCD-Q scores than the other two groups (p < 0.05). Finally, the olfactory identification ability of the MCI group was significantly worse than that of the NC and SCD groups (p < 0.05).
Demographic and clinical data.
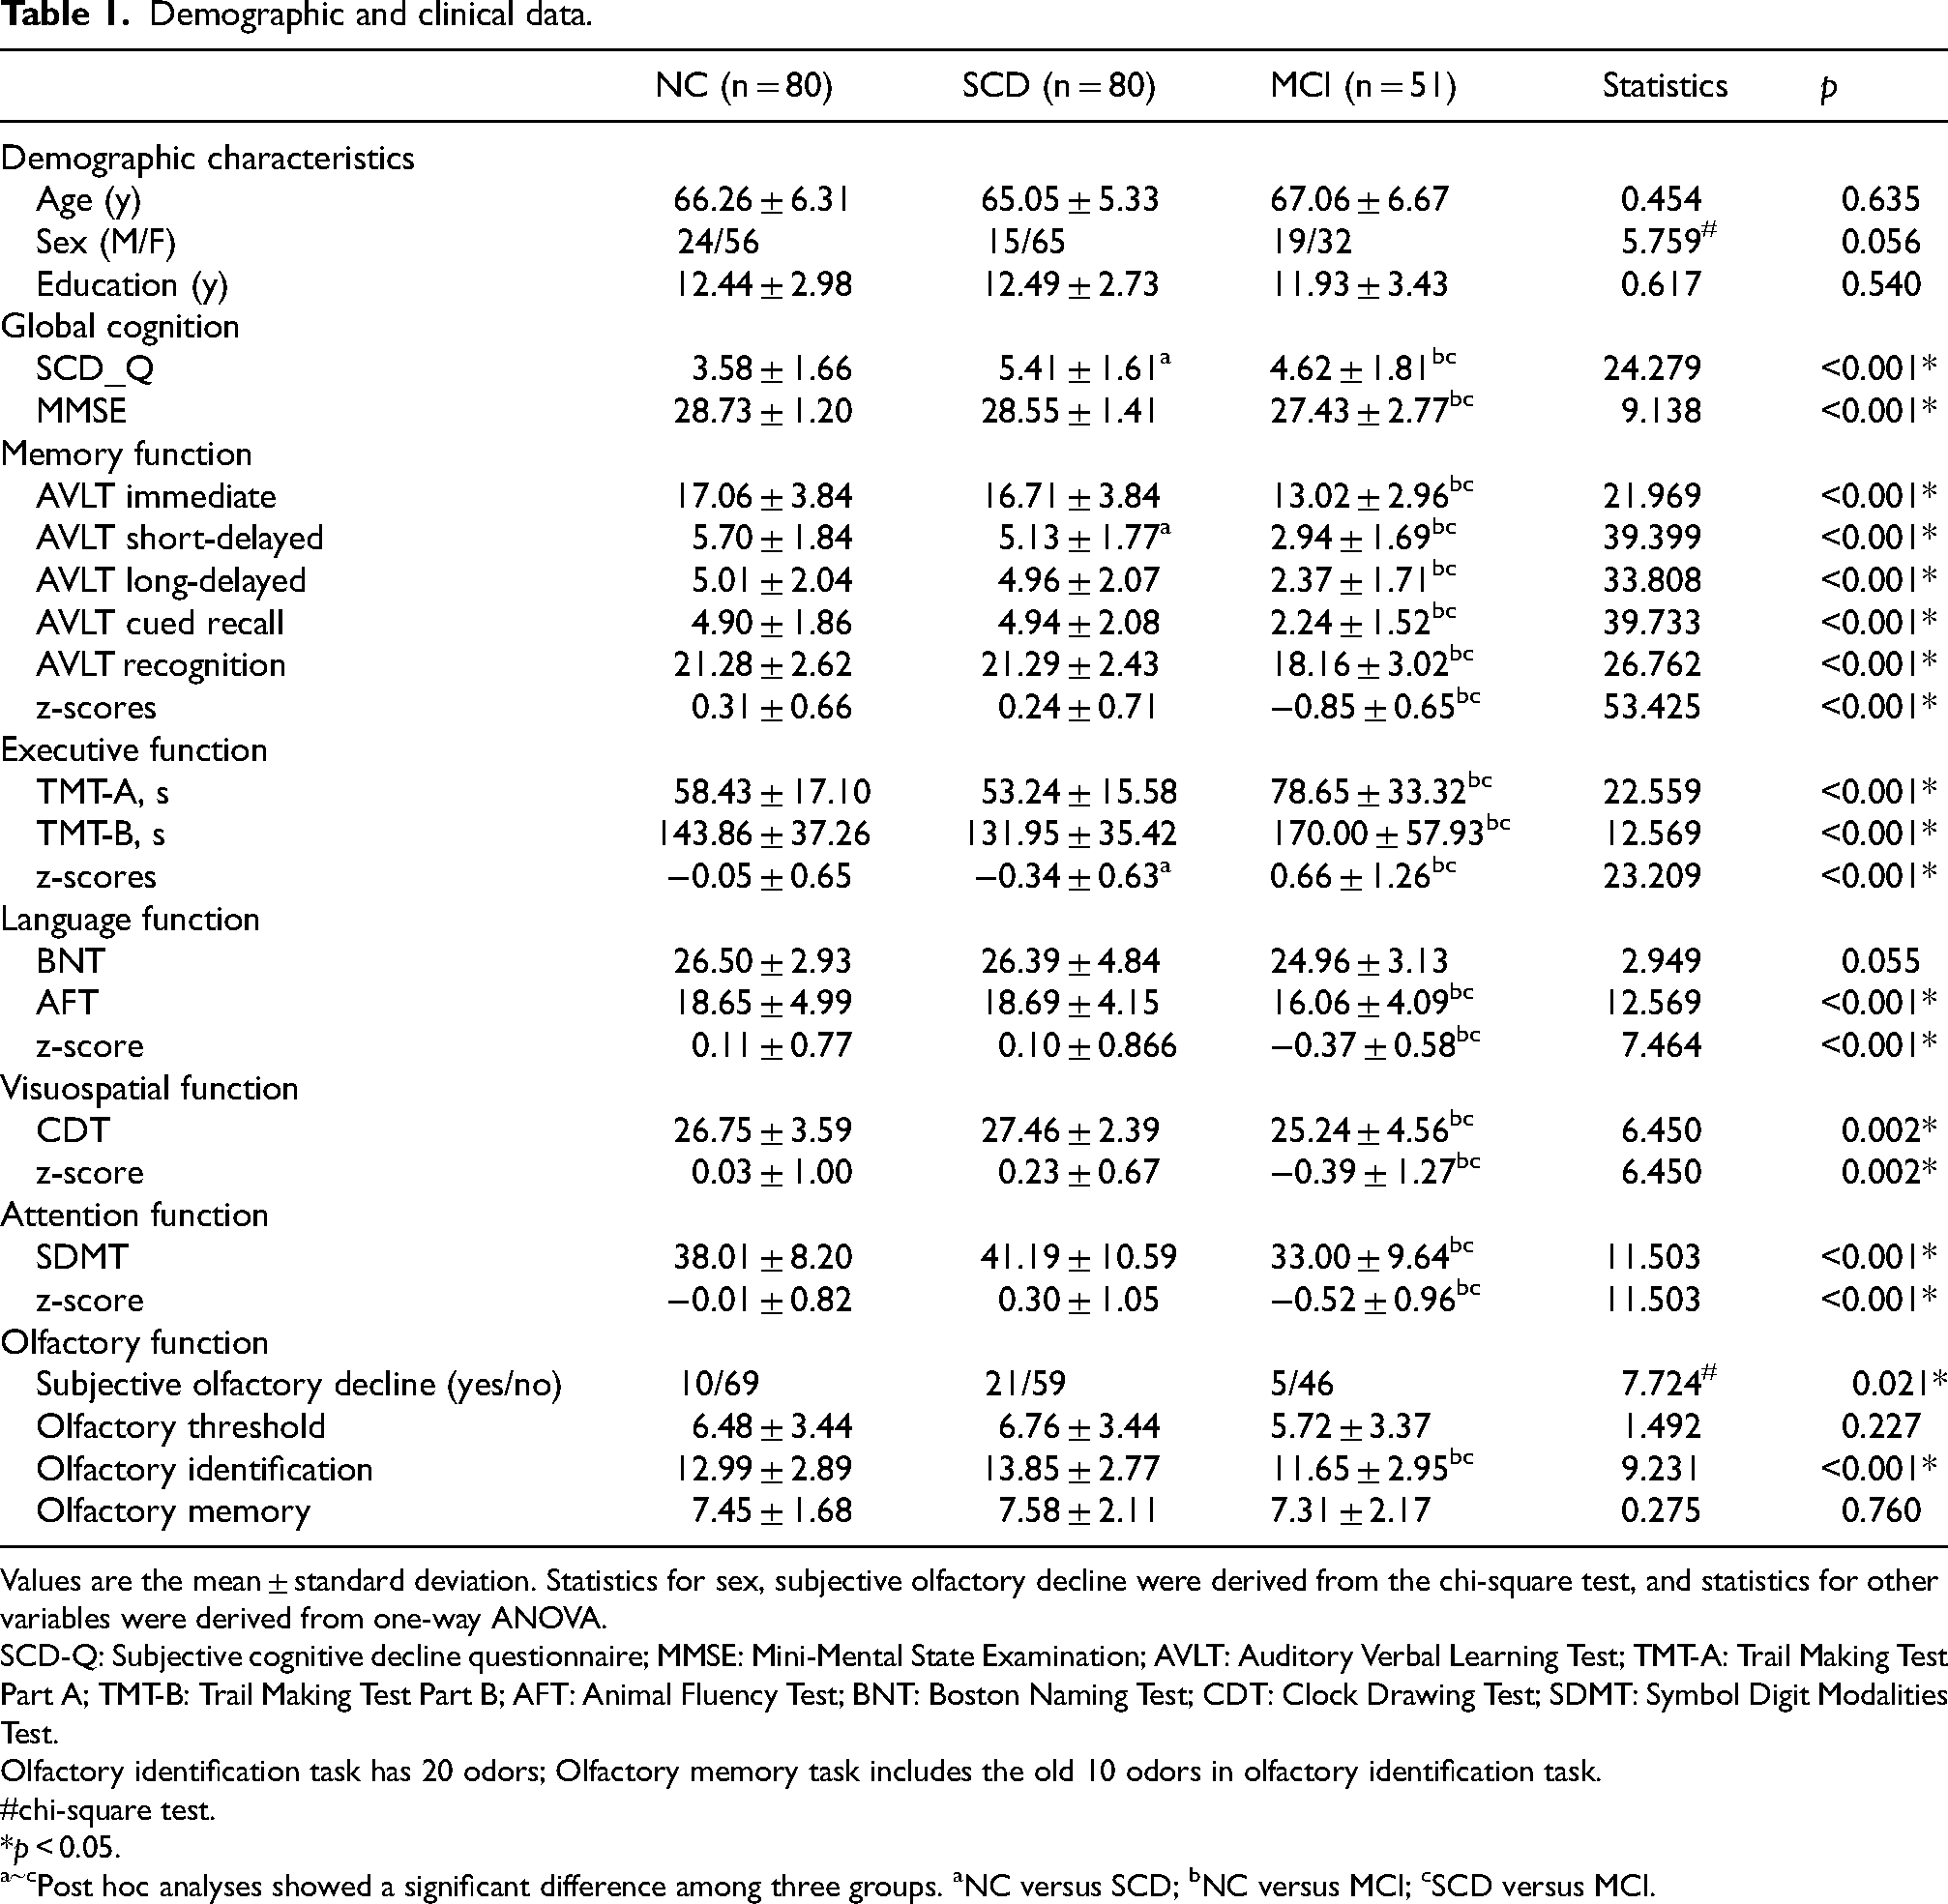
Values are the mean ± standard deviation. Statistics for sex, subjective olfactory decline were derived from the chi-square test, and statistics for other variables were derived from one-way ANOVA.
SCD-Q: Subjective cognitive decline questionnaire; MMSE: Mini-Mental State Examination; AVLT: Auditory Verbal Learning Test; TMT-A: Trail Making Test Part A; TMT-B: Trail Making Test Part B; AFT: Animal Fluency Test; BNT: Boston Naming Test; CDT: Clock Drawing Test; SDMT: Symbol Digit Modalities Test.
Olfactory identification task has 20 odors; Olfactory memory task includes the old 10 odors in olfactory identification task.
chi-square test.
*p < 0.05.
Post hoc analyses showed a significant difference among three groups. aNC versus SCD; bNC versus MCI; cSCD versus MCI.
Functional connectivity
Controlling for sex, age, years of education, and head motion parameters, we compared the FCs within the priON, within the advON, and between the priON and advON across the three groups.
The average FC between the priON and advON differed significantly across the three groups (Bonferroni correction, p < 0.05). Specifically, the MCI group exhibited significantly reduced FC compared to both other groups (Figures 1(d) and 2(a)). Significant inter-group differences were also observed in average FCs within the priON (p = 0.032) and advON (p = 0.002) networks without multiple comparison correction (Figure 1(d)).
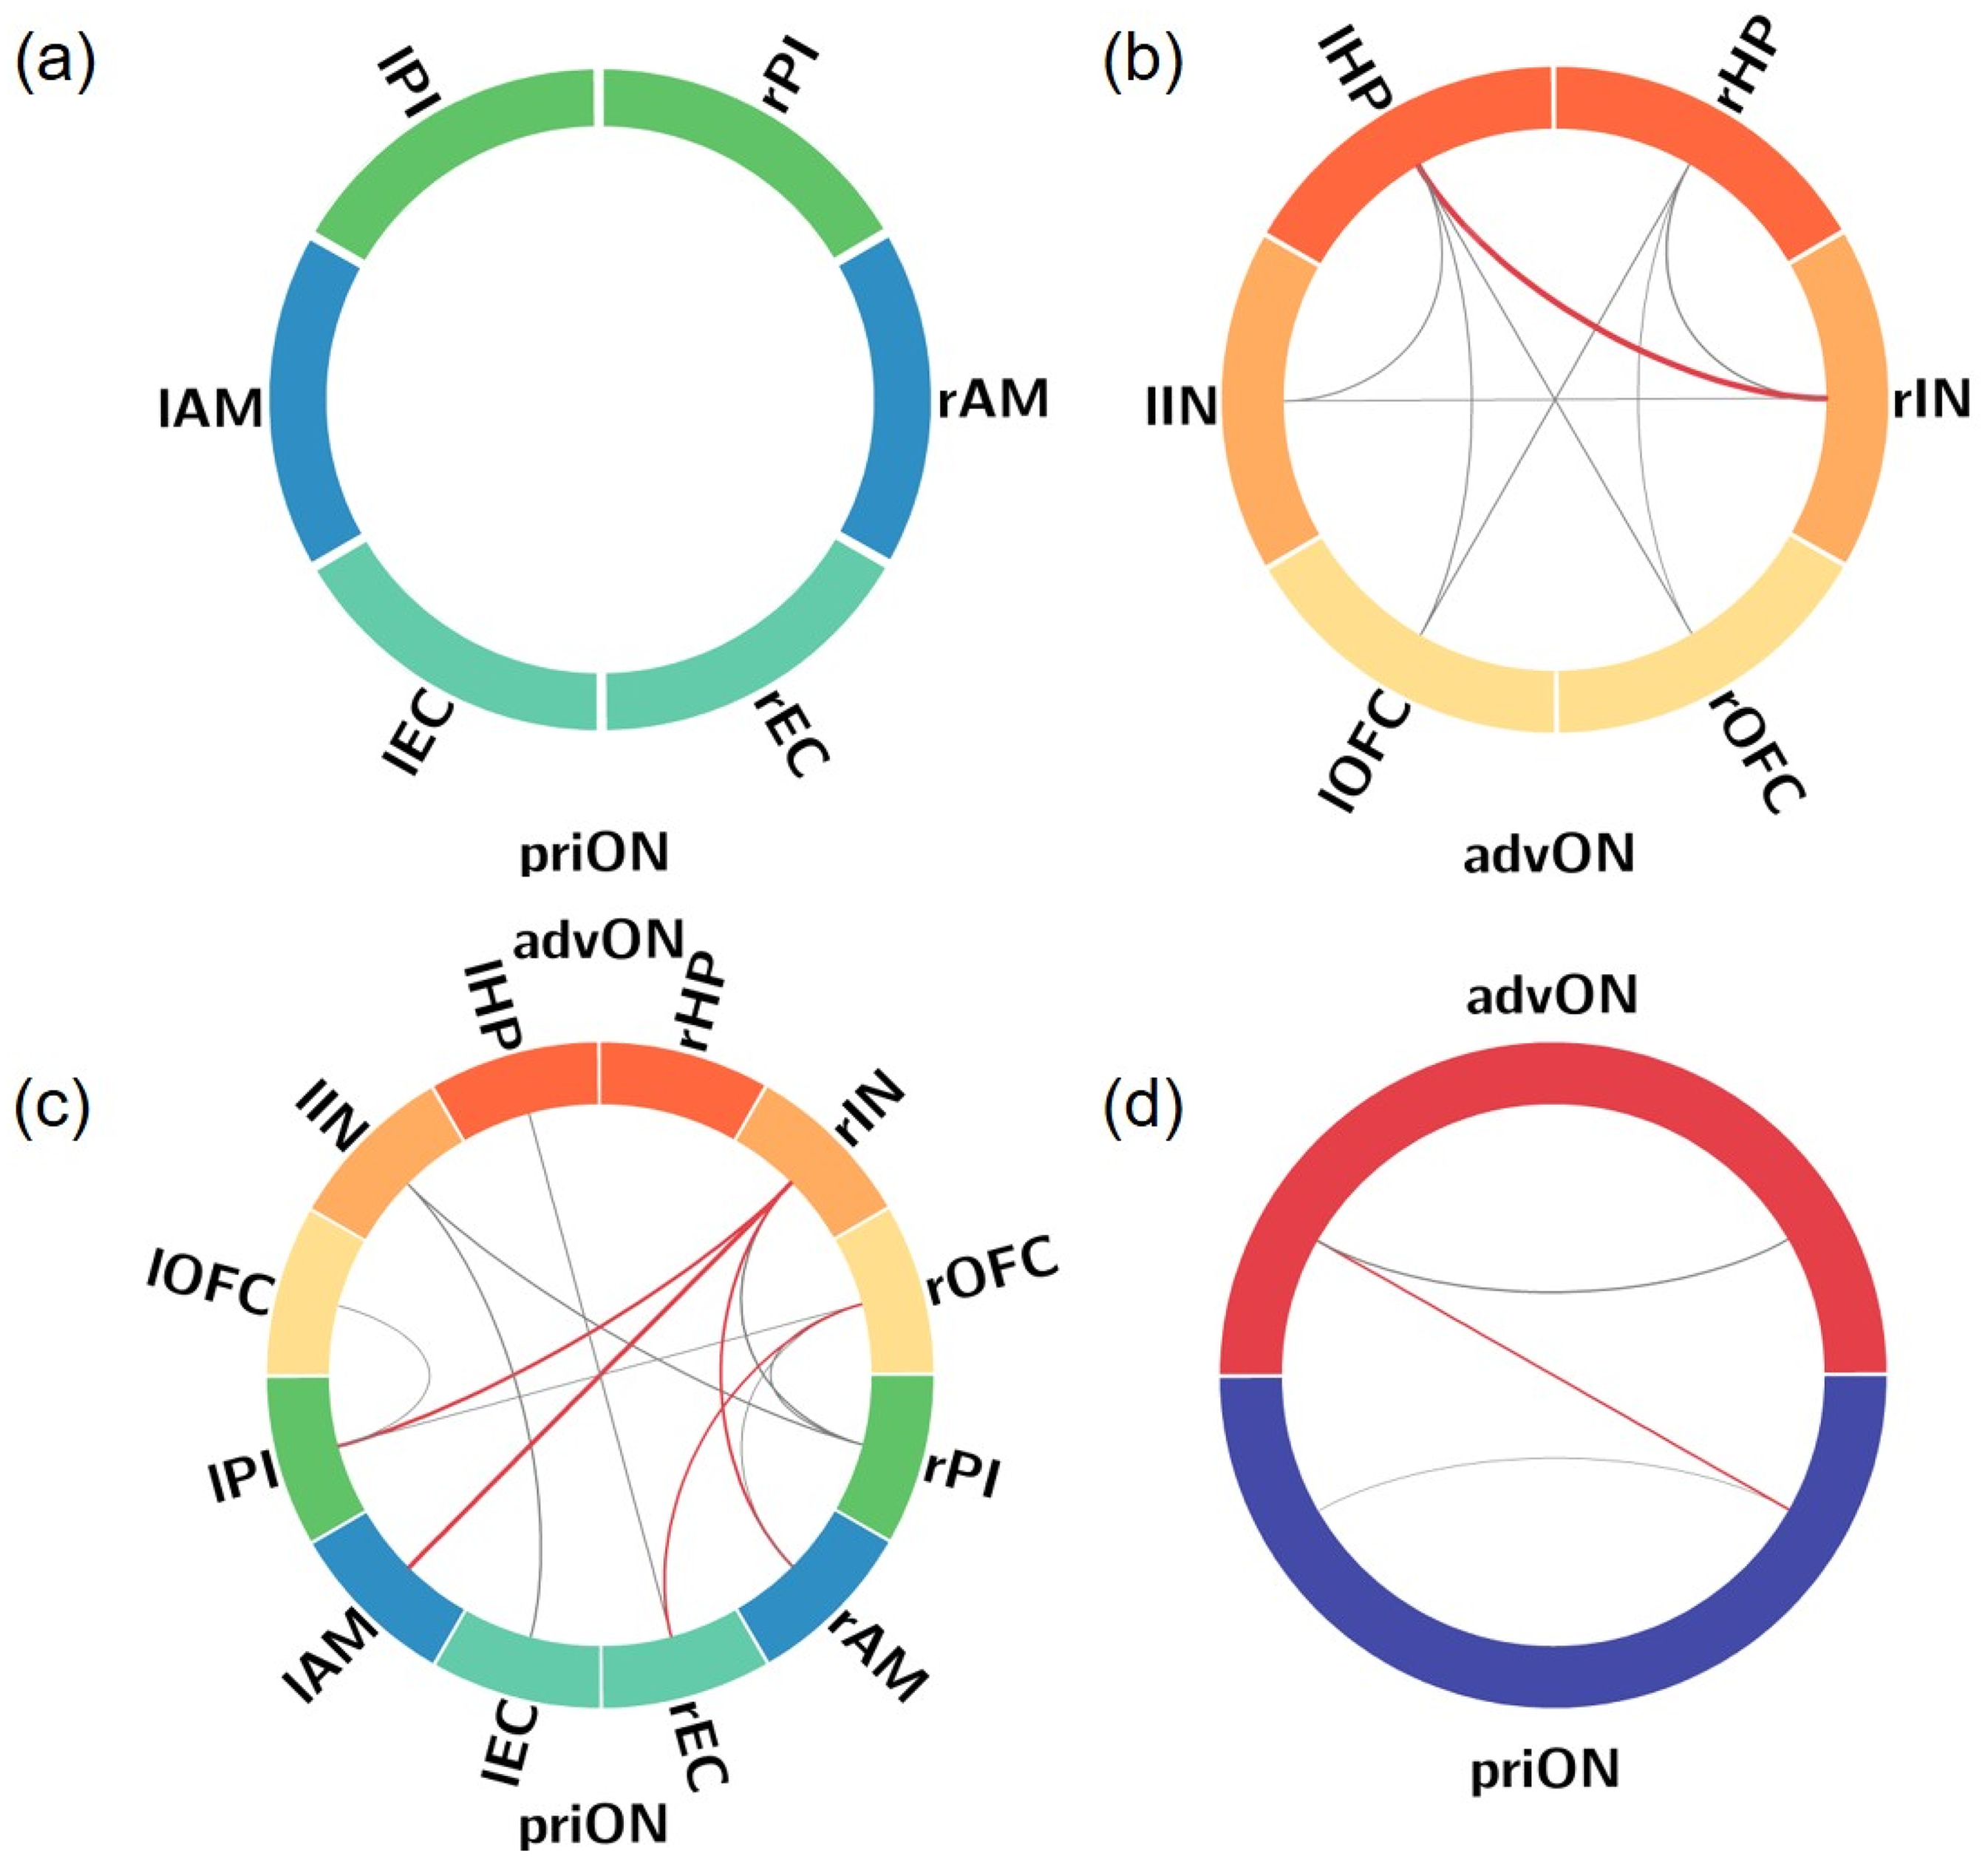
(a) No significant differences in ROI-FC within priON was found among groups. (b) Significant differences in ROI-FC within advON among groups. (c) Significant differences between priON and advON among groups. (d) Significant differences in average network FC among groups. Line thickness represents the size of the statistical value (F value), with red indicating survival after Bonferroni correction. priON: primary olfactory network; advON: advanced olfactory network; AM: amygdala; EC: entorhinal cortex; FC: functional connectivity; ROI: region of interest; HP: hippocampus; IN: insular cortex; OFC: orbitofrontal cortex; PI: piriform cortex; l: left; r: right.
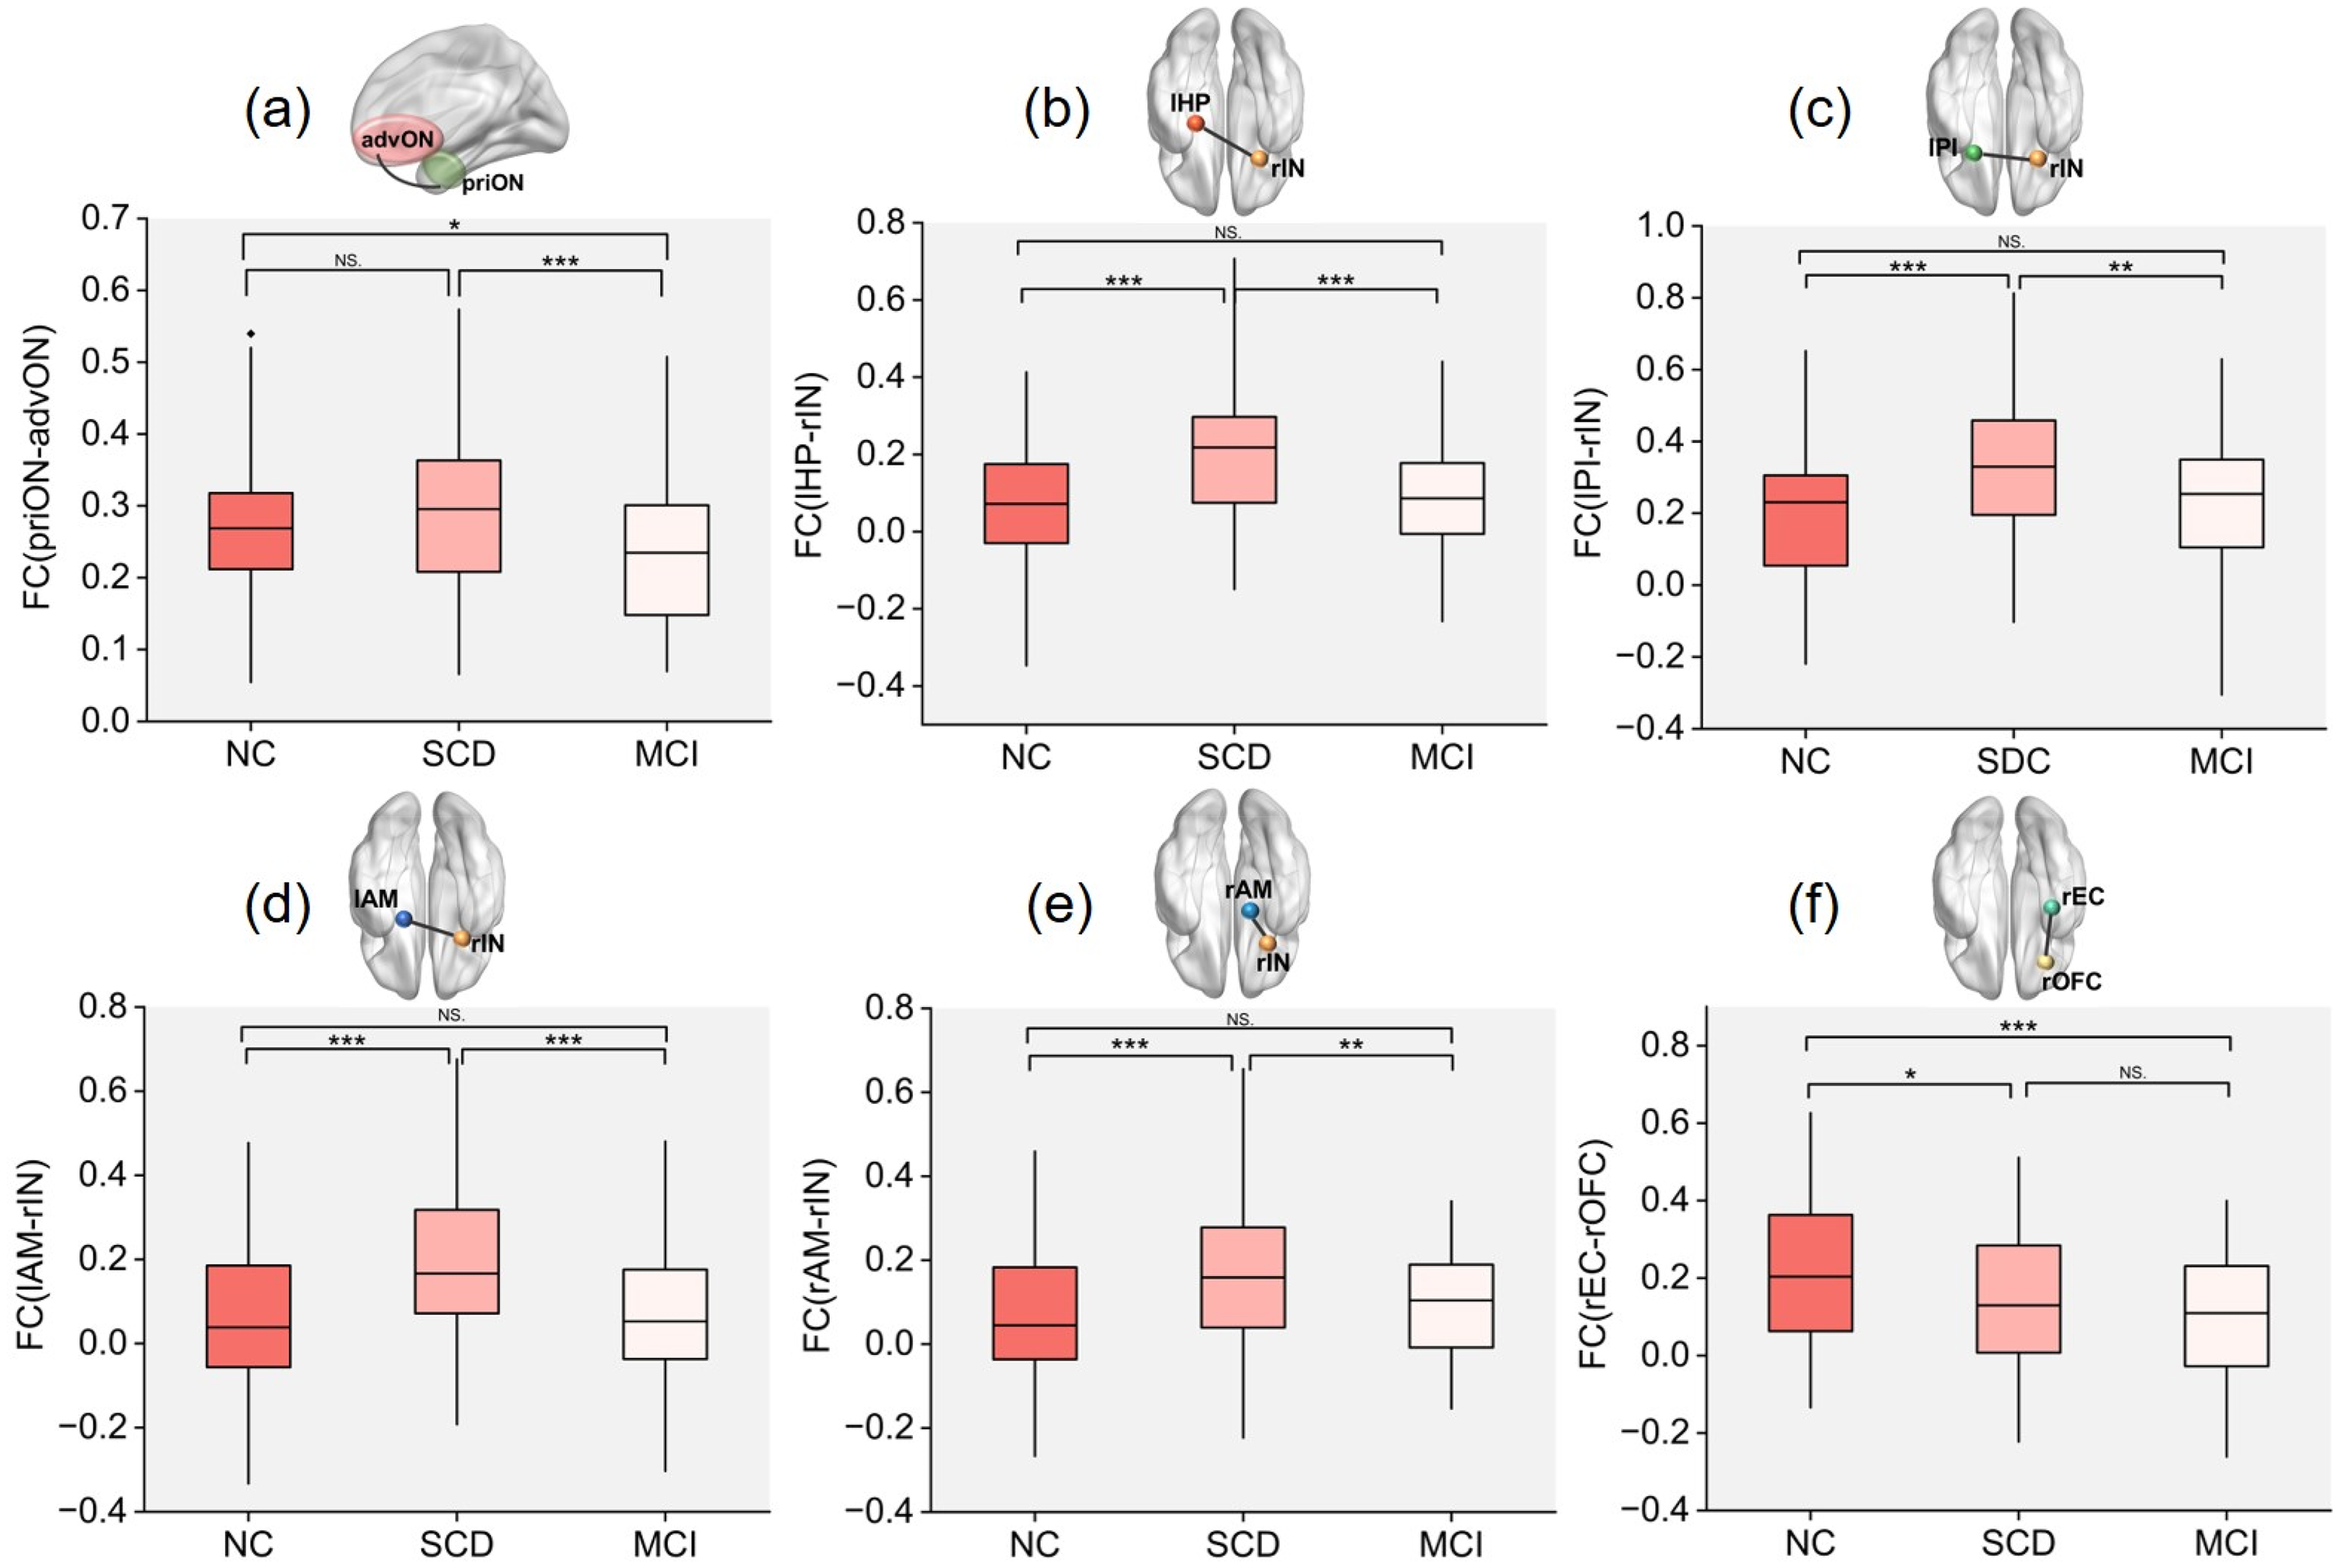
Boxplots showed the group comparisons, with significance thresholds corrected using the Bonferroni method (p < 0.05). priON: primary olfactory network; advON: advanced olfactory network; AM: amygdala; EC: entorhinal cortex; FC: functional connectivity; HP: hippocampus; IN: insular cortex; OFC: orbitofrontal cortex; PI: piriform cortex; l: left; r: right. *p < 0.05, **p < 0.01, ***p < 0.001.
FC differences between regions across groups were further analyzed. A progressive decrease in FC between the right entorhinal cortex and right orbitofrontal cortex (rEC-rOFC) was observed along the NC→SCD→MCI continuum (Bonferroni correction, p < 0.05). Compared to both NC and MCI groups, the SCD group demonstrated significantly enhanced FC in the following connections: lHP-rIN; lPI-rIN; rAM-rIN; lAM-rIN (Bonferroni correction, p < 0.05 for all; Figures 1(b), 1(c), and 2(b)-(f)).
Without multiple comparison correction, the FCs that showed significant differences among three groups (p < 0.05) included: the right piriform cortex and right insular cortex (rPI-rIN), right piriform cortex and left insular cortex (rPI-lIN), right piriform cortex and right orbitofrontal cortex (rPI-rOFC), left entorhinal cortex and left insular cortex (lEC-lIN), left piriform cortex and right orbitofrontal cortex (lPI-rOFC), left piriform cortex and left orbitofrontal cortex (lPI-lOFC),right amygdala and right orbitofrontal cortex (rAM-rOFC), right entorhinal cortex and left hippocampus (rEC-lHP), right hippocampus and right insular cortex (rHP-rIN), right hippocampus and right orbitofrontal cortex (rHP-rOFC), right hippocampus and left orbitofrontal cortex (rHP-lOFC), left hippocampus and left insular cortex (lHP-lIN), left hippocampus and right orbitofrontal cortex (lHP-rOFC), left hippocampus and left orbitofrontal cortex (lHP-lOFC), and right insular cortex and left insular cortex (rIN-lIN) (Figure 1(b) and (c)).
Association between functional connectivity and olfactory function and cognition
Correlations between the significantly different FCs among the three groups (p < 0.05, Bonferroni correction) and olfactory and cognition function were calculated. Partial correlation analysis revealed significant positive correlations between the FCs and olfactory function in the whole cohort (Figure 3). Specifically, olfactory identification scores were significantly positively correlated with the following FCs: lPI-rIN (r = 0.202, p = 0.003), rAM-rIN (r = 0.220, p = 0.001), lAM-rIN (r = 0.217, p = 0.002), lHP-rIN (r = 0.180, p = 0.009), priON-advON (r = 0.187, p = 0.007). We found significant correlations between various cognitive domains and FCs across all participants (Figure 3). Specifically, memory function was significantly positively correlated with the FCs of lAM-rIN (r = 0.219, p = 0.001), lHP-rIN (r = 0.220, p = 0.001), and priON-advON (r = 0.217, p = 0.002). Attention function was significantly positively correlated with the FCs of lHP-rIN (r = 0.137, p = 0.048) and priON-advON (r = 0.170, p = 0.014). Language function was significantly positively correlated with the FCs of priON-advON (r = 0.217, p = 0.002). Visuospatial function was significantly positively correlated with the FC of priON-advON (r = 0.159, p = 0.022). Executive function was significantly positively correlated with the FCs of lHP-rIN (r = 0.187, p = 0.007) and priON-advON (r = 0.174, p = 0.012).
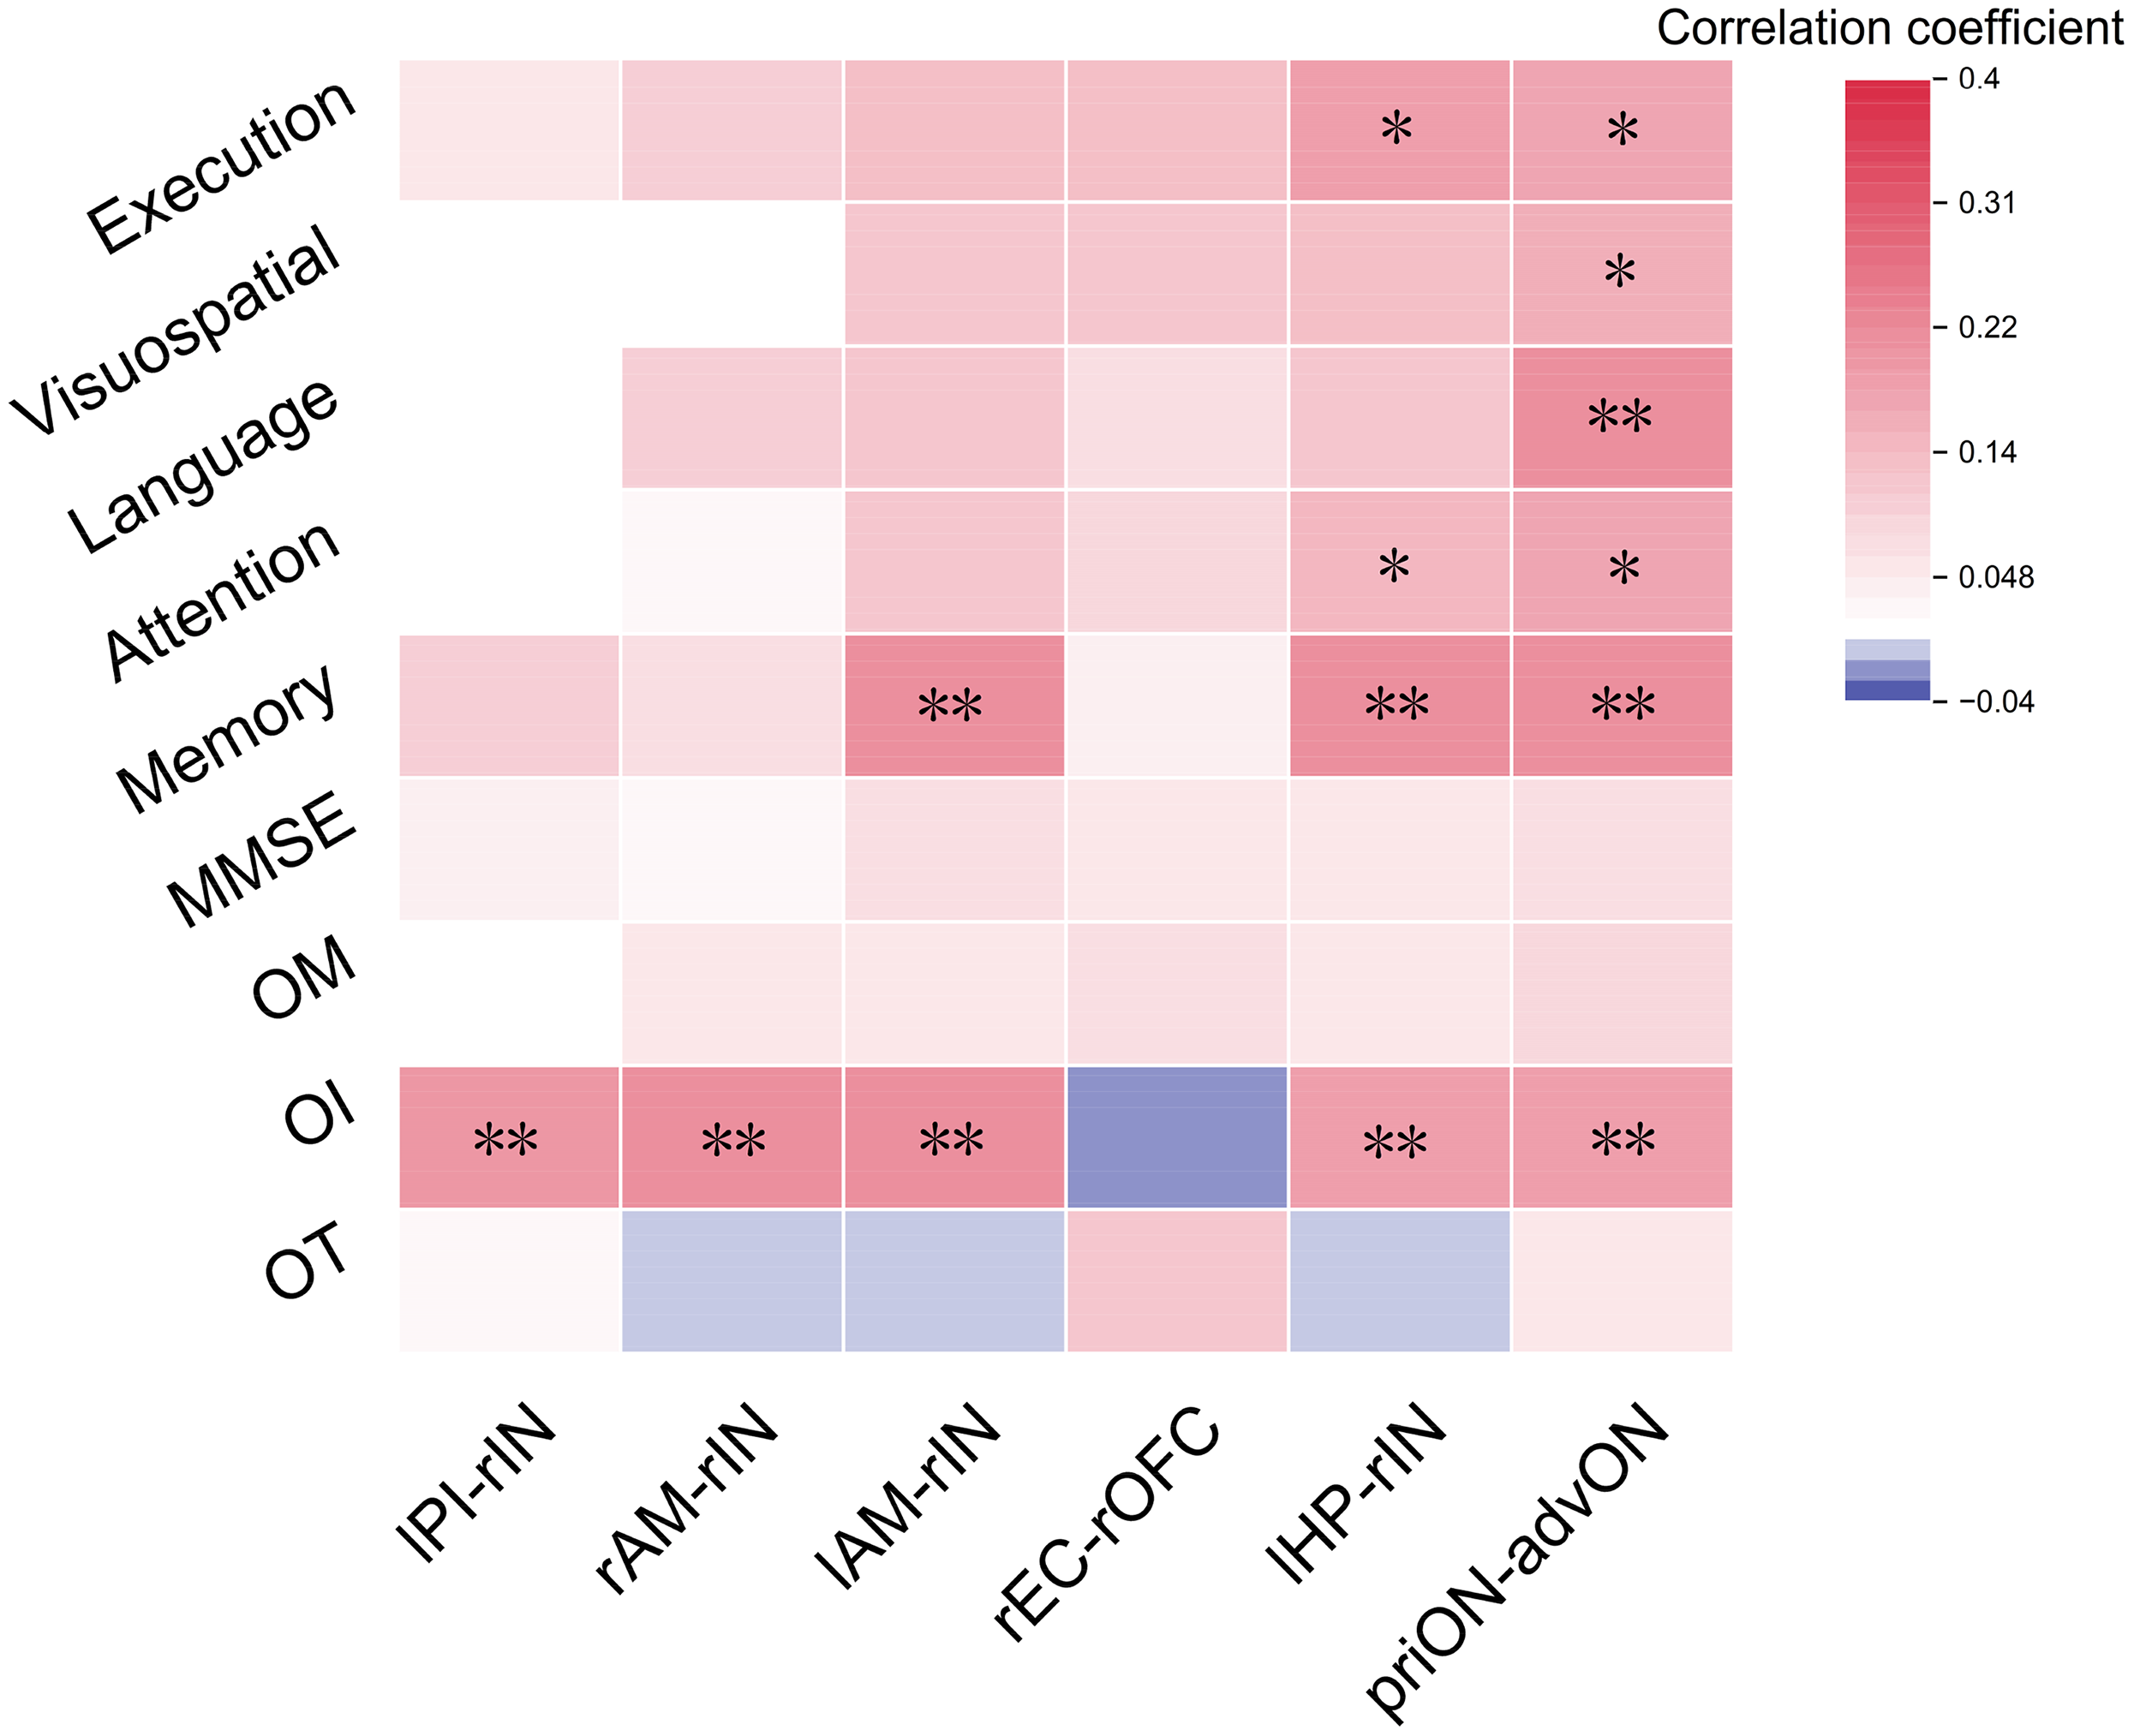
Heatmap of correlations between functional connectivity, olfactory function, and cognitive function in the whole cohort, with age, sex, and education as covariates. AM: amygdala; EC: entorhinal cortex; HP: hippocampus; IN: insular cortex; OFC: orbitofrontal cortex; PI: piriform cortex; priON: primary olfactory network; advON: advanced olfactory network; OT: olfactory threshold; OI: olfactory identification; OM: olfactory memory; l: left; r: right. *p < 0.05, *p < 0.01, ***p < 0.001.
Canonical correlation analysis and mediation analysis
A total of two FCs (lAM-rIN, lHP-rIN) that were significantly correlated with olfactory identification and cognitive function were combined with the three cognitive domains (memory, attention, and executive function) for an integrated analysis in the whole cohort. As shown in Figure 4(a), we found one pair of canonical correlation variables that revealed a clear correlation between FCs (X) and cognition (Y): the canonical correlation coefficient was 0.228 (F = 3.217, p = 0.004). Among the cognitive domains, memory performance was more important (Figure 4(c)). Of the two FCs in the olfactory network, the connection between the lHP and rIN showed greater importance (Figure 4(d)). Then, we calculated FC scores and cognitive scores according to the non-normalized canonical correlation coefficients. Details of the CCA can be seen in the Supplemental Table 3. Furthermore, mediation analysis showed interesting and important results (Figure 4(b)). The relationship between the olfactory identification score and the cognitive score was significantly mediated by the FC score (β = -0.0275, 95% CI: −0.0649, −0.0002).
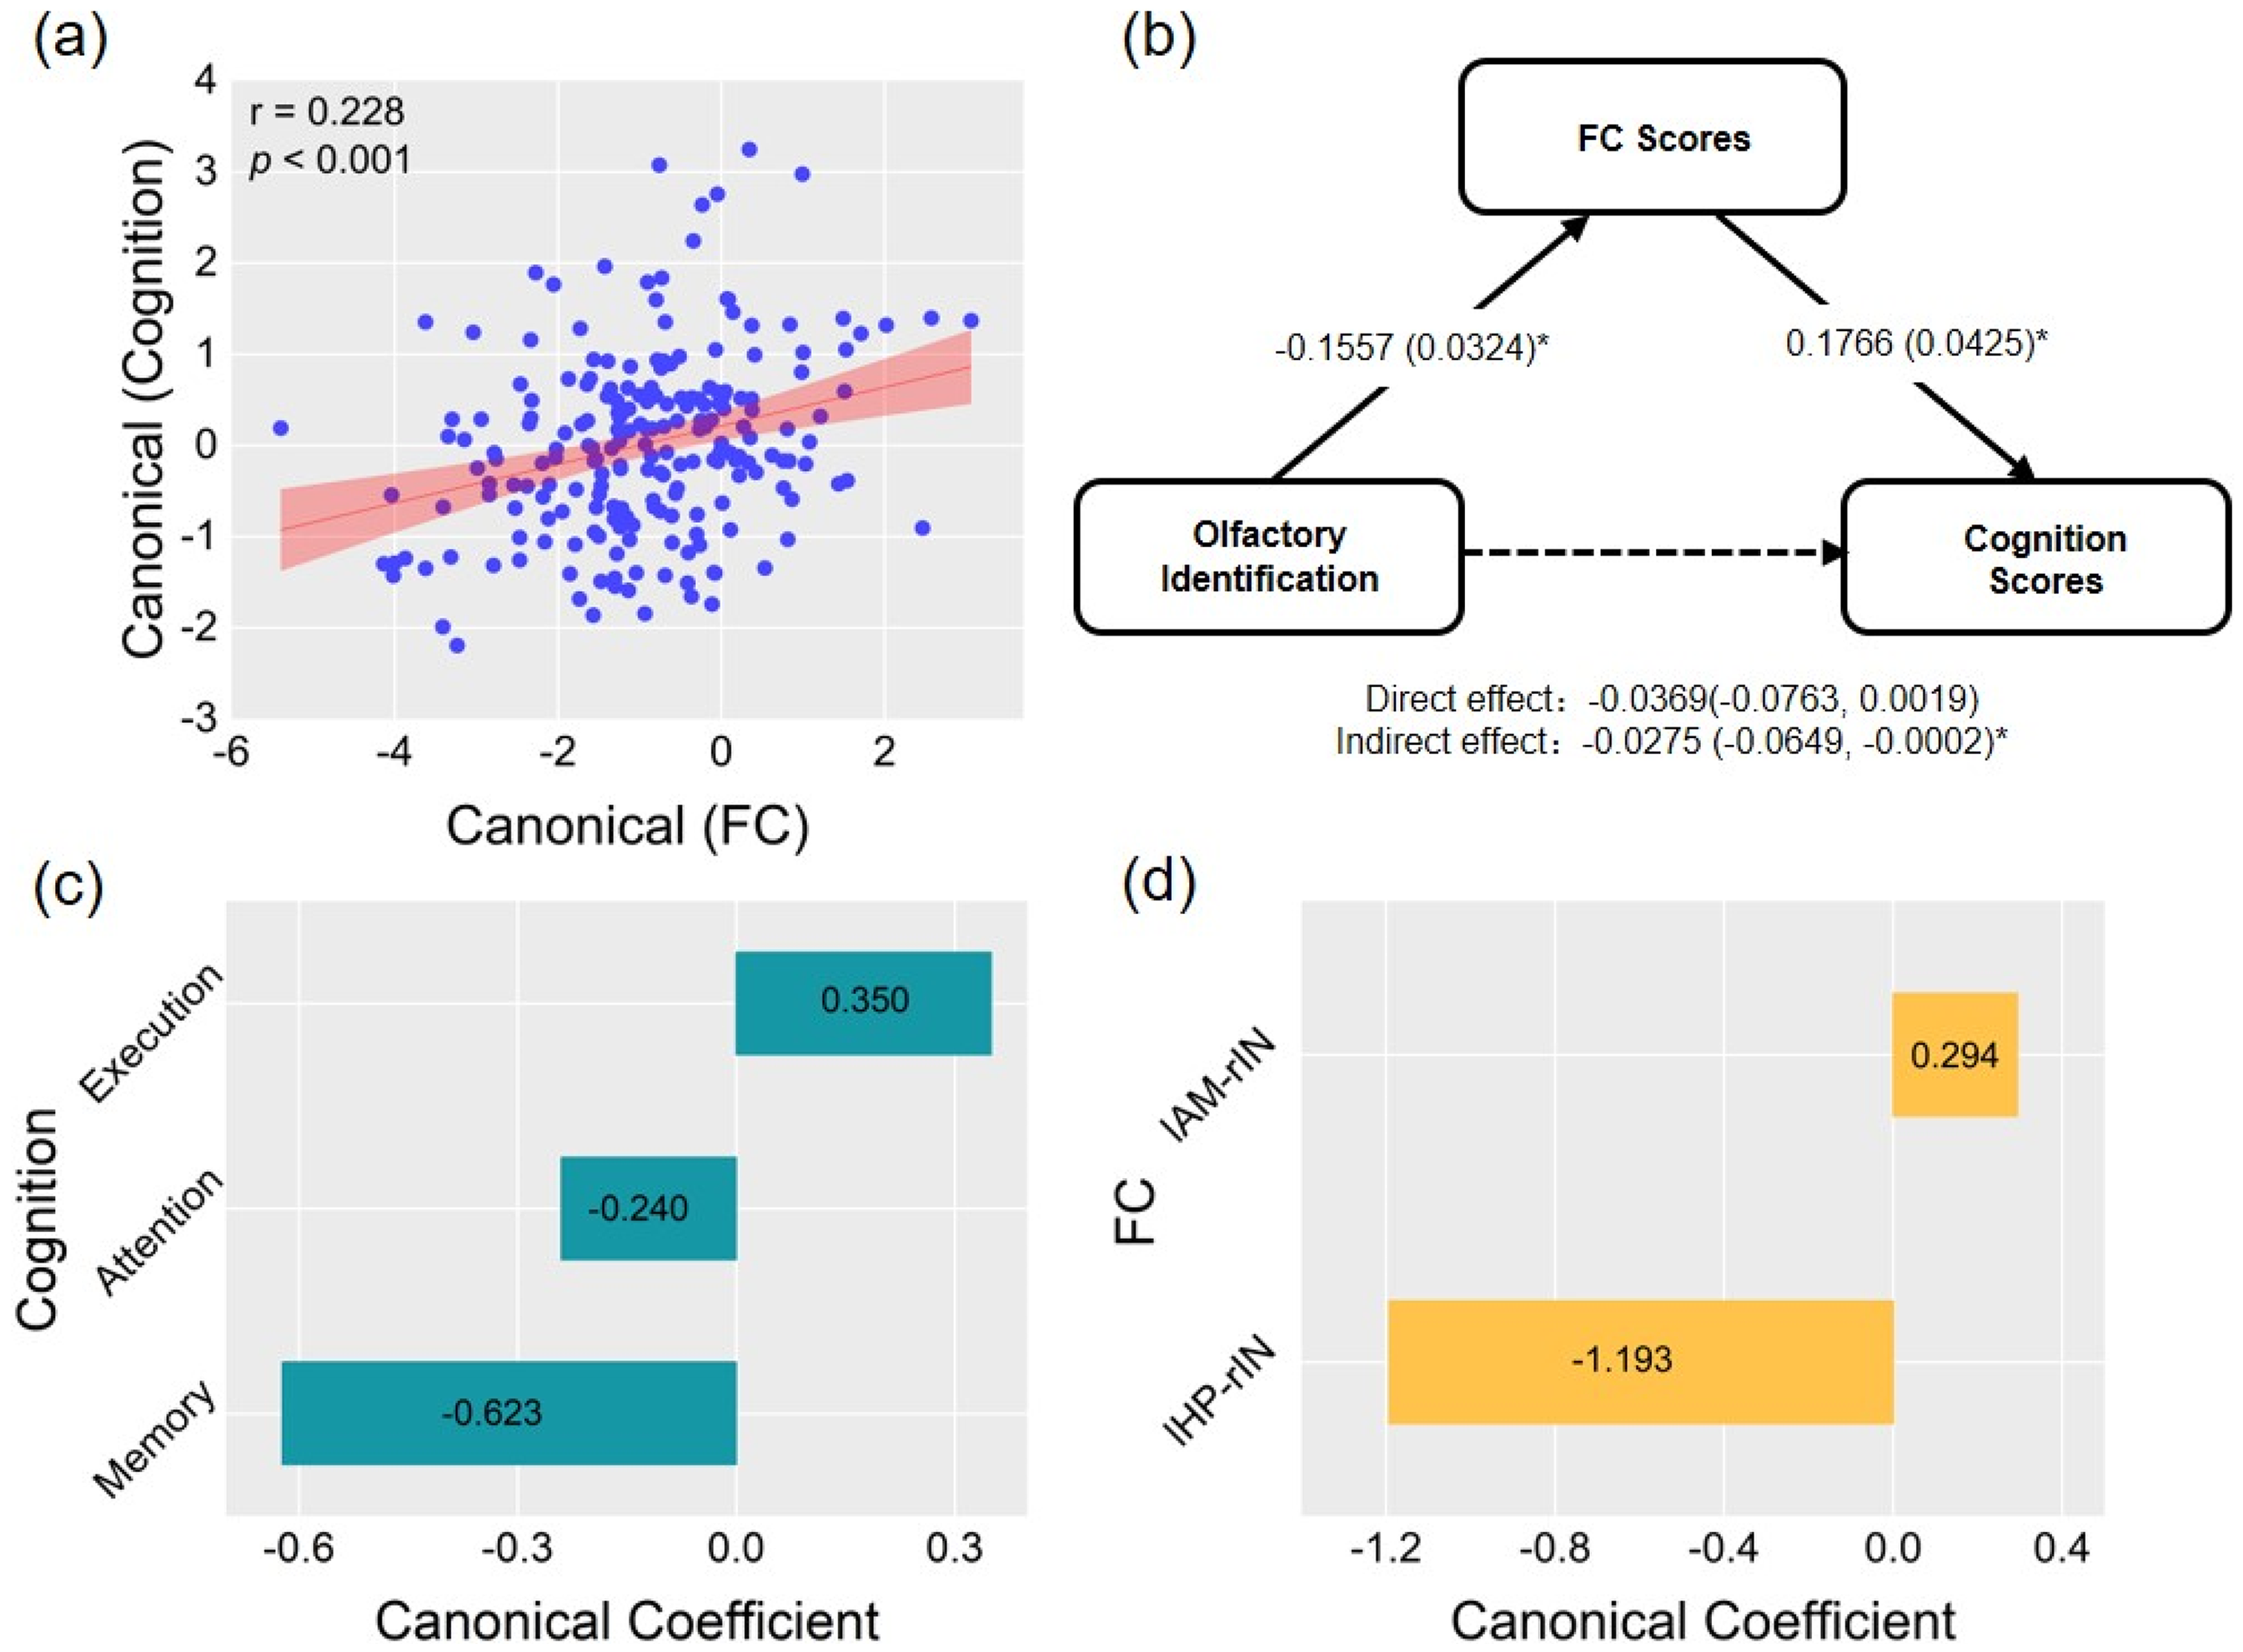
(a) Canonical correlation analysis to determine multivariate associations among two FCs and three cognitive domains. Scatter plot of canonical scores for the significant canonical correlation mode. (b) Mediation analysis of the associations among FC score, cognition score, and olfactory identification in the whole cohort. The standardized β-coefficient was derived from mediation models controlling for age, sex, and education. Values are standardized path coefficients with standard errors or 95% CIs in parentheses. *p < 0.05 was considered significant. (c) Canonical coefficients corresponding to three cognitive domains. (d) Canonical coefficients corresponding to two FCs. FC: functional connectivity; AM: amygdala; HP: hippocampus; IN: insular cortex; OFC: orbitofrontal cortex; PI: piriform cortex; l: left; r: right.
Identification of the three groups based on the FCs and olfactory behavioral performance
The FCs between ROIs showing significant differences among the three groups (p < 0.05, uncorrected) were selected to differentiate the NC and SCD groups, the NC and MCI groups, and the SCD and MCI groups. Because the olfactory identification score was significantly lower in the MCI group compared to the other two groups (p < 0.05), we included the olfactory identification index in the classifications of the NC and MCI groups and the SCD and MCI groups. The ROC curve showed that the area under the curve (AUC) for classifying NC and SCD based on FC was 0.830 (95% CI: 0.769, 0.891) (Figure 5(a)). The AUC value for classifying NC and MCI based on FC was 0.825 (95% CI: 0.752, 0.899); the AUC value for classifying NC and MCI based on olfactory identification score was 0.644 (95% CI: 0.548, 0.741); and the AUC value for classifying NC and MCI based on the combined features of FC and olfactory identification score was 0.851 (95% CI: 0.783, 0.919) (Figure 5(b)). The AUC value for classifying SCD and MCI based on FC was 0.779 (95% CI: 0.699, 0.859); the AUC value for classifying SCD and MCI based on olfactory identification score was 0.707 (95% CI: 0.616, 0.798); and the AUC value for classifying SCD and MCI based on the combined features of FC and olfactory identification score was 0.818 (95% CI: 0.748, 0.888) (Figure 5(c)).
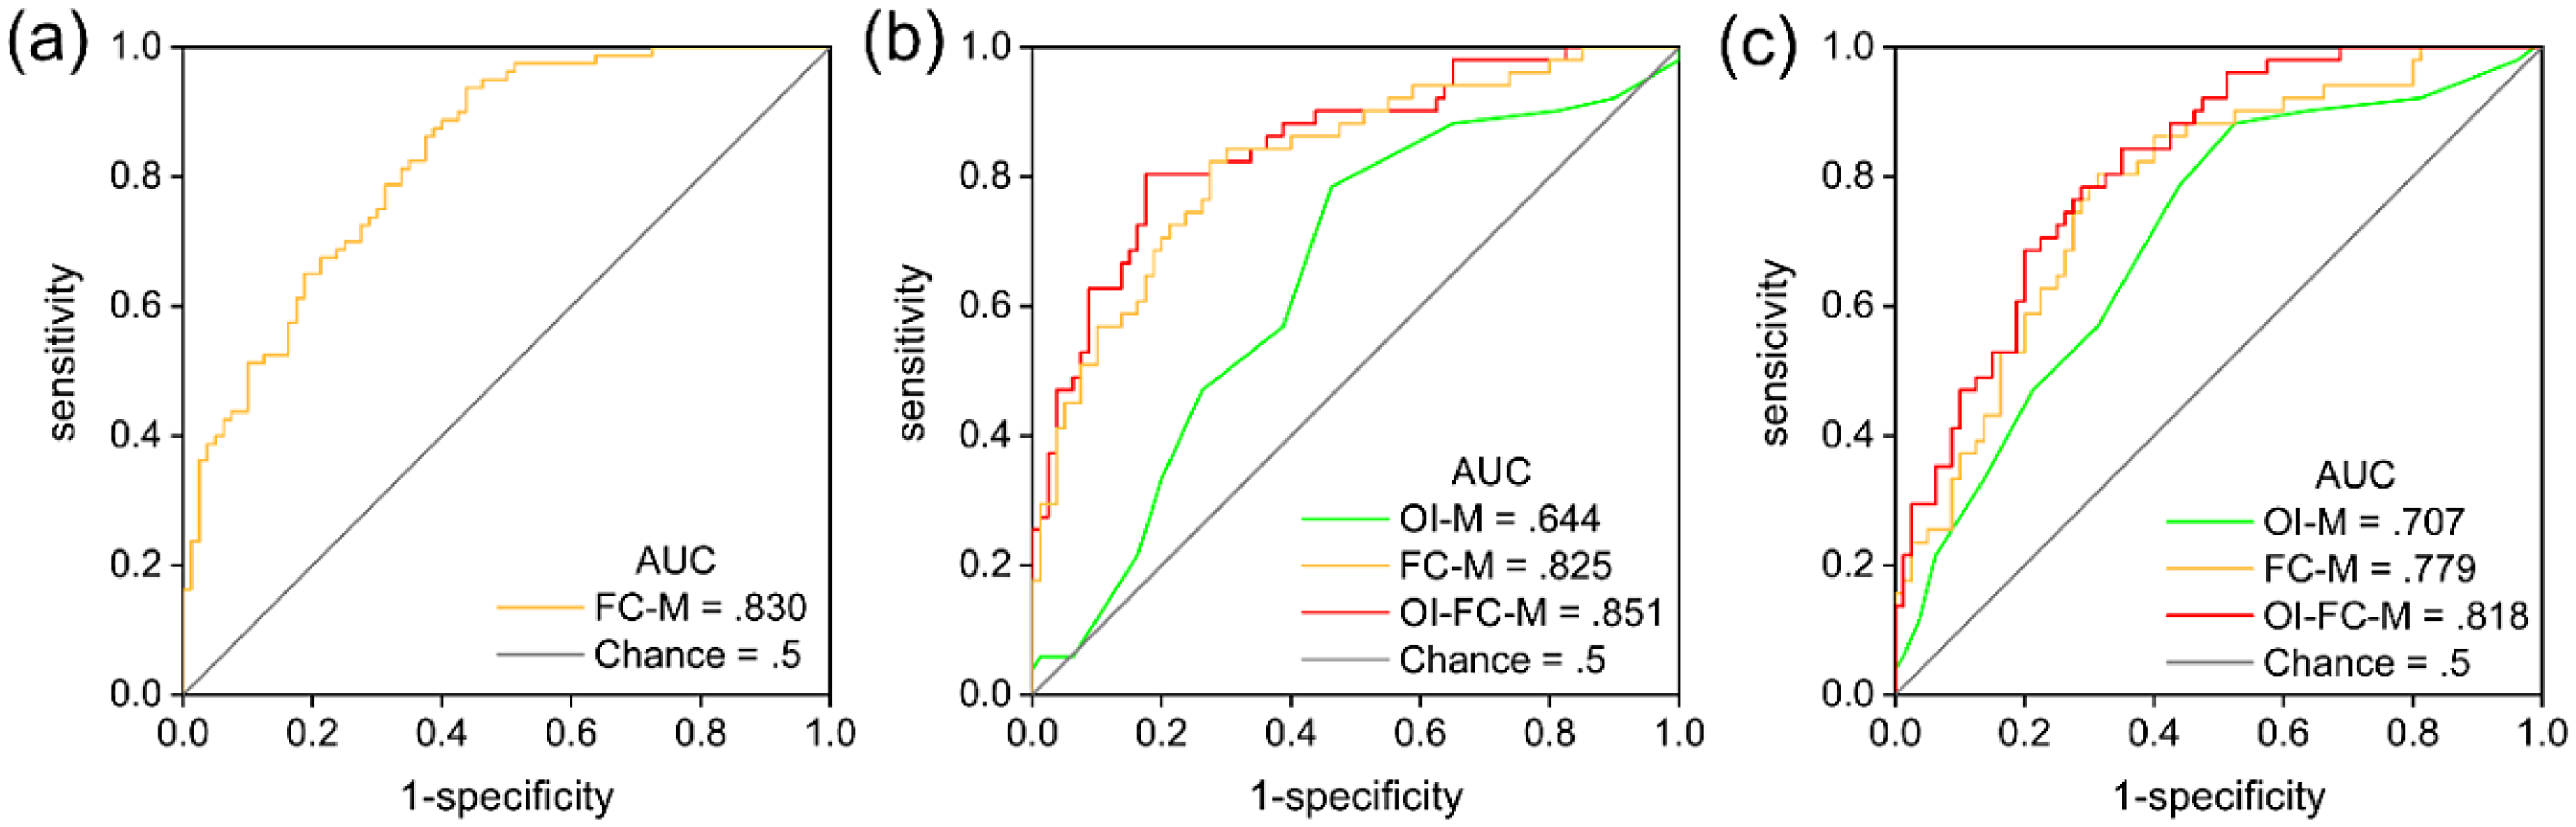
Receiver operating characteristic (ROC) curves for the logistic regression of olfactory identification (OI), functional connectivity (FC), and OI-FC (combining significant OI and FC measures) in differentiating individuals among normal controls, subjective cognitive decline, and mild cognitive impairment. (a) ROC curves for classifying normal controls and individuals with subjective cognitive decline. (b) ROC curves for classifying individuals with normal controls and mild cognitive impairment. (c) ROC curves for classifying individuals with subjective cognitive decline and individuals with mild cognitive impairment.
Discussion
The current study investigated alterations in FC patterns within the olfactory network closely associated with AD, across the continuum from NC to SCD and MCI. The main findings were as follows: (1) Compared to the NC and SCD groups, the MCI patients exhibited a significant decline in average FC between the priON and advON. (2) The FCs between the lHP, lPI, bilateral AM and rIN were significantly enhanced in the SCD group compared to the other two groups. In addition, from NC to SCD to MCI, the FC between the rEC and rOFC gradually decreased. (3) Olfactory function remained stable in individuals with SCD, whereas olfactory identification function was significantly impaired in individuals with MCI. (4) These altered FCs were significantly associated with olfactory identification function and mediated the relationship between olfactory and cognitive functions. (5) The FC characteristics of olfactory networks may serve as potential imaging biomarkers for the early diagnosis of individuals at high risk for preclinical AD.
Compared to the NC and SCD groups, the MCI group showed a significant decrease in the average FC between the priON and advON, indicating a disruption in FC within the olfactory network among MCI individuals. Although the average FC of the olfactory network remained stable in individuals with SCD, region-to-region analysis still revealed signs of compensation and disruption within the network. From NC to SCD to MCI, the FCs between the rEC and the rOFC gradually decreased. The entorhinal cortex, piriform cortex, and amygdala are important components of primary olfactory regions, which directly receive projections from the olfactory bulb, primarily involved in sensing odor intensity and identifying odors, 33 and send projections to the orbitofrontal cortex, hippocampus, insular cortex, and other regions. 34 In the progression of AD pathology, neurofibrillary tangles composed of hyperphosphorylated tau protein first occur in the entorhinal region and then gradually spread to the hippocampus and neocortex. 35 The orbitofrontal cortex, as an advanced olfactory brain region, is involved in odor identification and odor judgment. 36 The reduced FC between the entorhinal cortex and the orbitofrontal cortex may result from the early involvement of the entorhinal cortex in the progression of AD. This reduction likely reflects a decline in the ability of SCD individuals and MCI patients to utilize interactive information processing between these two regions for olfactory processing.
Compared to the NC and MCI group, SCD individuals showed significantly enhanced FC between the lHP, lPI, bilateral AM, and rIN. The hippocampus is involved in encoding olfactory temporal and content information and storing olfactory memories. 37 The piriform cortex is a key brain region for odor quality encoding. 38 The amygdala plays an important role in odor-induced emotional memories, 39 and the insular cortex is also involved in odor-induced emotional responses and olfactory identification.40,41 Therefore, the enhanced FCs among the hippocampus, piriform cortex, amygdala, and insular cortex may represent a compensatory mechanism in SCD individuals, potentially recruiting more olfactory and cognitive information through enhanced connectivity to maintain normal olfactory perception. Our findings are consistent with the hypothesis proposed by Murphy, suggesting that the hyperactivation of connectivity may serve as a compensatory mechanism for olfactory dysfunction during the progression of AD, whereby patients may need to exert greater effort to maintain normal olfactory perception. 42 Future longitudinal follow-up studies should be conducted based on the detection of AD biomarkers to further explore and confirm the patterns of changes in the connectivity of the olfactory network during the progression from SCD to AD.
Furthermore, we found that the significant differences in the FC of the olfactory network between SCD and NC individuals primarily involve the insular cortex. According to the research by Braak et al., 35 during the progression of AD pathology, neurofibrillary tangles affect the insular cortex in stage V. We hypothesize that the enhanced FC involving the insular cortex in SCD individuals may be related to the later involvement of the insular cortex in AD pathology.
The olfactory identification was impaired in patients with MCI in this study, consistent with previous research findings.13,43 Olfactory identification dysfunction is considered one of the earliest impairments in the progression of AD, 42 and is thought to reflect damage to brain regions that receive direct or indirect projections from the olfactory bulb. 44 While a previous study reported a decline in olfactory identification ability among individuals with SCD, 43 no significant olfactory dysfunction was observed in the SCD participants of the present study, which contradicts our initial hypothesis. We speculate that the SCD individuals included in this study may be in the very early stages of the preclinical phase of AD. Their cognitive performance did not show a significant decline, which appears to support this speculation.
Across all participants, we explored the relationship between FCs that showed significant group differences and olfactory performance. Specifically, olfactory identification performance was significantly associated with multiple abnormal FCs (lPI-rIN, rAM-rIN, lAM-rIN, priON-advON). This finding suggests that alterations in specific FCs within the olfactory network may underlie changes in olfactory function during the early stages of cognitive decline. However, we did not observe a significant correlation between the FC of the rEC-rOFC and olfactory function. We speculate that neurodegenerative changes not only lead to functional disconnection between the rEC and rOFC but also disrupt the association between FC and olfactory function. The decoupling of rEC-rOFC connectivity from olfactory function may hold important implications for early intervention in AD, a hypothesis that warrants further validation through longitudinal follow-up studies.
Correlation analysis and canonical correlation analysis revealed that the FCs of olfactory networks were not only related to olfactory function but also significantly correlated with cognitive function. This finding supports the existence of a close neurobiological link between olfaction and cognitive function, suggesting that multiple brain regions involved in olfactory information processing also play roles in cognitive functions such as memory.29,45 Mediation analysis indicated that the FCs mediated the relationship between olfactory identification function and cognitive function, deepening our understanding of the connection between olfaction and cognition. Previous studies have shown that MCI and AD patients exhibit reduced activation in olfactory networks and diminished task-related deactivation in the default mode network during olfactory fMRI. 46 In future research, we will further investigate whether individuals with SCD exhibit stronger FC between olfactory networks and cognitive-related networks, such as the default mode network and salience network, to support our current findings. It has been reported that olfactory training can improve certain cognitive abilities in dementia patients and individuals with poor cognitive function.47,48 Whether the connectivity of the olfactory network is the neural mechanism by which olfactory training enhances cognitive function requires further validation.
ROC curve analysis demonstrated that the FC-based model achieved the highest AUC value for distinguishing between NC and SCD groups, while the odor identification score model demonstrated optimal performance in differentiating SCD from MCI. FC reflects functional interactions between brain regions, whereas odor identification represents the clinical manifestation of integrated neural information processing. As a high-risk preclinical population for AD, individuals with SCD may exhibit neural instability due to compensatory mechanisms, resulting in increased FC variability. This likely contributes to the superior discriminatory efficacy of the FC model in distinguishing NC from SCD. Conversely, significant olfactory dysfunction is already present at the MCI stage, hence the odor identification model holds greater advantage in discriminating between SCD and MCI. These findings suggest that FC metrics may demonstrate higher sensitivity than behavioral measures for early AD diagnosis.
This study has several limitations. First, the single-center, cross-sectional design precludes longitudinal assessment of FC patterns in the olfactory network and their predictive value for SCD progression trajectories. Second, due to experimental constraints and participant willingness, we were unable to collect pathological data including Aβ, tau, and other AD plasma biomarkers, which limits our ability to interpret the association between all findings and AD pathological changes. The latest AD diagnostic and staging guidelines have established the important role of plasma biomarkers such as phosphorylated tau 217 (p-tau217) in AD diagnosis. 49 Therefore, future studies should further investigate the relationship between functional connectivity in olfactory networks and AD plasma biomarkers. This study represents a preliminary exploration of the FC features of the olfactory network in SCD participants. Future research should involve multi-center, large-sample longitudinal studies and collect AD pathological marker data to investigate the spatial and temporal changes in the FC of the olfactory network and AD pathology and their relationship with SCD progression.
The present study revealed compensatory changes in SCD for the disrupted FC of the olfactory network in MCI, specifically increased lHP-rIN, lPI-rIN, lAM-rIN, and rAM-rIN connections, which may reflect potential neural mechanisms underlying olfactory dysfunction in AD. The results further revealed a mediating role of FC in the relationship between olfactory and cognitive functions. Moreover, FC exhibited good classification performance in distinguishing individuals with SCD from those in the NC group. These results may offer preliminary experimental evidence to support that olfactory deficits can be proxy for cognitive decline in AD and used for early diagnosis and preclinical intervention.
Supplemental Material
sj-docx-1-alz-10.1177_13872877251373017 - Supplemental material for Functional connectivity signatures of olfactory networks linked to cognitive risk: A functional MRI study in subjective cognitive decline at risk for Alzheimer's disease
Supplemental material, sj-docx-1-alz-10.1177_13872877251373017 for Functional connectivity signatures of olfactory networks linked to cognitive risk: A functional MRI study in subjective cognitive decline at risk for Alzheimer's disease by Yajing Zhu, Qian Chen, Futao Chen, Jiaming Lu, Cong Long, Danni Ge, Xinru Xu, Yan Lei, Xi Wu, Shunshun Du, Yijun Bai, Dongming Liu, Yingxin Chen, Shenyu Fan, Huiquan Yang, Zhengyang Zhu, Xin Zhang, Qing X Yang and Bing Zhang in Journal of Alzheimer's Disease
Footnotes
Acknowledgements
We would like to thank our reviewers for their thoughtful comments on the manuscript. We are also grateful to all the research participants.
Ethical considerations
All procedures performed in studies involving human participants were in accordance with the ethical standards of the institutional research committee and with the 1964 Declaration of Helsinki and its later amendments or comparable ethical standards.
Consent to participate
Written informed consent was obtained from all participants.
Author contributions
Funding
The authors disclosed receipt of the following financial support for the research, authorship, and/or publication of this article: This work was supported by the National Natural Science Foundation of China (82330059, 82271965); Jiangsu Provincial Health Commission General Science Program (M2024057); General Project Supported by Medical Science and technology development Foundation, Nanjing Department of Health (YKK22083), the National Science and Technology Innovation 2030 – Major program of “Brain Science and Brain-Like Research” (2022ZD0211800); and fundings for Clinical Trials from the Affiliated Drum Tower Hospital, Medical School of Nanjing University (2024-LCYJ-PY-33). The funders had no role in the study design, data collection and analysis, decision to publish, or preparation of the manuscript.
Declaration of conflicting interests
The authors declared no potential conflicts of interest with respect to the research, authorship, and/or publication of this article.
Data availability statement
The data supporting the findings of this study are available on request from the corresponding author. The data are not publicly available due to privacy or ethical restrictions.
Supplemental material
Supplemental material for this article is available online.
References
Supplementary Material
Please find the following supplemental material available below.
For Open Access articles published under a Creative Commons License, all supplemental material carries the same license as the article it is associated with.
For non-Open Access articles published, all supplemental material carries a non-exclusive license, and permission requests for re-use of supplemental material or any part of supplemental material shall be sent directly to the copyright owner as specified in the copyright notice associated with the article.