
Abstract
An altered distribution of membrane gangliosides (GM), including GM1, has recently been reported in the brains of Alzheimer’s disease (AD) patients. Moreover, amyloid-positive synaptosomes obtained from AD brains were found to contain high-density GM1 clusters, suggesting a pathological significance of GM1 increase at presynaptic neuritic terminals in AD. Here, we show that membrane GM1 specifically recruits small soluble oligomers of the 42-residue form of amyloid-β peptide (Aβ42), with intracellular flux of Ca2+ ions in primary rat hippocampal neurons and in human neuroblastoma cells. Specific membrane proteins appear to be involved in the early and transient influx of Ca2+ ions induced by Aβ42 oligomers with high solvent-exposed hydrophobicity (A+), but not in the sustained late influx of the same oligomers and in that induced by Aβ42 oligomers with low solvent-exposed hydrophobicity (A-) in GM1-enriched cells. In addition, A+ oligomers accumulate in proximity of membrane NMDA and AMPA receptors, inducing the early and transient Ca2+ influx, although FRET shows that the interaction is not direct. These results suggest that age-dependent clustering of GM1 within neuronal membranes could induce neurodegeneration in elderly people as a consequence of an increased ability of the lipid bilayers to recruit membrane-permeabilizing oligomers. We also show that both lipid and protein components of the plasma membrane can contribute to neuronal dysfunction, thus expanding the molecular targets for therapeutic intervention in AD.
Keywords
INTRODUCTION
The monosialotetrahexosylganglioside GM1, together with cholesterol and sphingomyelin, is abundant in neuronal membranes (5–10% of the lipid content in the outer membrane leaflet) and accumulates in liquid-ordered microdomains called lipid rafts [1]. Alterations in membrane lipid distribution associated with an age-dependent local increase in ganglioside density and loss of cholesterol have been reported in the brain of Alzheimer’s disease (AD) patients, and high-density GM1 clustering at presynaptic neuritic terminals has been shown to be a critical step in the aggregation process of amyloid-β peptide (Aβ) [2, 3]. In addition, we have recently shown the ability of GM1 to recruit oligomers grown from the 42-residue form of the amyloid-β peptide (Aβ42) to lipid raft domains of the cell membrane [4]. These data add to, and complement, those previously reported showing the key importance of GM1 and its clusters in the neuronal membrane, not only as promoters of Aβ aggregation [5, 6], but also as binding sites of Aβ oligomers [7, 8].
Soluble Aβ oligomers are largely considered as the main toxic species of Aβ and their presence correlates better than plaque load with cognitive impairment and neuronal dysfunction in AD patients [9 –11]. Several investigators have shown that such species can be extracted from affected brain tissue using saline buffers without detergents [12, 13]. Oligomer cytotoxicity appears to result from the aberrant interactions of such species with the lipid bilayers, disrupting cell membranes and impairing their ability to maintain cellular homeostasis [14 –18]. Several studies support the notion that membrane disruption induced by Aβ allows the entry of small molecules and ions, mainly free Ca2+ ions [19 –22]. In particular, it was reported that Aβ can induce a generalized thinning of the phospholipid bilayer, thereby resulting in perturbation of Ca2+ fluxes [23]. The formation of stable pores and ion channels, usually defined “annular protofibrils”, in the cell membrane has also been proposed for amyloid-induced toxicity, in analogy to prokaryotic pore-forming toxins [24 –26], although more recent data have not supported this hypothesis. Finally, a mechanism of Aβ oligomer interaction with cell membranes involving specific binding to endogenous calcium-permeable channels has also been suggested [18]. Overall, although the precise molecular mechanisms of Aβ toxicity remain unclear, dysregulation of Ca2+ homeostasis is widely accepted as a key factor [27 –29].
In the light of the marked toxicity of Aβ oligomers to glutamatergic synapses [9 , 30–32], one particularly attractive candidate mechanism contributing to Ca2+ dysregulation in AD is via N-methyl D-aspartate receptors (NMDA-R) and the relative downstream signaling cascades [13, 33]. Aβ oligomers have been shown to bind to either postsynaptic NMDA-R [34] and α-amino-3-hydroxy-5-methyl-4-isoxazolepropionic acid receptors (AMPA-R) [35], resulting in inhibition of long-term potentiation (LTP) and synaptic activity. Nevertheless, the data showing a physical interaction between Aβ oligomers and glutamatergic receptors is still controversial. In the present study, we investigated the effects of GM1 abundance on the ability of soluble Aβ oligomers to associate with NMDA-R and AMPA-R, thus triggering a calcium influx into neuronal cells. In particular, to mimic the ganglioside density observed in the brains of aged people and of AD patients, the membrane content of GM1 was increased threefold in cells exposed to diffusible Aβ42 oligomers. Our analysis shows that different types of oligomers can induce Ca2+ dyshomeostasis in GM1-abundant cells by both channel-independent and channel-dependent mechanisms, with NMDA-R and AMPA-R triggering a prompt and transient Ca2+ influx.
MATERIALS AND METHODS
Cell culture
Human neuroblastoma SH-SY5Y cells (A.T.C.C. Manassas, VA) were cultured in Dulbecco’s Modified Eagle’s Medium (DMEM), F-12 Ham with 25 mM HEPES and NaHCO3 (1:1) supplemented with 10% fetal bovine serum (FBS), 1.0 mM glutamine and 1.0% penicillin and streptomycin solution. Cells were maintained in a 5.0% CO2 humidified atmosphere at 37°C and grown until 80% confluence for a maximum of 20 passages. SH-SY5Y cells were differentiated for six days with 10 μM all-trans retinoic acid (RA) in their medium supplemented with 1% FBS that was renewed every two days [36]. Cell differentiation was assessed by SDS-PAGE and western blot analysis of the expression level of growth-associated protein GAP43, as previously reported [36]. The enrichment of the GM1 content was obtained by supplementing neuronal cells with 100 μg/ml GM1 from bovine brain (Sigma Aldrich, Saint Louis, MO, USA) for 48 h at 37°C, as previously described [4]. According to previous evidence in AD brains [37], the GM1 content in neuronal membranes was increased by a factor of ca. 3, as assessed by flow cytometric analysis in conjunction with the cholera toxin subunit B (CTX-B) conjugate [4]. Cholesterol was depleted by supplementing the culture medium with β-cyclodextrin (β-CD) at 2.0 mM for 30 min at 37°C in serum-free medium [15].
Primary hippocampal neurons were obtained from embryonic day (ED)-17 Sprague-Dawley rats (Harlan) as described in Bongers et al. [38]. The experimental procedures were in accordance with the standards set forth in the Guide for the Care and Use of Laboratory Animals (published by the National Academy of Science, National Academy Press, Washington, D.C.). Hippocampal neurons were maintained in neuronal basal medium (NBM) at 37°C in a 5.0% CO2-humidified atmosphere and analyzed 14 days after plating, as previously described [39]. GM1 enrichment was obtained by supplementing neurons with GM1 from bovine brain (150 μg/ml) for 24 h at 37°C, as previously described [40].
Preparation of Aβ42 and HypF-N oligomers
The lyophilized Aβ42 peptide (Sigma Aldrich) was dissolved in 100% hexafluoro-2-isopropanol (HFIP) at 1.0 mM. Then, aliquots of peptide solutions were dried under nitrogen and stored at –80°C. A+ and A- oligomers were prepared as described previously [4, 41]. Aβ-derived diffusible ligands (ADDLs) oligomers were prepared according to the Lambert’s protocol [42]. HypF-N protein was purified and converted into toxic (type A) or nontoxic (type B) aggregates as previously described [43]. The oligomeric status of Aβ42 peptide and HypF-N protein was determined by tapping mode AFM, as previously reported [43, 44]. Each type of oligomer was immediately diluted in the appropriate medium at a monomer equivalent concentration of 12 μM and then added to the cell culture media or to calcein-loaded small unilamellar vesicles (SUV). For fluorimetric analysis of oligomer interaction with cells Fluorescein-labeled A+ (A+FAM) oligomers were prepared from Aβ42 amine-reactive succinimidyl esters of carboxyfluorescein (Aβ42FAM, AnaSpec, San Jose, CA, USA).
Dot-blot analysis
Dot-blot analyses of A+ and A- Aβ42 oligomers or HypF-N type A and type B oligomers were performed by spotting 2.0 μl (0.1 mg/ml for Aβ42 and 0.5 mg/ml for HypF-N) of each conformer onto a polyvinylidene fluoride (PVDF) membrane. After overnight blocking (1.0% bovine serum albumin in TBS/TWEEN 0.1%) the blots were probed with 1:1000 rabbit anti-oligomer (A11) polyclonal antibodies (Thermo Fisher Scientific, Waltham, MA, USA) and mouse anti-Aβ42 antibodies 6E10 (Signet, Dedham, MA, USA) or rabbit polyclonal anti-HypF-N antibodies (Primm S.r.l., Milan, Italy), respectively. Then, the blots were incubated with 1:5000 diluted HRP-conjugated anti-rabbit or anti-mouse secondary antibodies. The immunolabeled bands were detected using a SuperSignalWest Dura (Pierce, Rockford, IL, USA).
MTT reduction test
Aggregate cytotoxicity was assessed in SH-SY5Y cells seeded in 96-well plates by the 3-(4,5-dimethylthiazol-2-yl)-2,5-diphenyltetrazolium bromide (MTT) assay, as previously reported [4]. The cells with basal or increased GM1 content (100 μg/ml) were treated for 24 h with Aβ42 oligomers (A+, A- or ADDLs, 12 μM, monomer equivalents), or with HypF-N type A or type B oligomers (12 μM, monomer equivalents). In another set of experiments the cells with basal or depleted cholesterol content (β-CD) were treated for 24 h with Aβ42 oligomers (A+, A- or ADDLs, 12 μM, monomer equivalents). Cell viability was expressed as the percentage of MTT reduction in treated cells as compared to untreated cells.
Preparation of small unilamellar vesicles and permeability measurement
1,2-Dioleoyl-sn-glycero-3-phosphocholine (DOPC) was purchased from Avanti Polar Lipids (Alabaster, AL, USA). DOPC and GM1 were dissolved into chloroform or methanol/chloroform (1:2 v/v), respectively. Then the solutions were mixed by adding to DOPC an increasing content of GM1 (0, 10, 20, or 30%). Then, the organic solvents were dried under a gentle nitrogen stream at room temperature and completely removed from the lipid film by a vacuum pump. The film was hydrated with ultrapure water. For calcein release assay, the dry lipid film resulting from evaporation was resuspended in 60 mM calcein (Sigma), 1.0 M Tris-HCl buffer, pH 7.5, at a 1.0 mg/ml final lipid concentration. The resuspended samples were incubated for 1 h at room temperature to allow lipid hydration and vesicle formation, vortexing occasionally. After 1 h, the lipid suspensions were vigorously vortexed to allow complete detachment of hydrated lipids. The resulting suspension was subjected to five freeze-thaw cycles of 2 min each: freezing in liquid nitrogen followed by 2 min thawing at 37°C. Then, the sample was sonicated for 20 min at 20 kHz in ice to obtain a clear suspension of SUVs. The large lipid aggregates and titanium impurities coming from the sonicator probe were removed by centrifuging the preparation for 10 min at 10,000× g. For calcein release assay, the non-encapsulated fluorescent probe was removed by gel-filtration using a Sephadex G-50 column (1.5×7.5 cm).
Fluorescence anisotropy (r) of 1,6-diphenyl-1,3,5-hexatriene (DPH, Sigma Aldrich) was used to measure the structural order of SUVs, using a Perkin-Elmer LS 55 luminescence spectrometer, as previously reported [44]. SUVs containing DOPC and different GM1 contents were incubated for 30 min with 12 μM (monomer equivalents) Aβ42 oligomers (A+ or A–) and then for 30 min with DPH in a 1:250 probe-to-SUV ratio. DPH fluorescent anisotropy was expressed as the percentage of the value measured in SUVs containing 0% GM1 in the absence of oligomers.
The alteration of SUV permeability was measured by the calcein release assay using the luminescence spectrometer described above. Calcein-loaded SUVs were incubated for 30 min with 12 μM (monomer equivalents) Aβ42 oligomers (A+ or A–).
Measurements of membrane permeability
SH-SY5Y cells with basal or increased GM1 content (100 μg/ml), were cultured on glass coverslips, loaded with 1.0 μM calcein-AM (Thermo Fisher Scientific, Waltham, MA, USA) for 10 min at 37°C and then treated for 60 min with 12 μM (monomer equivalents) Aβ42 oligomers (A+, A–or ADDLs). After fixation in 2.0% buffered paraformaldehyde for 10 min, fluorescence emission was detected after excitation at 488 nm by a TCS SP5 scanning confocal microscopy system equipped with an argon laser source (Leica, Mannheim, Germany), as previously described [4]. A series of 1.0 μm thick optical sections (1024×1024 pixels) was taken through the cell depth for each sample using a Leica Plan Apo 63× oil immersion objective and projected as a single composite image by superimposition (Leica).
Oligomer interaction with human neuroblastoma cells
SH-SY5Y cells with increased GM1 content (100 μg/ml), were incubated 3 h on ice with A+FAM oligomers (1.0 μM, monomer equivalent) in the absence or in the presence of 10×molar equivalents of unlabeled A+ or A–oligomers of Aβ42, or type A oligomers of HypF-N. Then, the solutions were removed and the cells washed twice with cold PBS and subsequently lysed in RIPA buffer [50 mM Tris–HCl (pH 7.5)/150 mM NaCl/0.1% (w/v) SDS/1% (v/v) Triton X-100/0.5% (w/v) sodium deoxycholate] in the presence of a protease inhibitor cocktail (Sigma Aldrich) and subjected to two cycles of freeze/thawing (–80°C/37°C). The cell lysate fluorescence was measured at Exc/Em 492/518 nm using the luminescence spectrometer described above. Fluorescence intensity values were normalized to total protein content in the samples, as measured by the Bradford method [45]. The interaction of A+FAM oligomers with cells, following 3 h on ice, was also monitored by confocal microscopy by counterstaining the cell membrane with 5.0 μg/ml Alexa Fluor 633-conjugated wheat germ agglutinin. Fluorescence emission was detected after double excitation at 488 nm and 633 nm by confocal microscopy described above.
Cytosolic free Ca2+ levels
SH-SY5Y cells with basal or increased GM1 content (100 μg/ml) were treated for 60 min with 12 μM (monomer equivalents) Aβ42 oligomers (A+, A–or ADDLs) or with 12 μM (monomer equivalents) HypF-N oligomers (type A or type B). In a set of competition experiments, the cells with basal GM1 content were pre-treated for 60 min with A–or with type B oligomers (12 μM, monomer equivalents) or for 20 min with the cholera toxin subunit B (CTX-B) and after washing twice treated for 60 min with A+ oligomers (12 μM, monomer equivalents). In a separate set of experiments, the cells with increased GM1 content (100 μg/ml) were pre-treated for 10 min on ice with 0.05% trypsin and after washing twice treated for 10 or 60 min at 37°C with A+ or A–oligomers (12 μM, monomer equivalents). In another set of experiments the cells with increased GM1 content (100 μg/ml) were pre-treated for 60 min with 5.0 μM CNQX, a competitive antagonist of AMPA-R or with 10 μM memantine (mem), a low-affinity antagonist of NMDA-R or with 10 μM cadmium ions (Cd2+), a competitive blocker of voltage-dependent calcium channels (VDCCs) (Sigma Aldrich) or with 1:200 diluted rabbit polyclonal anti-AMPA (Merk Millipore, Darmstadt, Germany) or with 1:200 diluted rabbit polyclonal anti-NMDA (Thermo Fisher Scientific, Waltham, MA, USA) antibodies, as previously reported [33 , 47]. Then, the cells were treated for 10 min with 12 μM (monomer equivalents) Aβ42 oligomers (A+ or A–) or with HypF-N oligomers (type A or type B). The cells with increased GM1 content (100 μg/ml) were also pre-treated for 60 min with 5.0 μM CNQX or with 10 μM mem, and then treated for different lengths of time (0, 5, 10, 12, 15, 30, 60, or 180 min) with HypF-N oligomers (type A or type B, 12 μM, monomer equivalents).
Primary rat hippocampal neurons with increased GM1 content (150 μg/ml) were treated for 60 min with 12 μM (monomer equivalents) Aβ42 oligomers (A+ or A–) in the absence or in the presence of pre-treatment for 20 min with CTX-B, as previously reported [40].
The cytosolic Ca2+ was measured by confocal microscopy in SH-SY5Y cells and in primary neurons loaded with 4.0 μM Fluo3-AM (Thermo Fisher Scientific), as previously described [4]. Fluorescence emission was detected after excitation at 488 nm by confocal microscopy described above. 10–22 cells, in three different experiments, were analyzed using ImageJ software [48]. The fluorescence intensities were expressed as the percentage of that measured in 1.0 μM ionomycin-treated cells [49].
Oligomer co-localization with calcium channels
Human neuroblastoma SH-SY5Y cells with basal or increased GM1 content (100 μg/ml) and primary rat hippocampal neurons with basal GM1 content seeded on glass coverslips were treated for 20 min with Aβ42 oligomers (A+ or A–,12 μM, monomer equivalents). After fixation in 2.0% buffered paraformaldehyde for 10 min, oligomers co-localization with AMPA-R and NMDA-R was monitored by immunostaining. This was done by incubating the samples first with 1:800 diluted rabbit polyclonal anti-AMPA (Merk Millipore, Darmstadt, Germany), or anti-NMDA, antibodies (Thermo Fisher Scientific) and 1:800 diluted mouse monoclonal anti-Aβ42 antibodies (Signet, Dedham, MA, USA) for 60 min at 37°C, and then with 1:1000 diluted Alexa Fluor 594- and 488- conjugated anti-rabbit or anti-mouse secondary antibodies (Thermo Fisher Scientific) for 90 min at 37°C. Fluorescence emission was detected after double excitation at 594 and 488 nm by confocal microscopy as described above. Oligomers co-localization with AMPA-R or NMDA-R was estimated for regions of interest in 10–22 cells using the ImageJ (NIH, Bethesda, MD, USA) and JACOP plugin (http://rsb.info.nih.gov) softwares [48].
FRET analysis
The molecular interaction of A+ or A–oligomers (12 μM, monomer equivalents) with AMPA-R or NMDA-R was also analyzed in human neuroblastoma SH-SY5Y seeded on glass coverslips by Fluorescence Resonance Energy Transfer (FRET) analysis. The cells were exposed to the oligomers for 20 min and then fixed in 2.0% buffered paraformaldehyde for 10 min at room temperature. After washing, the cells were counterstained with 1:800 diluted rabbit polyclonal anti-AMPA-R or with 1:800 diluted rabbit polyclonal anti-NMDA-R antibodies and with 1:800 diluted mouse monoclonal anti-Aβ42 antibodies (Signet, Dedham, MA, USA) for 60 min at 37°C. Then, the samples were incubated with 1:1000 diluted Alexa-Fluor-546-conjugated anti-rabbit and Alexa-Fluor-488-conjugated anti-mouse secondary antibodies, respectively (Thermo Fisher Scientific), for 90 min at 37°C. An acceptor bleaching protocol was used to measure FRET efficiency, as previously described [50]. Acceptor bleaching was accomplished using the TCS SP5 confocal system described above using the implemented FRET acceptor photobleaching wizard. Pre-bleach and post-bleach images were serially recorded at 488 nm (donor) and 546 nm (acceptor), respectively, using an argon laser and appropriate emission bands. Low laser intensities were used to avoid acquisition bleaching. The acceptor was bleached at high intensity at 546 nm. FRET efficiency is displayed in pseudo color for better visualization.
Statistical analysis
All data were expressed as means±standard deviations (SD). Comparisons between the different groups were performed by ANOVA followed by Bonferroni’s post comparison test.
RESULTS
Harmless Aβ42 oligomers become toxic in GM1-enriched neuronal cells
Aβ42 oligomers display a high degree of polymorphism, and several different conformers with differing cytotoxic properties have been described in the past [13, 51]. Amongst them, two types of small soluble Aβ42 oligomers have been recently shown to possess similar size, similarly unfolded secondary structure, but distinct toxic properties, as a consequence of their structural differences [41, 52]. We prepared in vitro these alternative conformers of Aβ42 oligomers (named A+ and A–) using different conditions of aggregation according to the protocol of Ladiwala et al. [41]. The different cross-reaction of A+ and A–oligomers with the conformation-specific A11 antibody [53], assessed by immunoblot analysis of the proper amount of oligomers (Fig. 1A), was in agreement with previous data [41]. The different behavior of A–oligomers (non-toxic) with respect to A+ oligomers (toxic) was confirmed in human SH-SY5Y neuroblastoma cells by using the MTT assay (Fig. 1B), taking into account some concerns regarding a nonspecific interference of Aβ peptide with MTT reduction [54]. However, A–oligomers become significantly toxic in cells enriched in GM1 content by a factor of ca. 3, where the MTT reduction assay showed a level of cell impairment similar to that found in the presence of A+ oligomers (ca. 30%) (Fig. 1B). Aβ-derived diffusible ligands (ADDLs) were used as a positive control (Fig. 1B), due to their pathological relevance [55]. A similar toxic effect of soluble oligomers was also observed in cells depleted of membrane cholesterol by incubating the cells in solutions containing β-cyclodextrin (β-CD) (Fig. 1B). These results suggest that the cholesterol content of the cell membrane is inversely correlated with the membrane perturbing effects of Aβ42 oligomers. These data are also consistent with our previous reports showing that disruption of cholesterol homeostasis can be detrimental to neuronal cells, because toxic Aβ aggregates interact more easily with cholesterol-poor membranes [4, 44]. In addition, these results indicate that A–oligomers can contribute to the pathogenic process. Thus, none of the protein misfolded oligomers can be considered entirely harmless, but an ensemble of different oligomers is able to interfere with variable efficiencies with neuronal viability in elderly people.
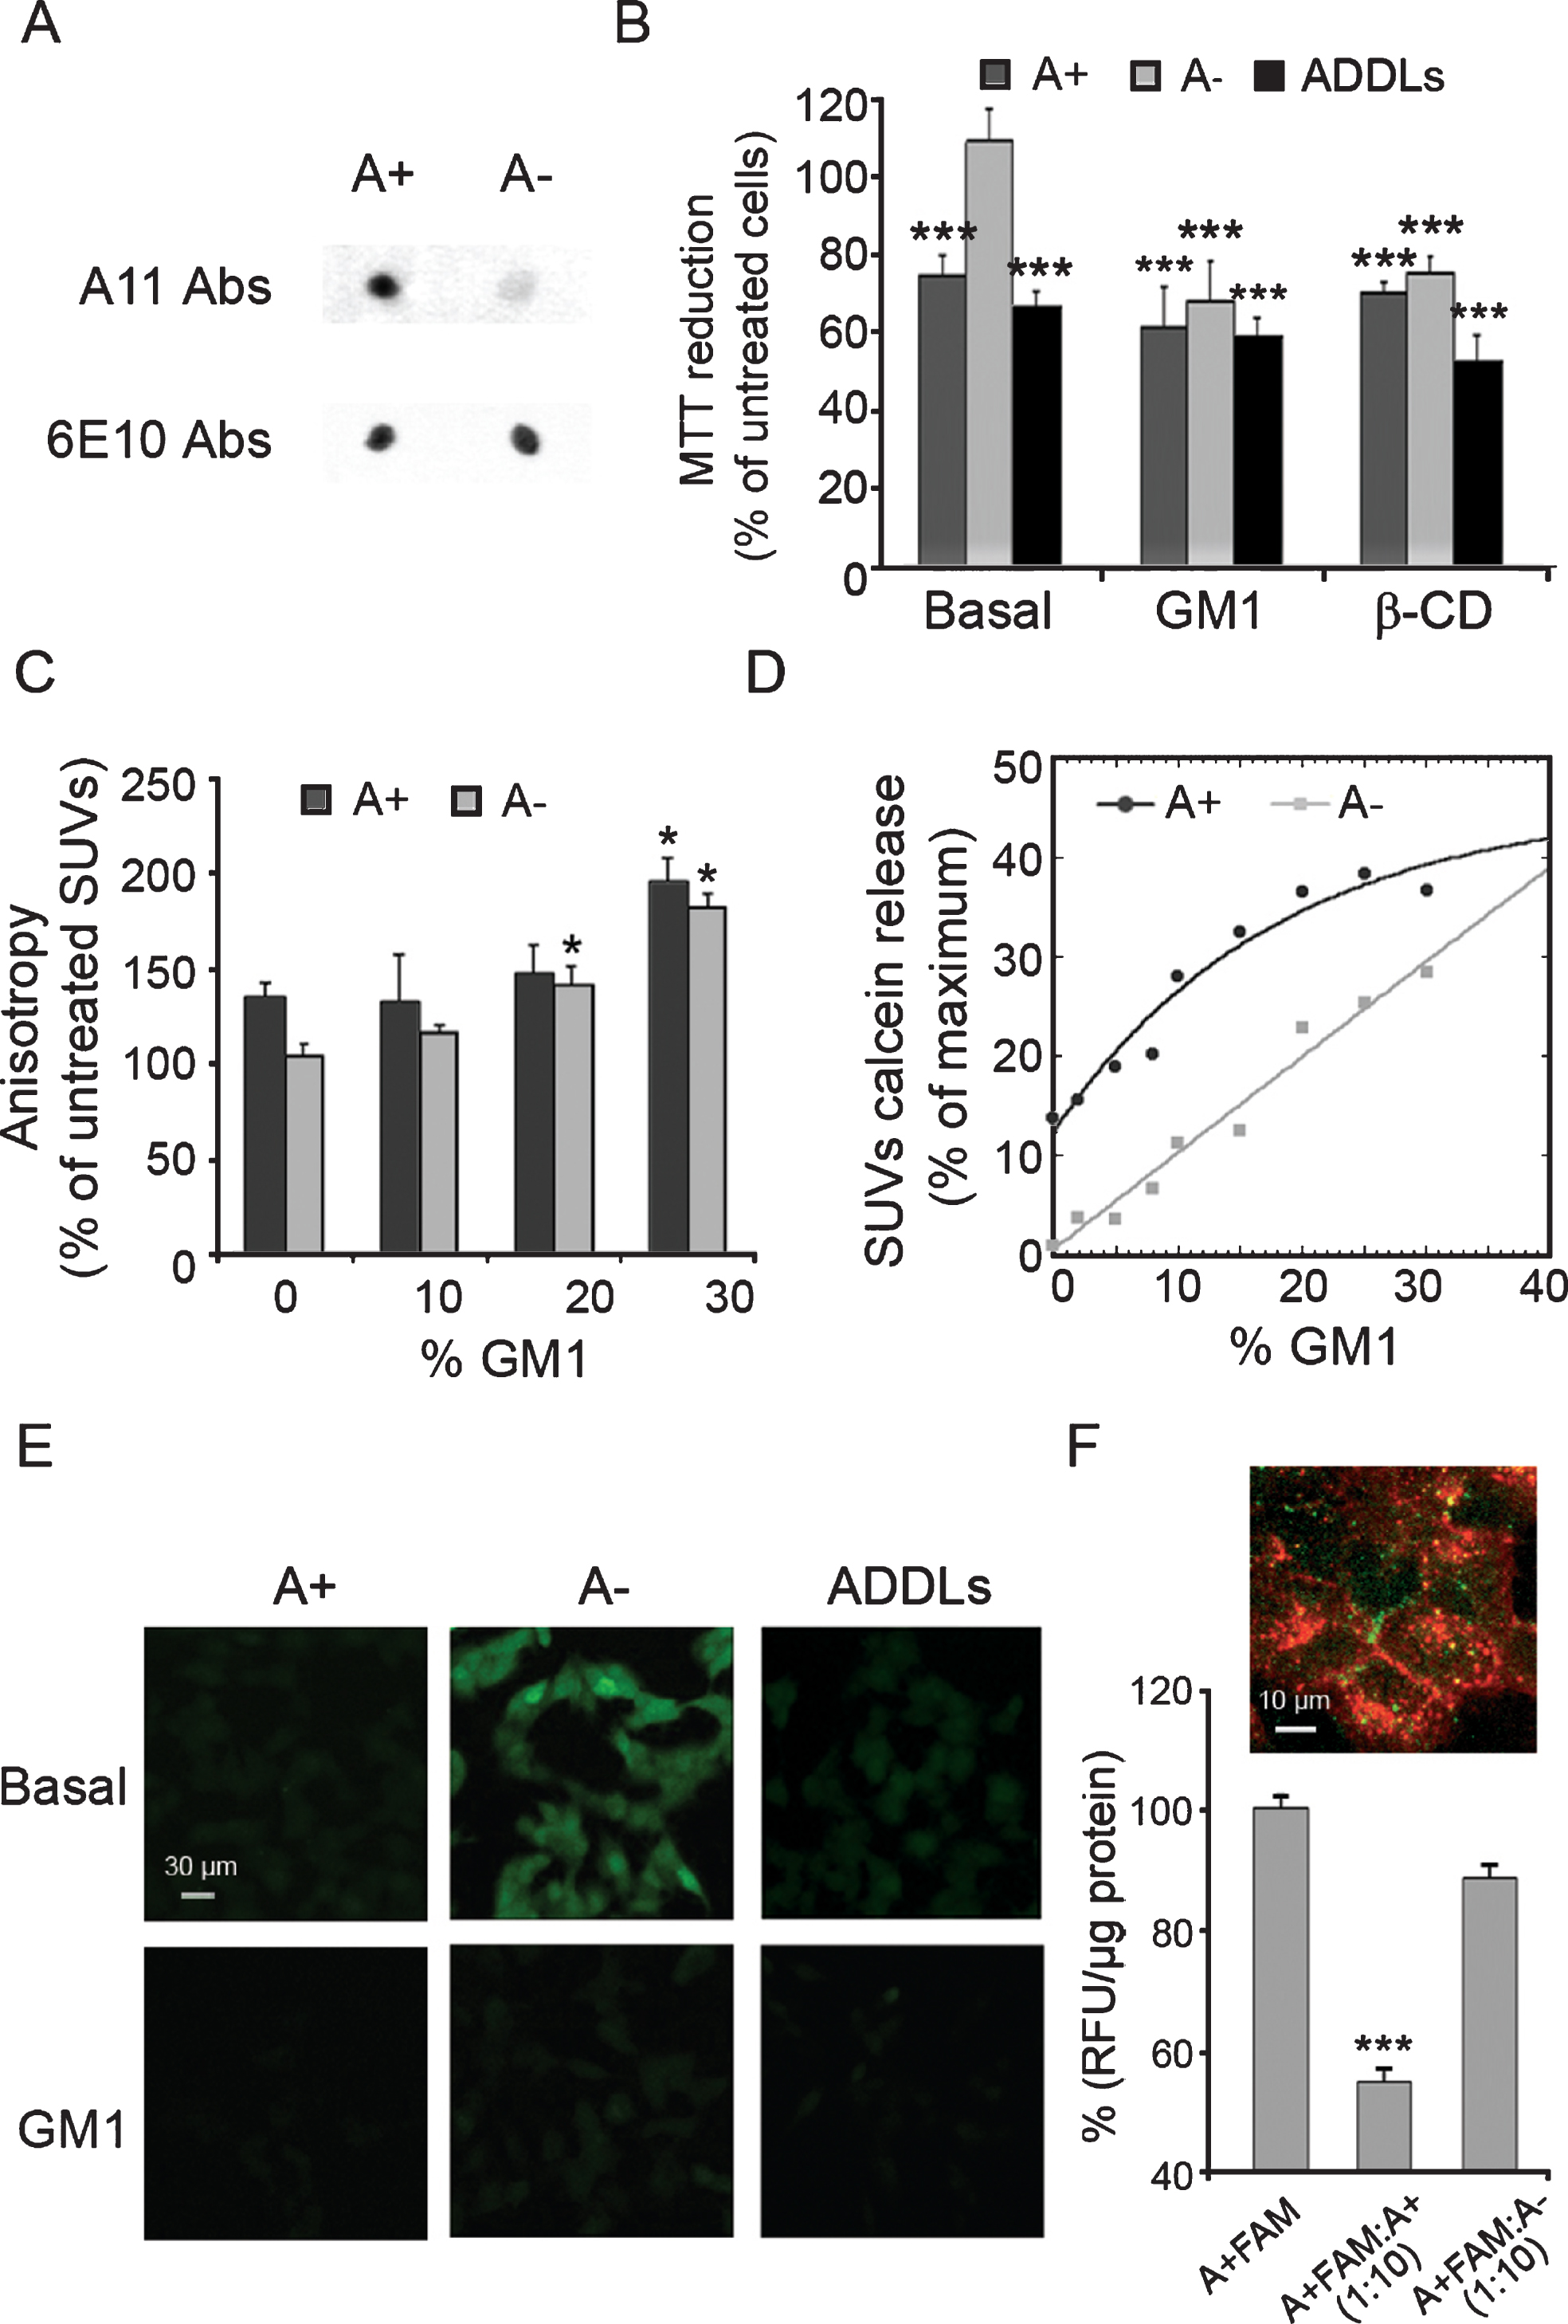
Cytotoxicity of Aβ42 oligomers on human neuroblastoma SH-SY5Y cells with basal and increased GM1 content. A) Dot-blot analysis of A+ and A–oligomers of Aβ42 probed with conformation-specific (A11, prefibrillar oligomers, top) and sequence-specific (6E10, N-terminus of Aβ, bottom) antibodies. B) MTT reduction of basal, GM1-enriched (GM1), and cholesterol-depleted (β-CD) SH-SY5Y cells treated for 24 h with A+, A–, and ADDLs oligomers (12 μM, monomer equivalents). Data are expressed as mean±SD (n = 4 per group). The triple (***) asterisk refers to p values lower than 0.001 relative to untreated cells. C) DPH fluorescence anisotropy measured by incubating SUVs containing different percentages of GM1 with A+ and A–oligomers (12 μM, monomer equivalents) for 30 min. The single (*) asterisk refers to p values lower than 0.05 relative to SUV containing 0% GM1 and without oligomers. D) Calcein release in SUVs containing different percentages of GM1 incubated with A+ and A–oligomers (12 μM, monomer equivalents) for 30 min. Data are expressed as mean±SD (n = 4 per group). E) Representative confocal scanning microscopy images of basal and GM1-enriched (GM1) SH-SY5Y cells showing levels of intracellular calcein (green fluorescence) following exposure for 60 min to A+, A–oligomers, and ADDLs (12 μM, monomer equivalents). F) Representative confocal scanning microscopy image of GM1-enriched SH-SY5Y cells treated for 3 h with labelled A+ FAM oligomers (1 μM, monomer equivalents). Red and green fluorescences indicate the cell membranes and the Aβ42 oligomers, respectively. The histogram shows the fluorescence intensity of A+FAM oligomers associated with cells treated with A+FAM oligomers (1 μM, monomer equivalents), in the absence or in the presence of 10×molar excess of unlabeled A–or A+ oligomers (10 μM, monomer equivalents) for 3 h at 4°C. The fluorescence associated with the cells was normalized by total protein content. The triple (***) asterisk refers to p values lower than 0.001 relative to cells treated with A+FAM only.
Oligomer recruitment to lipid bilayers is higher both in SUVs and in neuronal cells when enriched in GM1
The GM1 content in neuronal membranes has been found to increase both with age [2] and in the brains of AD patients [3, 37], as compared to healthy controls. Therefore, an approach mimicking the GM1 density observed in aged brains appears to be useful to investigate whether a quantitative relationship does exist between ganglioside abundance and oligomers binding to neuronal cells. We have recently shown that GM1 is able to recruit Aβ42 oligomers to lipid raft domains of the cell membrane [4]. To further study whether GM1 abundance could affect the binding capacity of Aβ42 oligomers to the lipid bilayers, we used small unilamellar vesicles (SUVs) with a variable content of 1,2-dioleoyl-sn-glycero-3-phosphocholine (DOPC) (70–100%) and GM1 (0–30%) as a model of neuronal membranes [56]. We first analyzed the fluorescence anisotropy ratio (r) of 1,6-diphenyl-1,3,5-hexatriene (DPH), whose value correlates inversely to the degree of membrane fluidity [44]. A progressive reduction of membrane fluidity was observed in vesicles with increasing percentage of GM1 following treatment with either amyloid oligomer (Fig. 1C), indicating that A–oligomers are able to penetrate and to stiffen GM1-rich SUVs similarly to A+ oligomers in this model system. Accordingly, the ability of both types of oligomers to cause membrane disruption, as measured by calcein release assay, raises significantly by increasing GM1 abundance in SUVs (Fig. 1D).
Then, we investigated the alteration of membrane permeability induced by A+, A–and ADDLs oligomers in normal and GM1-enriched neuroblastoma cells pre-loaded with calcein-AM as a fluorescent probe. In agreement with the results obtained with SUVs, A+ oligomers and ADDLs triggered membrane permeabilization both in basal and in GM1-enriched cells, whereas A–oligomers became effective only in GM1-enriched cells (Fig. 1E). Taken together, these findings suggest that GM1 abundance modulates the ability of oligomer conformers to disassemble the lipid bilayers both in synthetic and in cell membranes.
Distinct oligomer conformers interact differently with the neuronal membrane
The differential cytotoxicity behavior displayed by A+ and A–oligomers seems to be related with the way these two conformers interact with the target cells. Accordingly, we investigated in GM1-enriched neuronal cells whether A–oligomers were able to compete with A+ conformers for cell-binding sites by using fluorescently labelled A+ oligomers (A+FAM). Human neuroblastoma cells were incubated with A+FAM oligomers in the presence or absence of a 10-fold molar excess of unlabeled A–or A+ oligomers for 3 h at 4°C, a length of time sufficient to reach steady state [57]. A high degree of co-localization of A+FAM oligomers (green channel) with cell membranes (red channel) was observed in the absence of energy-dependent processes (Fig. 1F). In addition, the amount of A+FAM associated with the cells was measured by fluorescence intensity analysis and the data were normalized for total protein content in the cell lysates. Unlabeled A+ oligomers induced a marked displacement of about 50% of A+FAM associated with the cells, whereas A–oligomers induced only a displacement of about 15% (Fig. 1F). These data suggest that A+ and A–oligomers interact with the cells at different sites and/or with different affinities.
Different oligomer conformers induce Ca2+ dyshomeostasis by distinct molecular mechanisms
Many studies have reported that the Ca2+ influx from the extracellular medium into the cytosol is an early event in the cascade of biochemical alterations underlying Aβ cytotoxicity [23, 58]. Therefore, we investigated the biochemical effects of Aβ42 binding to GM1-enriched cells measuring the levels of intracellular Ca2+ by confocal microscopy using Fluo3-AM as a probe. We found that A+ oligomers and ADDLs caused an extensive influx of Ca2+ ions into neuronal cells with either basal or enriched content of GM1, whereas A–oligomers became effective only in GM1-enriched cells (Fig. 2A). Moreover, pre-treating cells with basal GM1 content with A–oligomers did not prevent Ca2+ influx induced by A+ oligomers (Fig. 2A). The different effects of the two oligomer conformers were confirmed in neuroblastoma cells differentiated with retinoic acid for six days (Fig. 2B). Finally, we found that Ca2+ dyshomeostasis induced by soluble oligomers was completely rescued by cell treatment with the specific GM1-ligand cholera toxin β-subunit (CTX-B), a component of the enterotoxin produced by Vibrio cholerae (Fig. 2B). This evidence was confirmed in primary hippocampal neurons from rat brain (Fig. 2C), a more relevant model for AD studies. Taken together, these data suggest that A+ and A–oligomers induce Ca2+ dyshomeostasis by distinct, yet GM1-dependent, molecular mechanisms.
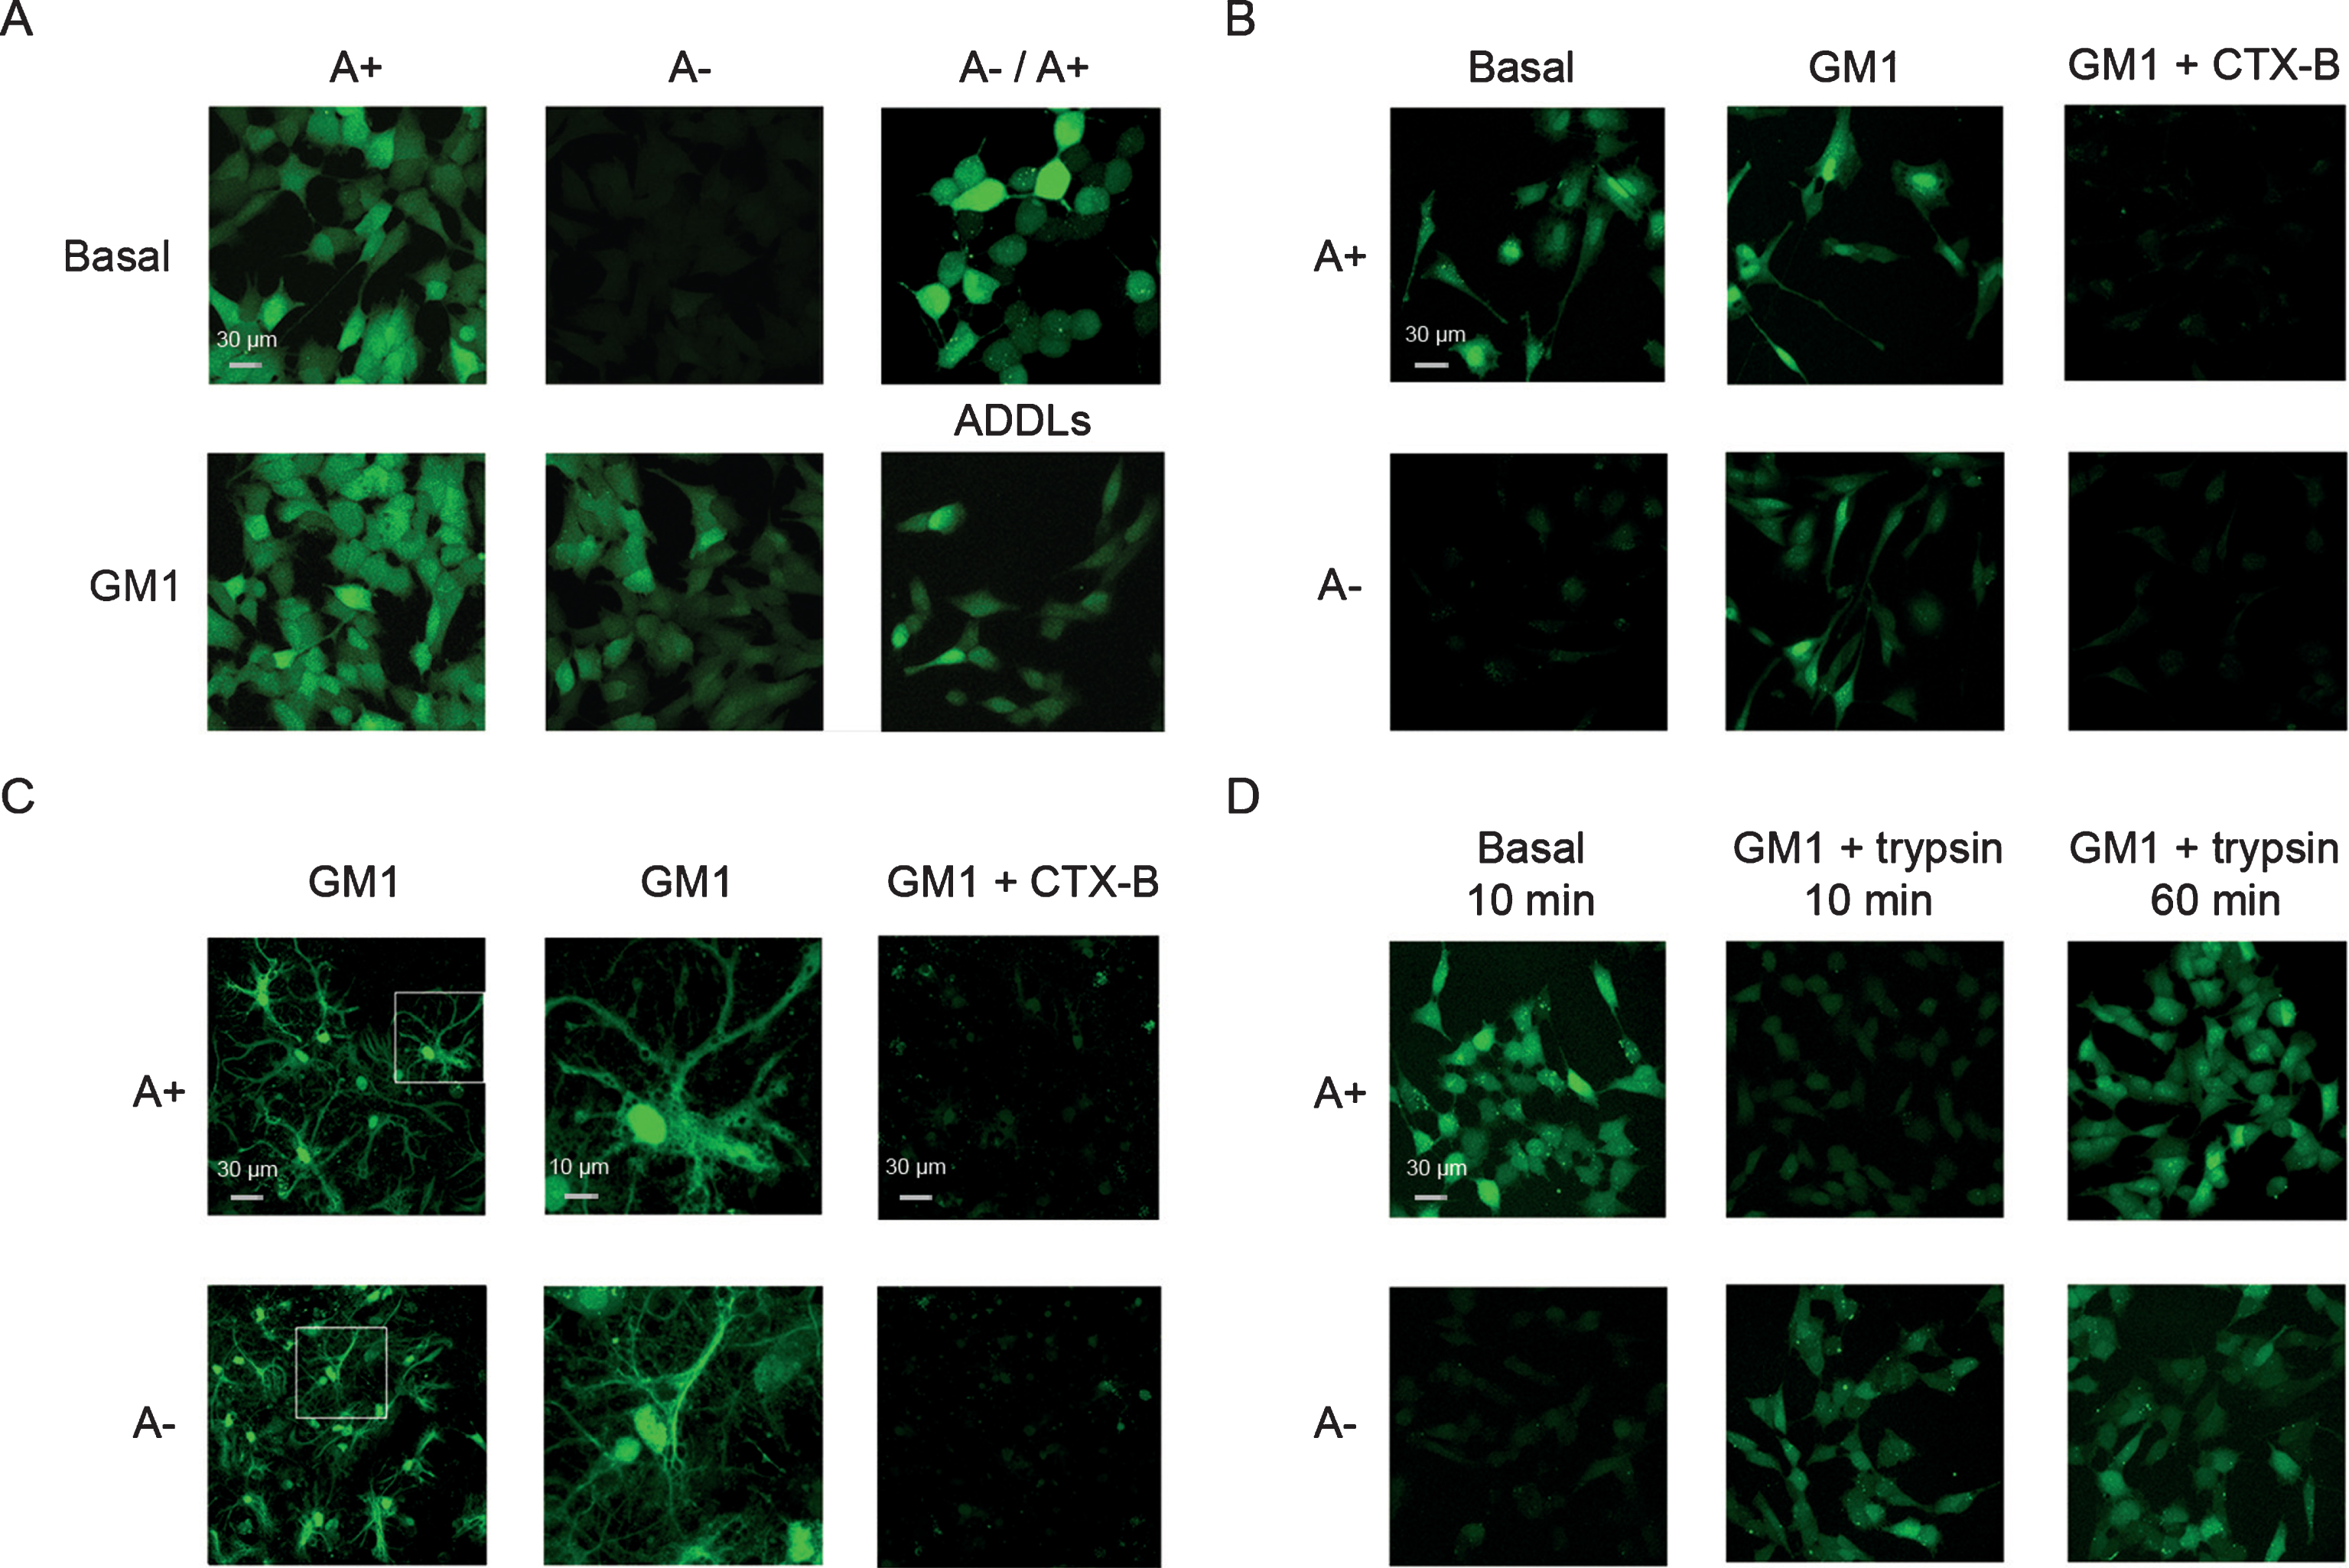
Ca2+ dyshomeostasis caused by different Aβ42 oligomer conformers on human neuroblastoma SH-SY5Y cells and rat hippocampal primary neurons. A) Representative confocal scanning microscopy images of basal and GM1-enriched (GM1) SH-SY5Y cells showing the levels of intracellular free Ca2+ following exposure for 60 min to A+, A–, and ADDLs oligomers (12 μM, monomer equivalents), or following a pre-treatment for 60 min with A–oligomers (12 μM, monomer equivalents) prior to the A+ exposure. B, C) Representative confocal scanning microscopy images of basal and GM1-enriched (GM1) SH-SY5Y cells differentiated with all-trans retinoic acid (B) and GM1-enriched (GM1) primary rat hippocampal neurons (C) showing levels of intracellular free Ca2+ following exposure for 60 min to A+ and A–oligomers (12 μM, monomer equivalents), in the absence or in the presence of a pre-treatment for 20 min with the cholera toxin subunit B (CTX-B) prior to the oligomers exposure. D) Representative confocal scanning microscopy images of basal and GM1-enriched (GM1) SH-SY5Y cells showing levels of intracellular free Ca2+, following 10 min incubation with 0.05% trypsin prior to exposure for 10 or 60 min to A+ and A–oligomers (12 μM, monomer equivalents). The green fluorescence arise from Ca2+ binding to the intracellular Fluo3 probe.
To further define the early phase of oligomer-membrane interaction, we incubated neuroblastoma cells with A+ and A–oligomers for 10 min at 4°C. In agreement with the results reported above, A+ oligomers, but not A–oligomers, induced an extensive influx of Ca2+ ions into neuronal cells with basal GM1 content (Fig. 2D). We also removed the proteins exposed on the cell membrane by incubating the cells with 0.05% trypsin. Confocal image of GM1-enriched cells showed that trypsin treatment prevented the early (10 min), but not the delayed (60 min) Ca2+ influx induced by A+ oligomers (Fig. 2D) as compared to control samples (Fig. 2A). On the contrary, trypsin treatment did not affect the interaction of A–oligomers with the GM1-enriched cells neither at early nor at longer incubation times (compare Fig. 2D with Fig. 2A). These data indicate that the mechanism by which A+ and A–interact with the cells is different; they also suggest that a specific membrane protein(s) might be involved in the early interaction of the A+ oligomers but not A–oligomers with the cells.
A11-positive oligomers co-localize with glutamatergic receptors
It has been reported that misfolded protein oligomers trigger Ca2+ influx by both channel-independent and channel-dependent alteration of the selective permeability of lipid bilayers [25 , 60]. Voltage-gated [61] or ligand-gated calcium channels, such as the glutamate NMDA-R and AMPA-R [35, 62], have been considered as possible receptors or specific interaction sites for oligomers. To gain deeper insight on A+ and A–oligomer binding to AMPA-R and NMDA-R embedded into the plasma membrane, we investigated whether these assemblies were able to physically interact with the receptors in primary rat hippocampal neurons, particularly rich in these receptors. Our results showed a higher degree of co-localization (ca. 80%) of A+ oligomers with NMDA-R and AMPA-R both in rat hippocampal neurons (Fig. 3A, B) and in human neuronal cells (Fig. 3C, D). In contrast, a low degree of co-localization (ca. 20%) of A–oligomers with glutamatergic receptors was found in rat hippocampal neurons (Fig. 3A, B).
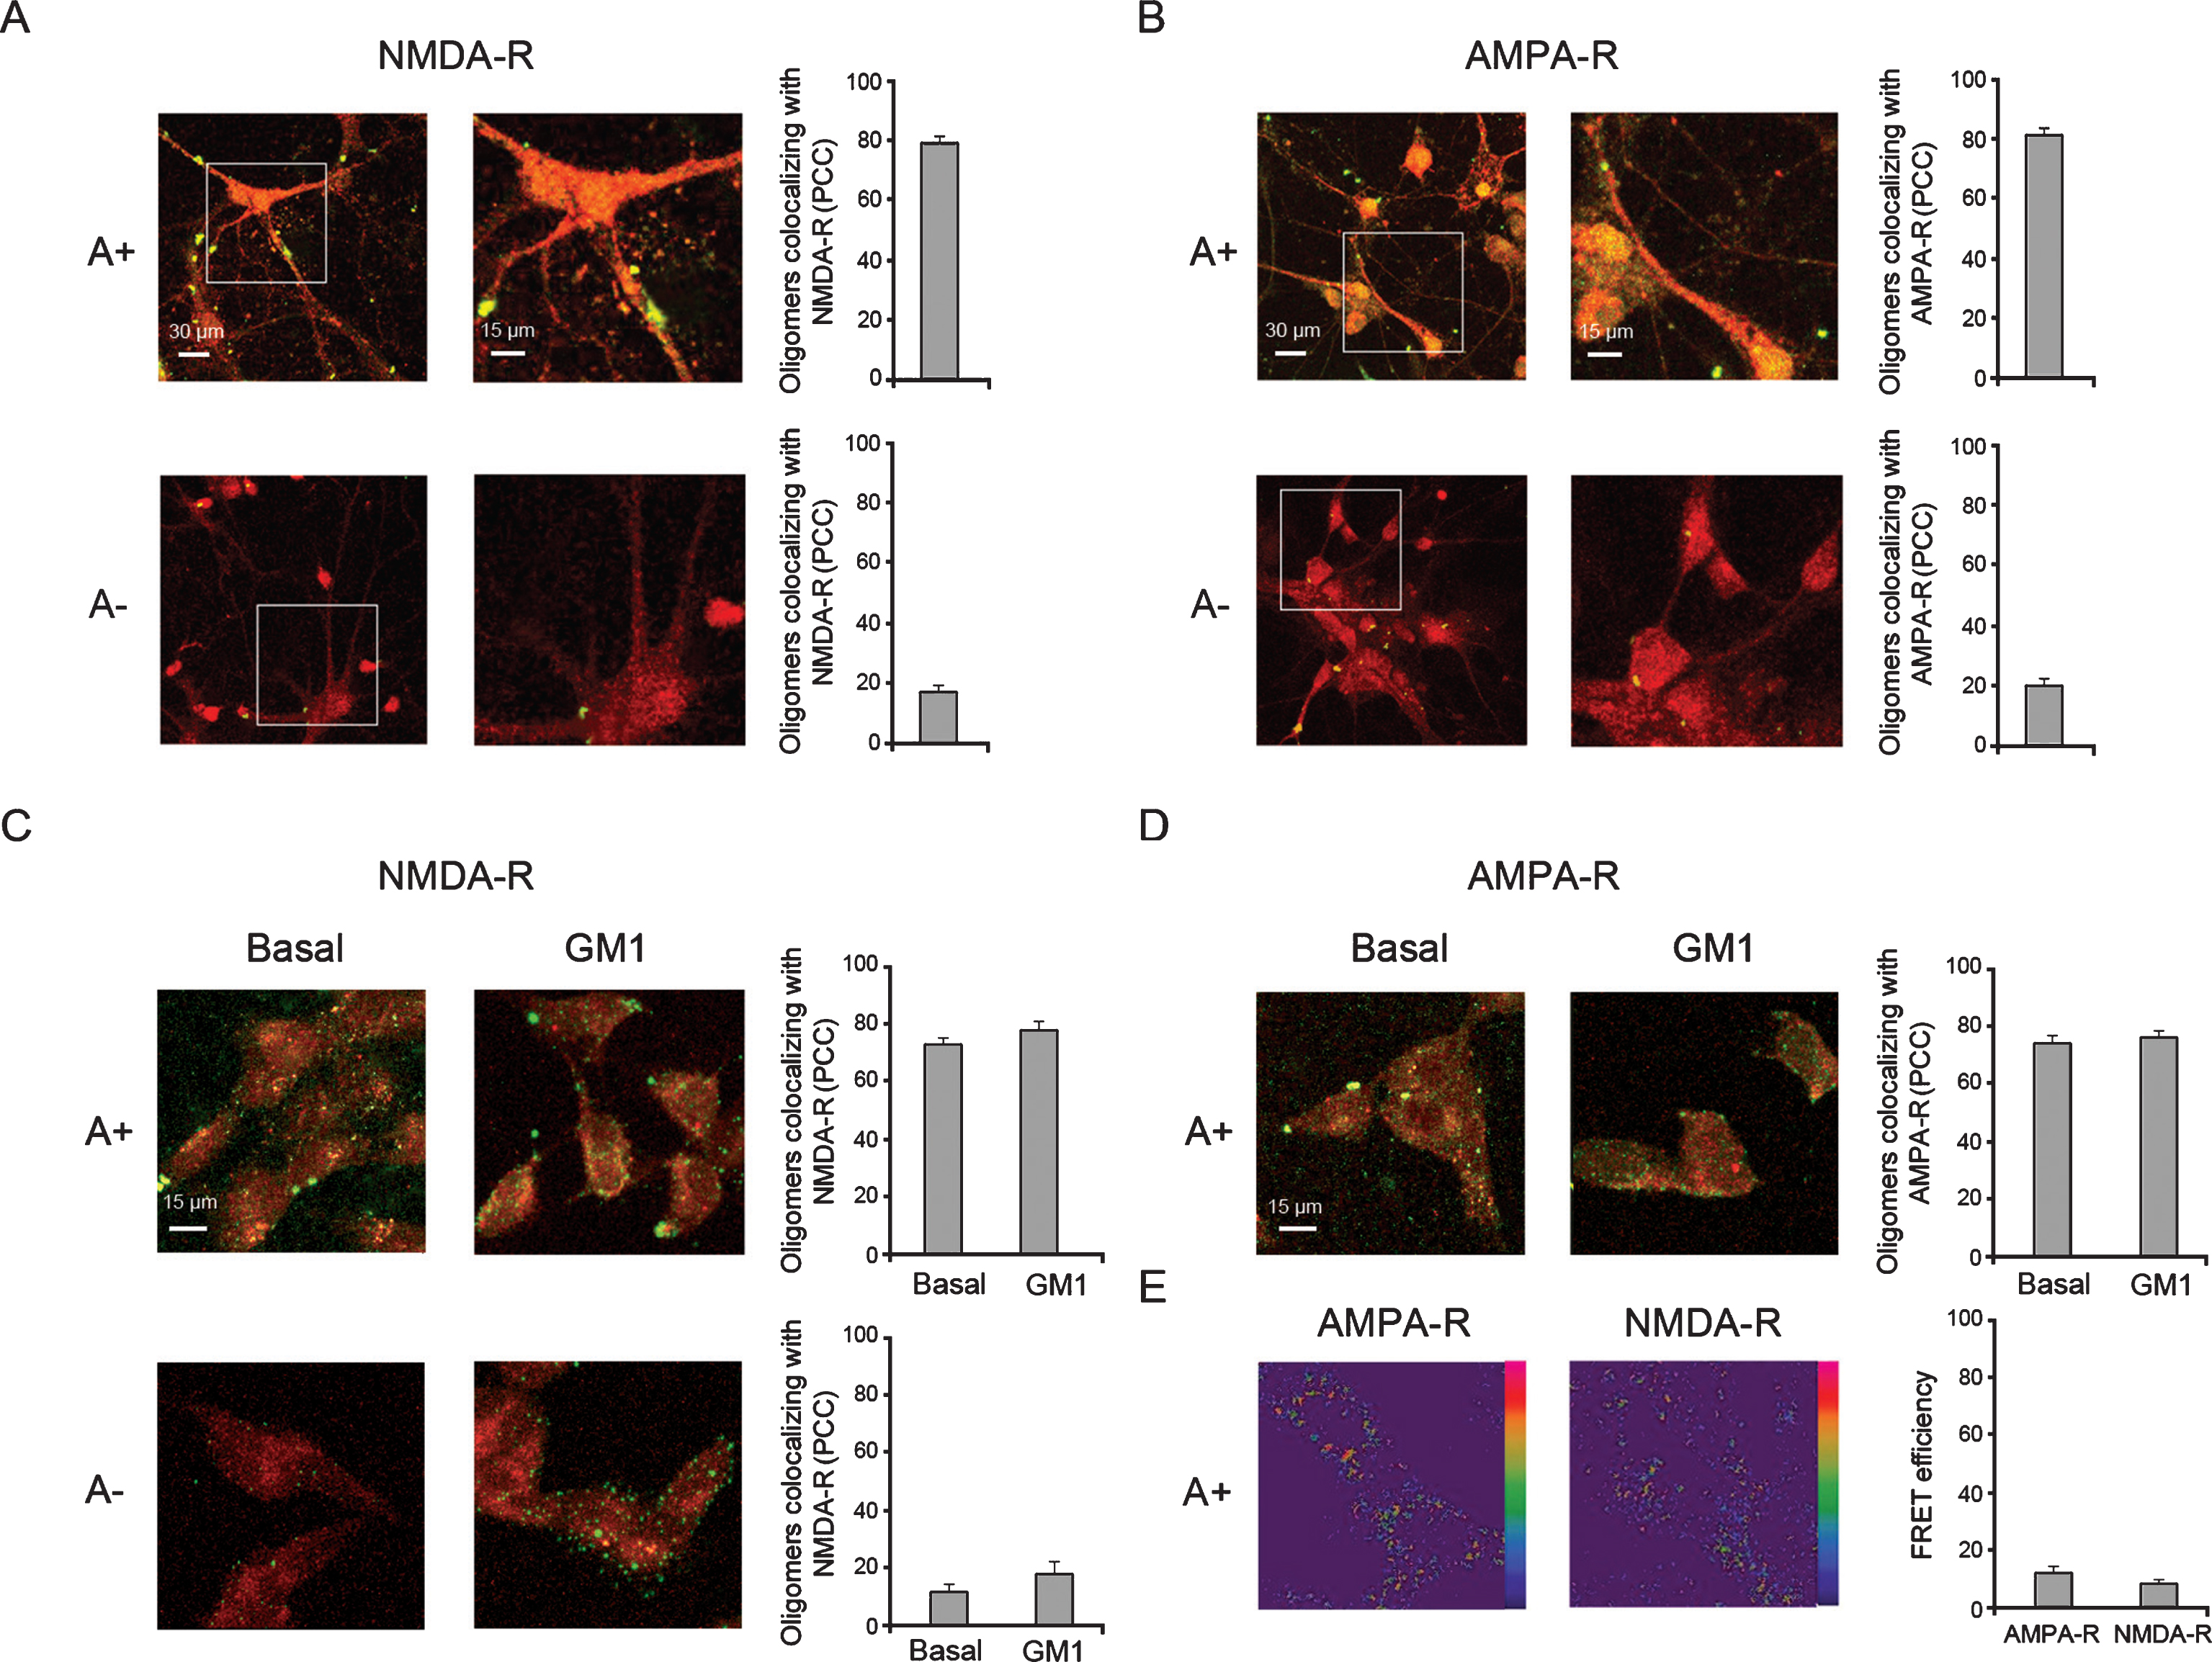
Co-localization of A+ and A–Aβ42 oligomers with NMDA-R and AMPA-R in human neuroblastoma SH-SY5Y cells and primary hippocampal neurons. A, B) Representative confocal scanning microscopy images of primary rat hippocampal neurons treated for 20 min with A+ and A–oligomers (12 μM, monomer equivalents). C) Representative confocal scanning microscopy images of basal and GM1-enriched (GM1) SH-SY5Y cells treated for 20 min with A+ and A–oligomers (12 μM, monomer equivalents). D) Representative confocal scanning microscopy images showing basal and GM1-enriched (GM1) SH-SY5Y cells treated for 20 min with A+ oligomers (12 μM, monomer equivalents). Red and green fluorescences indicate the NMDA-R or AMPA-R and the Aβ42 oligomers, respectively. The histograms show the percentage of co-localization on regions of interest (12–13 cells) using the ImageJ (NIH, Bethesda, MD, USA) and JACOP plugin (rsb.info.nih.gov) software. Data are expressed as mean±SD (n = 18 per group). E) Examples of FRET efficiency images, reflecting the molecular interaction of A+ oligomers with AMPA-R and NMDA-R in human neuronal cells. Fluorescence intensities of Alexa Fluor 488 associated with oligomers are displayed in pseudo color according to the bar scale, with red pixels indicating intense fluorescence and blue pixels indicating weak fluorescence. The histogram shows the FRET efficiency on regions of interest (12–13 cells) using the ImageJ (NIH, Bethesda, MD, USA) and JACOP plugin (rsb.info.nih.gov) software. Data are expressed as mean±SD (n = 18 per group).
To further define the A+/AMPA-R and A+/ NMDA-R spatial relations, we used FRET-fluorescence imaging microscopy to determine the intermolecular proximity of A+ oligomers to glutamatergic channels at the cell surface of human neuronal cells. The results showed a weak FRET efficiency amounting to ca. 10% (Fig. 3E), taking into account some concerns regarding the use of double antibody staining, which reduces fluorophore proximity. This evidence suggests that A+ oligomers proximity to both AMPA-R and NMDA-R is unlikely to involve a molecular interaction or binding. These data also indicate that a channel-dependent mechanism mediates Ca2+ dysfunction in neuronal cells facing A+ oligomers.
Glutamatergic receptors mediate early Ca2+ dyshomeostasis induced by A11-positive oligomers
Finally, we investigated whether GM1 density affected the ability of Aβ42 oligomers to influence the channel activity of glutamatergic receptors by a pharmacological approach. GM1-enriched neuronal cells were pre-incubated for 60 min with 6-cyano-7-nitroquinoxaline-2,3-dione (CNQX), or with memantine (mem), which are inhibitors of AMPA-R and NMDA-R, respectively, and then exposed to A+ or A–oligomers. CNQX and mem prevented the intracellular Ca2+ influx in GM1-enriched cells exposed for 10 min to A+ oligomers, suggesting the involvement of both AMPA-R and NMDA-R in the early stages of neuronal Ca2+ dysregulation (Fig. 4A). In contrast, the ability of A–oligomers to induce Ca2+ influx in GM1-enriched cells was not affected by any pharmacological treatment (Fig. 4B), indicating that A–cytotoxicity was not mediated by calcium channels. Similar results were obtained in cells treated with anti-AMPA or anti-NMDA antibodies (Fig. 4A, B), whereas Cd2+ could not rescue the Ca2+ dyshomeostasis induced by either oligomer (Fig. 4A, B), suggesting that VDCCs are not involved.
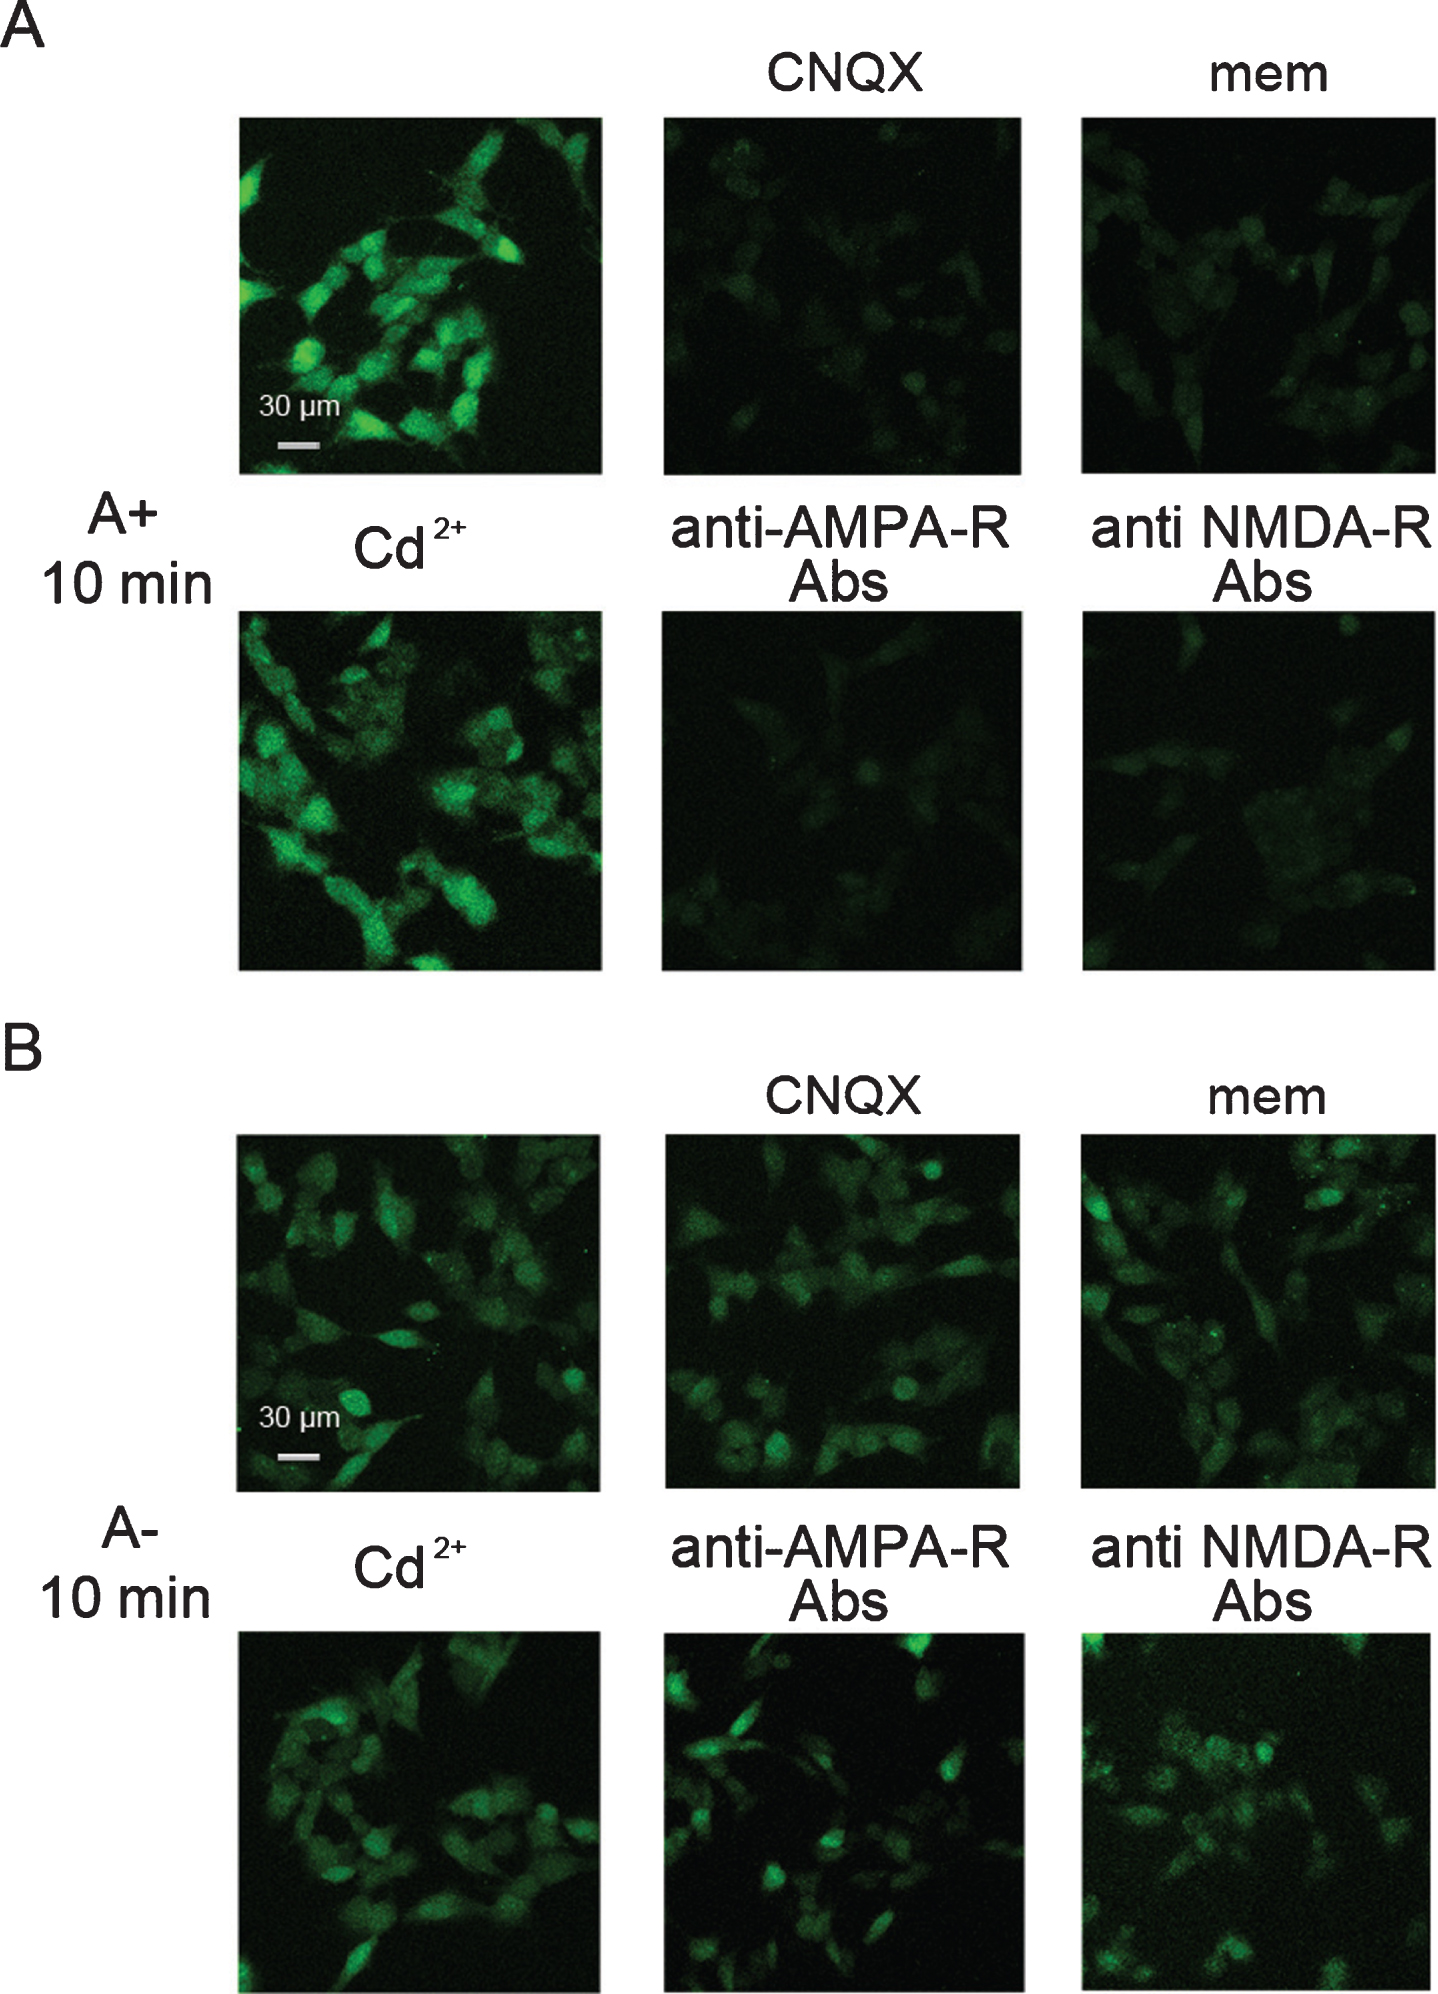
Effects of antagonists on the Ca2+ influx induced after 10 min of treatment with Aβ42 oligomers in GM1-enriched cells. A, B) Representative confocal scanning microscopy images of GM1-enriched SH-SY5Y cells showing levels of intracellular free Ca2+ following exposure for 10 min to A+ (A) and A–(B) oligomers (12 μM, monomer equivalents) in the presence of 5 μM CNQX, 10 μM mem, 10 μM Cd2+, 1:200 anti-AMPA-R or 1:200 anti-NMDA-R antibodies. The green fluorescence arise from Ca2+ binding to the intracellular Fluo3 probe.
To confirm and extend the validity of the results reported above, we also investigated, in the same way, the behavior of two different types of oligomers, type A and type B, with different cytotoxicities grown from the model protein HypF-N (Fig. 5A, B ). First, we confirmed that type A oligomers of HypF-N compete with A+ conformers of Aβ42 for neuronal-binding sites by using labelled A+FAM oligomers. Indeed, a 10-fold molar excess of unlabeled type A oligomers of HypF-N induced a marked displacement of about 40% of A+FAM associated with human neuroblastoma cells (Fig. 5C). We also found that Ca2+ dyshomeostasis triggered by both types of HypF-N oligomers in basal or GM1-enriched cells was very similar to that induced by Aβ42 oligomers (Fig. 5D-F). Indeed, similarly to A–oligomers, type B oligomers did not block the neuronal response to toxic A+ oligomers (Fig. 5D). In addition, CNQX and mem, similarly to anti-AMPA-R and anti-NMDA-R antibodies, were able to selectively inhibit Ca2+ influx induced by type A, but not type B, oligomers in GM1-enriched cells (Fig. 5E, F), whereas, Cd2+ did not modify Ca2+ influx induced by either oligomer (Fig. 5E, F). The similarity of the effects induced in cells exposed to Aβ and HypF-N oligomers suggests that these effects arise from a common behavior that is largely independent of the sequence of the protein involved.
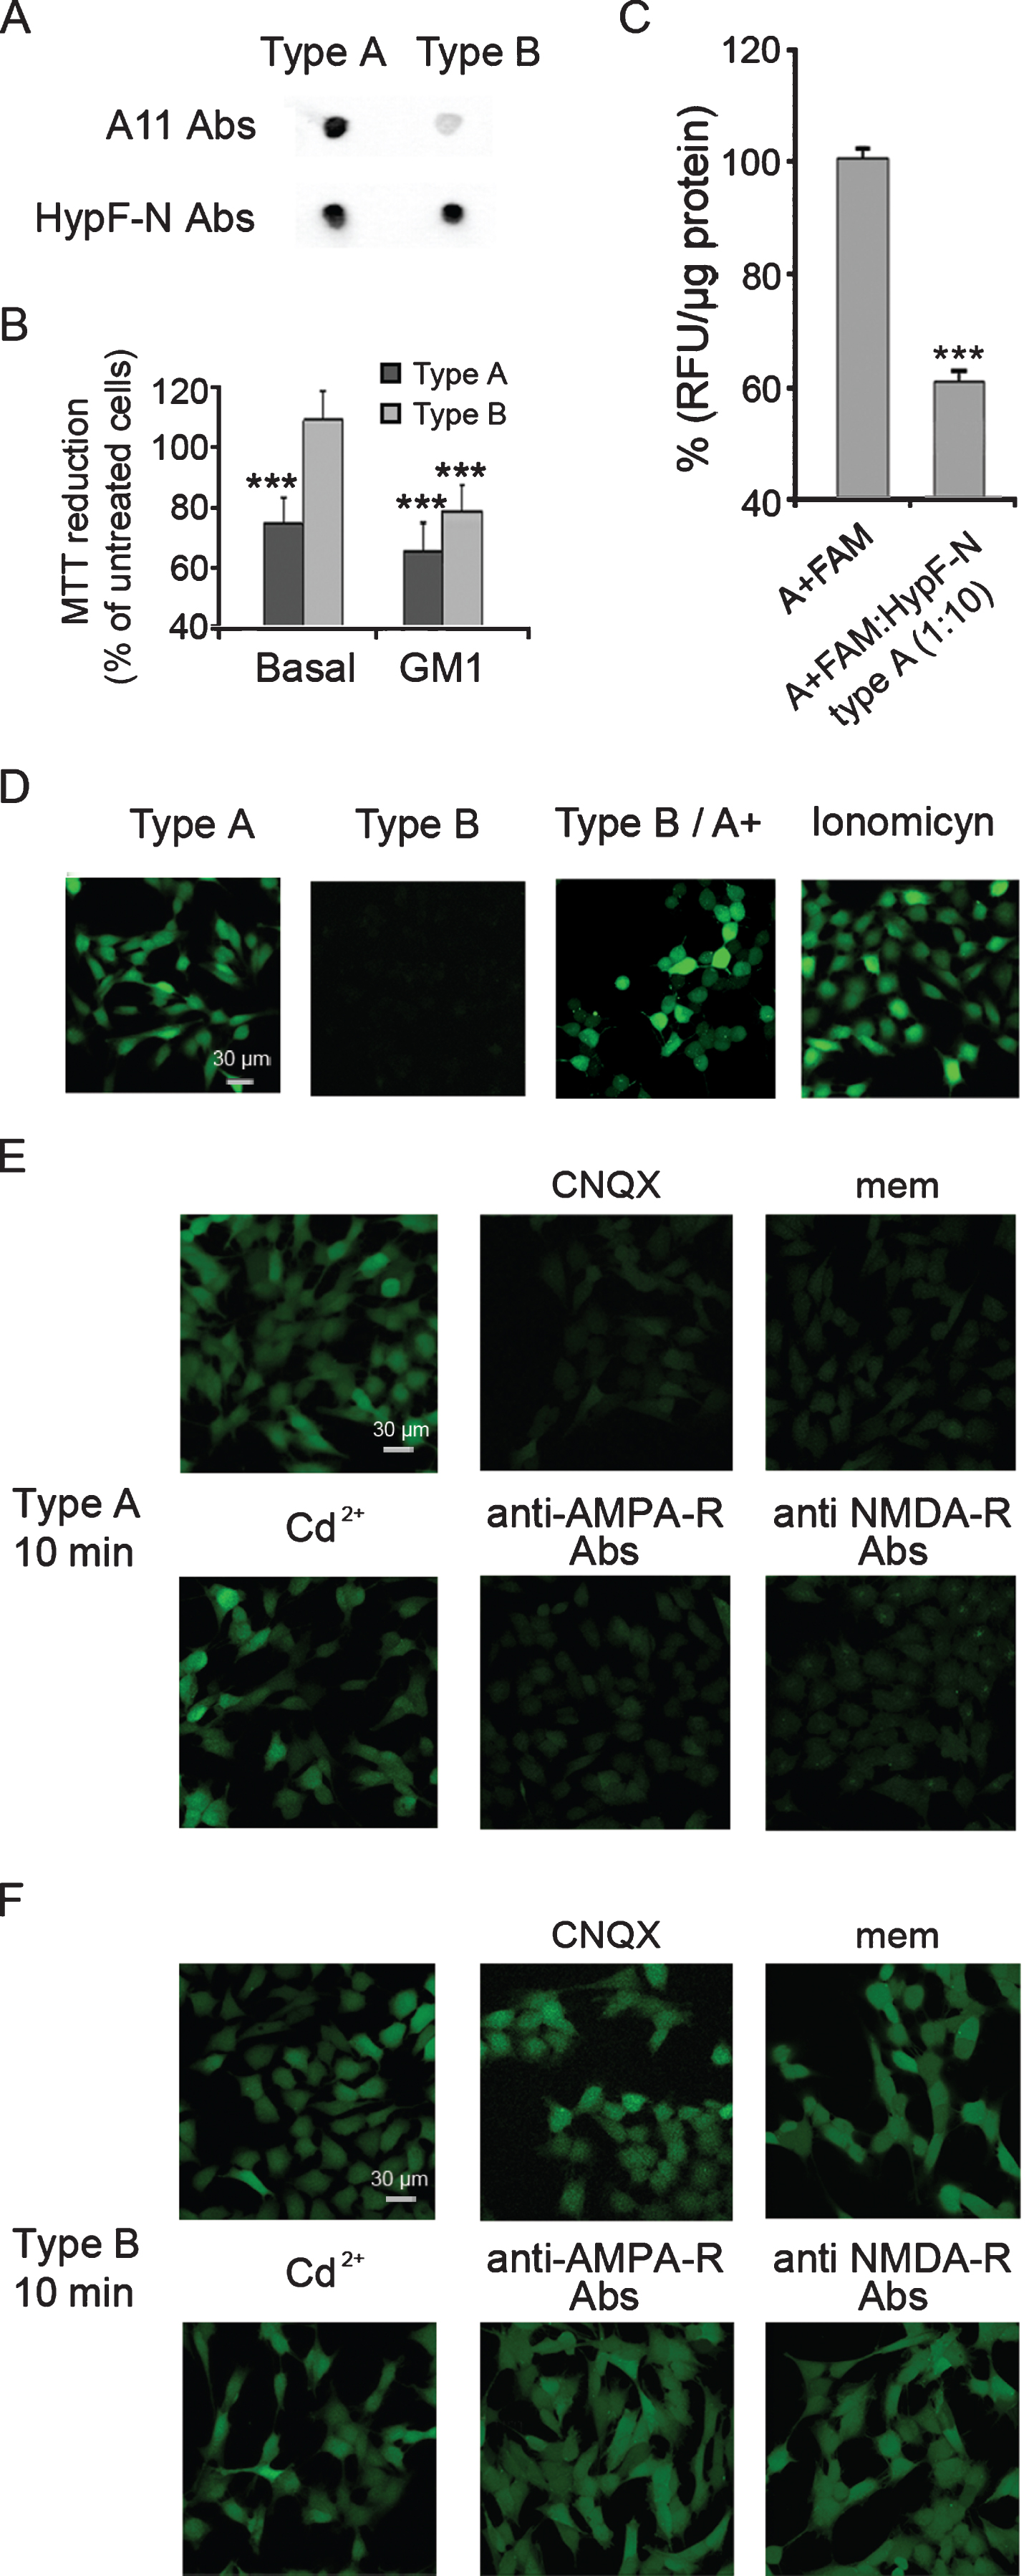
A) Dot-blot analysis of type A and type B oligomers of HypF-N probed with conformation-specific (A11, prefibrillar oligomers, top) and sequence-specific anti-HypF-N antibodies (bottom). B) MTT reduction of basal and GM1-enriched (GM1) SH-SY5Y cells treated for 24 h with type A and type B oligomers of HypF-N (12 μM, monomer equivalents). Data are expressed as mean±SD (n = 4 per group). The triple (***) asterisk refers to p values lower than 0.001 relative to untreated cells. C) The histogram shows the fluorescence intensity of A+FAM oligomers (1 μM, monomer equivalents) associated with cells following incubation in the absence or in the presence of 10×molar excess of unlabeled HypF-N type A oligomers (10 μM, monomer equivalents) for 3 h at 4°C. The fluorescence associated with the cells was normalized by total protein content. The triple (***) asterisk refers to p values lower than 0.001 relative to cells treated with A+FAM only. D) Representative confocal scanning microscopy images of basal SH-SY5Y cells showing levels of intracellular free Ca2+ following exposure for 60 min to type A and type B oligomers (12 μM, monomer equivalents), or to 1 μM ionomycin, or following a pre-treatment with type B oligomers (12 μM, monomer equivalents) prior to the A+ oligomers exposure. E, F) Representative confocal scanning microscopy images of GM1-enriched SH-SY5Y cells showing levels of intracellular free Ca2+ following exposure for 10 min to type A (E) and type B (F) oligomers (12 μM, monomer equivalents) in the presence of 5 μM CNQX, 10 μM mem, 10 μM Cd2+, 1:200 anti-AMPA or 1:200 anti-NMDA antibodies. The green fluorescence arise from Ca2+ binding to the intracellular Fluo3 probe.
Finally, we carried out a time-course analysis of the Ca2+ dyshomeostasis assessed in GM1-enriched cells exposed to type A or type B oligomers of HypF-N for different lengths of time (Fig. 6). CNQX or mem did not inhibit calcium influx in neuronal cell exposed to type A oligomers for longer lengths of time (15–180 min) (Fig. 6A), suggesting that AMPA-R and NMDA-R are involved only in the early stages of Ca2+ dyshomeostasis, while thereafter a channel-independent mechanism did occur. To better assess this point, we plotted the normalized Ca2+ fluorescence, quantified as the percentage of the maximum value measured in cells exposed to the ionophore ionomycin, as a function of time (Fig. 6C). Interestingly, a lag phase in the fluorescence spike was observed in the presence of CNQX and mem in cells exposed to type A oligomers (Fig. 6C). By contrast, no effects of CNQX or mem were observed on cells exposed to type B oligomers (Fig. 6B, D), excluding the involvement of calcium channels in cellular dyshomeostasis triggered by this conformer. These findings suggest that the interference of protein misfolded oligomers with a large solvent-exposed hydrophobicity on calcium fluxes across the cell membrane occurs in two steps: a first rapid step, where Ca2+ influx increases due to glutamatergic receptor stimulation, followed by a delayed step, where a channel-independent mechanism, possibly resulting from bilayer disassembly, is involved.

Time-course analysis of the Ca2+ influx induced by HypF-N type A and type B oligomers in GM1-enriched cells in the presence of calcium channel antagonists. A, B) Representative confocal scanning microscopy images of GM1-enriched SH-SY5Y cells treated for different lengths of time (0, 5, 10, 12, 15, 30, 60, and 180 min) with 12 μM (monomer concentration) type A (A) and type B (B) oligomers of HypF-N, in the presence of 5 μM CNQX or 10 μM mem, showing levels of intracellular free Ca2+. In all images, the green fluorescence arises from Ca2+ binding to the intracellular Fluo3-AM probe. C, D) Plots showing the fluorescence associated with intracellular Ca2+ versus time after treatment of the GM1-enriched cells with HypF-N type A (C) or type B (D) oligomers at 12 μM in the absence (black line) or in the presence of 5 μM CNQX (red line), 10 μM mem (blue line), or 10 μM Cd2+ (green line).
DISCUSSION
Small soluble oligomers of Aβ peptides, widely reported as the most toxic form of aggregated Aβ species, potently disrupt cellular Ca2+ homeostasis [51]. The multiplicity of Aβ oligomeric species is the result of inherent sequence variations, but also of different growth conditions and experimental approaches to generate such species in vitro or to isolate them from brain tissue [13]. Thus, we wondered which of these oligomeric species had the most membrane-permeabilizing ability. Charlie Glabe and colleagues proposed a useful approach to classify different conformers of Aβ aggregates and their toxicity based on the use of conformation-dependent antibodies [53]. These recognize generic epitopes associated with distinct peptide aggregation states rather than specific amino acid sequences [23]. This approach has defined the theoretical basis to investigate the presence of different conformers of a number of peptides and proteins populated over a given aggregation pathway or a given aggregation time.
Two types of small soluble Aβ42 oligomers have been recently described [41]. The two oligomers share similar sizes and a substantially unfolded secondary structure, but interact differently with the A11 antibodies and display distinct toxic properties, as a consequence of their structural differences, in particular their different levels of solvent-exposed hydrophobicity [41, 52]. Our findings show that the different toxicities of the two types of oligomers are strictly dependent on the GM1 content in the neuronal membranes they interact with. In fact, the conformers of Aβ42 with low solvent-exposed hydrophobicity (A–) increase their ability to disrupt the lipid bilayers reaching a toxic efficiency comparable to that of the high solvent-exposed hydrophobic species (A+) when the plasma membrane of the cells contains increased GM1 density. In addition, we show that GM1 modulates the affinity of Aβ42 oligomers to synthetic or natural cell membranes, as well as the ability of the oligomers to affect membrane lipid order and permeability, regardless of the oligomer type. This conclusion is confirmed and made more general by the substantially similar results obtained with two comparable types of HypF-N oligomers, suggesting a general mechanism independent of the protein sequence. These results indicate that all protein misfolded oligomers have a significant level of toxicity in appropriate environments; an ensemble of different oligomeric species can be present in tissue, each capable to damage neuronal cells with different efficiency depending on its biophysical features and GM1 abundance in the cell membrane. This is particularly relevant, considering that in this study we used an increased GM1 content comparable to that found in the neuronal membrane of aged people and of AD patients [2 , 37].
The affinity of protein aggregates for membrane GM1 was suggested to involve the negative charge of the sialic acid [63, 64]. Our results agree with these considerations; in fact, we showed that Aβ42 oligomers display an increased tendency to interact with SUVs as far as GM1 abundance is raised, supporting the idea that aggregate binding is not only driven by the presence of membrane protein targets [64]. The increase in GM1 content appears to affect clustering and enlargement of existing raft platforms, or to induce the formation of new ones [2]. This view agrees with our recent data showing a reduced mobility of GM1 molecules in GM1-enriched neuronal cells by Single Molecule Tracking (SMT) experiments [8]. Our data also agree with several reports indicating that the cholesterol content affects membrane physical features such as fluidity and GM1 clustering, hindering both aggregate recruitment at the cell membrane and membrane permeabilization [63, 65]. Overall, our results indicate that age-dependent clustering of membrane GM1 in neurons, a well-known alteration in the AD brain [3], can represent a risk for neurodegeneration in elderly people as a consequence of an increased ability of the lipid components of the bilayers to recruit membrane-permeabilizing oligomers without any involvement of specific receptors.
The molecular mechanism responsible for neuronal alterations induced by Aβ oligomers has also been associated with direct or indirect interactions with specific receptors and activation of specific signaling pathways [32, 66] and intra/extracellular perturbation of cell membranes [23]. Aβ oligomers have also been shown to interfere with NMDA-R and postsynaptic AMPA-R, affecting synaptic function, calcium influx, and a number of downstream cascades [13]. The idea that cell death in AD is associated with over-activity of NMDA-R provides part of the basis for the use of the low affinity activity-dependent NMDA-R antagonist, memantine, to treat this pathology [67]. In the present study, we show that both AMPA-R and NMDA-R, but not voltage-gated calcium channels, are involved in the early disruption of Ca2+ homeostasis induced by toxic Aβ oligomers (A+). In fact, the pharmacological inhibition of glutamatergic receptors transiently delayed Ca2+ influx induced by A11-positive toxic oligomers grown from two completely unrelated polypeptide chains such as Aβ42 and HypF-N. In addition, we show that A11-positive oligomers accumulate in proximity of glutamatergic channels more efficiently than their A11-negative conformers; however, a close proximity to AMPA-R and NMDA-R cannot be confirmed in our experimental conditions. This finding suggests that oligomers with high solvent-exposed hydrophobicity (A+ or type A for Aβ42 or HypF-N, respectively), unlike low solvent-exposed hydrophobic conformers (A- or type B for Aβ42 or HypF-N, respectively), promptly stimulate glutamatergic calcium channels without a close molecular interaction. A rapid decrease of NMDA-R responses could explain a minor involvement of these endogenous protein-channels at a later stage of cell exposure to the oligomers, considering that Aβ application to neurons has been reported to induce receptor endocytosis with loss of synaptic receptor [31].
In conclusion, our results indicate that cytotoxicity of protein misfolded oligomers is related to a more general mechanism involving the destabilization and disassembly of the lipid membrane within GM1-rich raft regions, causing an influx of Ca2+ ions from the extracellular to the intracellular environment, involving both protein and lipid components as far as the time of cell exposure to the oligomers is increased. This finding could explain why treatment of AD patients with memantine has resulted in mixed success in treating memory impairments and the progression of neurodegeneration [68]; it also sheds new light on the molecular determinants of protein misfolding and protein deposition diseases and expands the spectrum of molecular targets for therapeutic interventions against protein deposition diseases. Our findings support a main role for GM1 ganglioside in mediating the interaction of lipid bilayers with Aβ42 oligomers and support a mechanism of oligomer cytotoxicity involving bilayer destabilization by soluble oligomers within GM1-rich ordered raft regions. This evidence suggests that the cytotoxic effect of protein misfolded oligomers may not be exclusively related to a single mechanism of Ca2+ influx, but more likely to a collection of mechanisms involving membrane protein channels and lipid components.