
Abstract
Background:
Substantial studies have reported the prevalence and the affecting factors of subjective cognitive decline (SCD). The complaints screening scale has also been used for probing. However, little is known in China.
Objective:
To investigate the prevalence and risk factors of SCD, and explore an SCD complaints screening scale in China.
Methods:
Stratified cluster random sampling was conducted. 2,689 residents aged 60–80 years completed questionnaire 1. 814 residents were included for clinical and neuropsychological evaluations. Two standards were used to make the diagnosis of mild cognitive impairment (MCI) and SCD, and a preliminary screening rate comparison was carried out. Finally, we assessed the risk factors of SCD and the correlation between the SCD-questionnaire 9 (SCD-Q9) and the Auditory Verbal Learning Test-Long Delay Free Recall (AVLT-LR).
Results:
1) Standard 1 (ADNI2): the prevalence of SCD was 18.8% (95% CI = 14.7–22.9%) and zero conformed to six criteria (SCD plus). 2) Standard 2 (Jak/Bondi): the prevalence of SCD was 14.4% (95% CI = 10.7–18.1%). 3) Standard 1 had a relatively higher “false” positive rate, whereas Standard 2 had higher “false” negative rate. 4) Age, low education, fewer close friends, and daily drinking were independent risk factors for SCD progressing to MCI. 5) Total points of SCD-Q9 were negatively correlated to the value of AVLT-LR.
Conclusions:
The prevalence of SCD is high in the ShunYi District in Beijing, China. Age, low education, less social support, and daily drinking are independent risk factors. The brief SCD-Q9 can be used as a reference.
INTRODUCTION
In 2015, the World Alzheimer Report [1] showed that there are about 9.9 million new cases of dementia every year worldwide, and the expenditure on it has increased from US $604 billion in 2010 to US $818 billion in 2015. However, current treatment studies with new drugs against amyloid-β and tau pathology at the mild or moderate dementia stage of the illness have failed [2, 3], suggesting that treatment needs to be applied as early as the preclinical stage of the disease [4]. Subjective cognitive decline (SCD) as an earliest at-risk stage of Alzheimer’s disease (AD) was proposed by German scholar Jessen and colleagues [5] in 2014, and has received widespread attention [6 –8]. The phenomenon of the reported experiences of cognitive decline was initially described in 1982 [9], and has been later denoted as subjective cognitive impairment, subjective memory decline, subjective memory impairment, and memory complaints [10]. Different from the previous existing terminologies, the unified concept of SCD in 2014 considered SCD as a first symptomatic manifestation of AD in the preclinical stage of the disease, requiring the objective cognitive performance of these individuals to be within normal range besides their self-perceived cognitive decline. More importantly, individuals with SCD may present an onset of subtle cognitive decline, which does not warrant a diagnosis of mild cognitive impairment (MCI) or dementia, and this should not be caused by any psychiatric disorders or neurological and medical conditions (pre-MCI SCD). In addition, several specific features of SCD, such as age of onset of SCD >60 years, are associated with increased likelihood of preclinical AD in individuals with SCD (SCD plus).
An early study in 1995 reported that 25% of individuals had SCD in a community-dwelling sample of elderly aged 65–98 years in London [11]. Since then, several investigations on the prevalence of SCD before and after standardization for terminology in 2014 had been conducted. Depending on the various evaluation questions (using single question of perceived memory problem or evaluation using several questions), the definition of SCD (pre-MCI SCD or SCD in all stages of the disease), and the study population (community-dwelling or clinical population), a prevalence between 12.3 and 84.5% has been estimated [11 –18]. Among all these studies, only one study [15] has reported the prevalence of pre-MCI SCD, conforming with the SCD diagnostic framework unified in 2014 [5]. Until now, little is known about the prevalence of pre-MCI SCD in China. Moreover, since the definition of SCD was proposed in 2014 [5], the neuropsychological standards for normal cognition and the subtle cognitive decline accompanying SCD [19] have not been clearly defined. Nevertheless, two different neuropsychological standards for the definition of normal cognition and the subtle cognitive decline (the Alzheimer’s Disease Neuroimaging Initiative (ADNI) 2 standard and the more sophisticated neuropsychological standards— Jak/Bondi standard) have been tested in another context of AD research [20, 21]. To the best of our knowledge, no study has applied these two different standards when reporting the prevalence of pre–MCI SCD.
A previous study showed that people with SCD were younger and had higher education levels than patients with MCI and AD dementia [22]. It has been reported that women are more inclined to have SCD than men [18]. In addition, several risk factors, such as physical inactivity, smoking, hypertension, and depressive symptoms have been shown to be associated with increased occurrence of SCD [23, 24]. Individuals whose occupation required higher cognitive load were prone to SCD [25]. Aarts et al. [24] concluded that SCD and degree of concern was associated with multiple comorbidities, and varied with sex and age. Cerebral trauma, middle-aged obesity and hypertension, current smoking, and diabetes were risk factors of cognitive decline [26]. In China, marital status (unmarried and widowed), female, age, low level of education, poor physical health, passive emotion, lack of physical exercise, and born in undeveloped rural areas were risk factors for cognitive decline in the elderly [27, 28]. However, we knew little about risk factors of pre-MCI SCD.
Definition of SCD complaints has not been unified across different countries, and yet it is crucial for the early identification of SCD. A number of studies have demonstrated either weak associations [29, 30] or no association [31, 32] between SCD and objective memory performance. This might be due to the fact that the evaluation methods for SCD complaints varied between the studies [10]. To solve this problem, Gifford et al. [33] adopted the item response theory and the computerized adaptive test model and identified 9 reliable items for SCD screening (SCD-Q9). Rabin et al. [6] suggested that SCD entries should be used according to specific situation. They presented another 10 most frequently reported items after reviewing 19 international research studies from the SCD-Initiative (SCD-I). In order to make SCD quantifiable, Rami et al. [34] tested the validity of their SCD questionnaire with 24 items, and found it was a useful screening tool. There is a lack of comparison between these different tools, and we still need longitudinal data to further verify them. In China, an SCD complaints screening tool has not yet been investigated, and there is an urgent call for a quick and cost-effective approach to screen for SCD in our large population.
In the present population-based study, we conducted in-person clinical and neuropsychological evaluations for individuals aged 60–80 years and older residing in the ShunYi District of Beijing whose AD biomarkers will be further examined, to detect pre-MCI SCD by applying two different neuropsychological standards for the diagnosis. We report the prevalence of SCD and its risk factors, in addition to a pilot study conducted with respect to the SCD-Q9 in China.
METHODS
Ethics statement
This study was approved by the medical ethics committee of XuanWu Hospital of Capital Medical University, Beijing, China. Written informed consent was obtained from either participants or their legally acceptable representatives.
Study site and target population
The ShunYi District is located in the northeast part of downtown Beijing. Its jurisdiction covers 12 towns, 7 regional offices, and 6 sub-district areas— a total of 426 villagers committees, 85 sub-district areas committees, and contains 1.2 million permanent residents. There are about 80,000 permanent residents between the ages of 60 and 80 years according to the annual census of the registered residents in this district at the end of 2015.
For sample size estimation, Power Analysis and Sample Size software version 11.0 (PASS, 11.0) (NCSS, LLC, Kaysville, UT, USA) was used to calculate the sample size with the prevalence of SCD from 12.3% to 84.5%. Giving that the decreased rate of the population was expected to be 20% and the acceptable error value, a total 100-3,300 has been estimated for the range of the total number people for this study. Initially, the sample size was therefore expected to be 3,000. However, the decreased rate was higher than expected (especially in the sub-district area). Thus, we finally expanded the sample size and 4,878 individuals were included in the end, which went beyond the range size.
A stratified cluster random sampling design was used. As the result of the stratification, the proportion of population from the sub-district areas, regional offices, and towns for 60–80 years of age was 2:3:4. Therefore, we randomly selected 2 sub-district areas, 3 regional offices, and 4 towns. For those sub-district areas (regional offices or towns), we randomly selected 2 sub-district (or village) committees. If the response rate of village (sub-district area) was too low, we then conducted random sample selection once again. Ultimately, altogether 16 committees were selected (Xi Ying and Chen Zhuang of LiSui town, TaiPing Zhuang and Hou FengBo of NanCai town, Hou LiWu and Dong WuJi of Bei XiaoYing town, Nan Xin Zhuang Hu of BeiWu town, Zhao Ge Zhuang of Zhang town, Er Jie and Sha Ling of Yang town, Shi Jia Ying and Xi Feng Le of Ma Po town, Gang Shan of Tian Zhu regional office, Hong Cheng and Xi XinBei of Wang Quan sub-district area, Gang Yi and Gang Er of Shi Yuan sub-district area). The investigation period was from September to November in 2016.
Potential participants were excluded if they were (questionnaire 1): 1) incompetent (serious physical illness); 2) untraceable residents; 3) registered but died; 4) showed medical history of severe schizophrenia, moderate depression and anxiety, or other mental problems; 5) minority race; 6) living in a nursing home; 7) had been diagnosed of dementia. As a final step, eligible populations were drawn from sub-district areas (n = 1,344, more individuals was selected considering the response rate was lower compared with those from regional offices and towns), regional offices (n = 1,103),and town (n = 2,058), respectively, contributing to the a total number of 4,505 (Fig. 1).
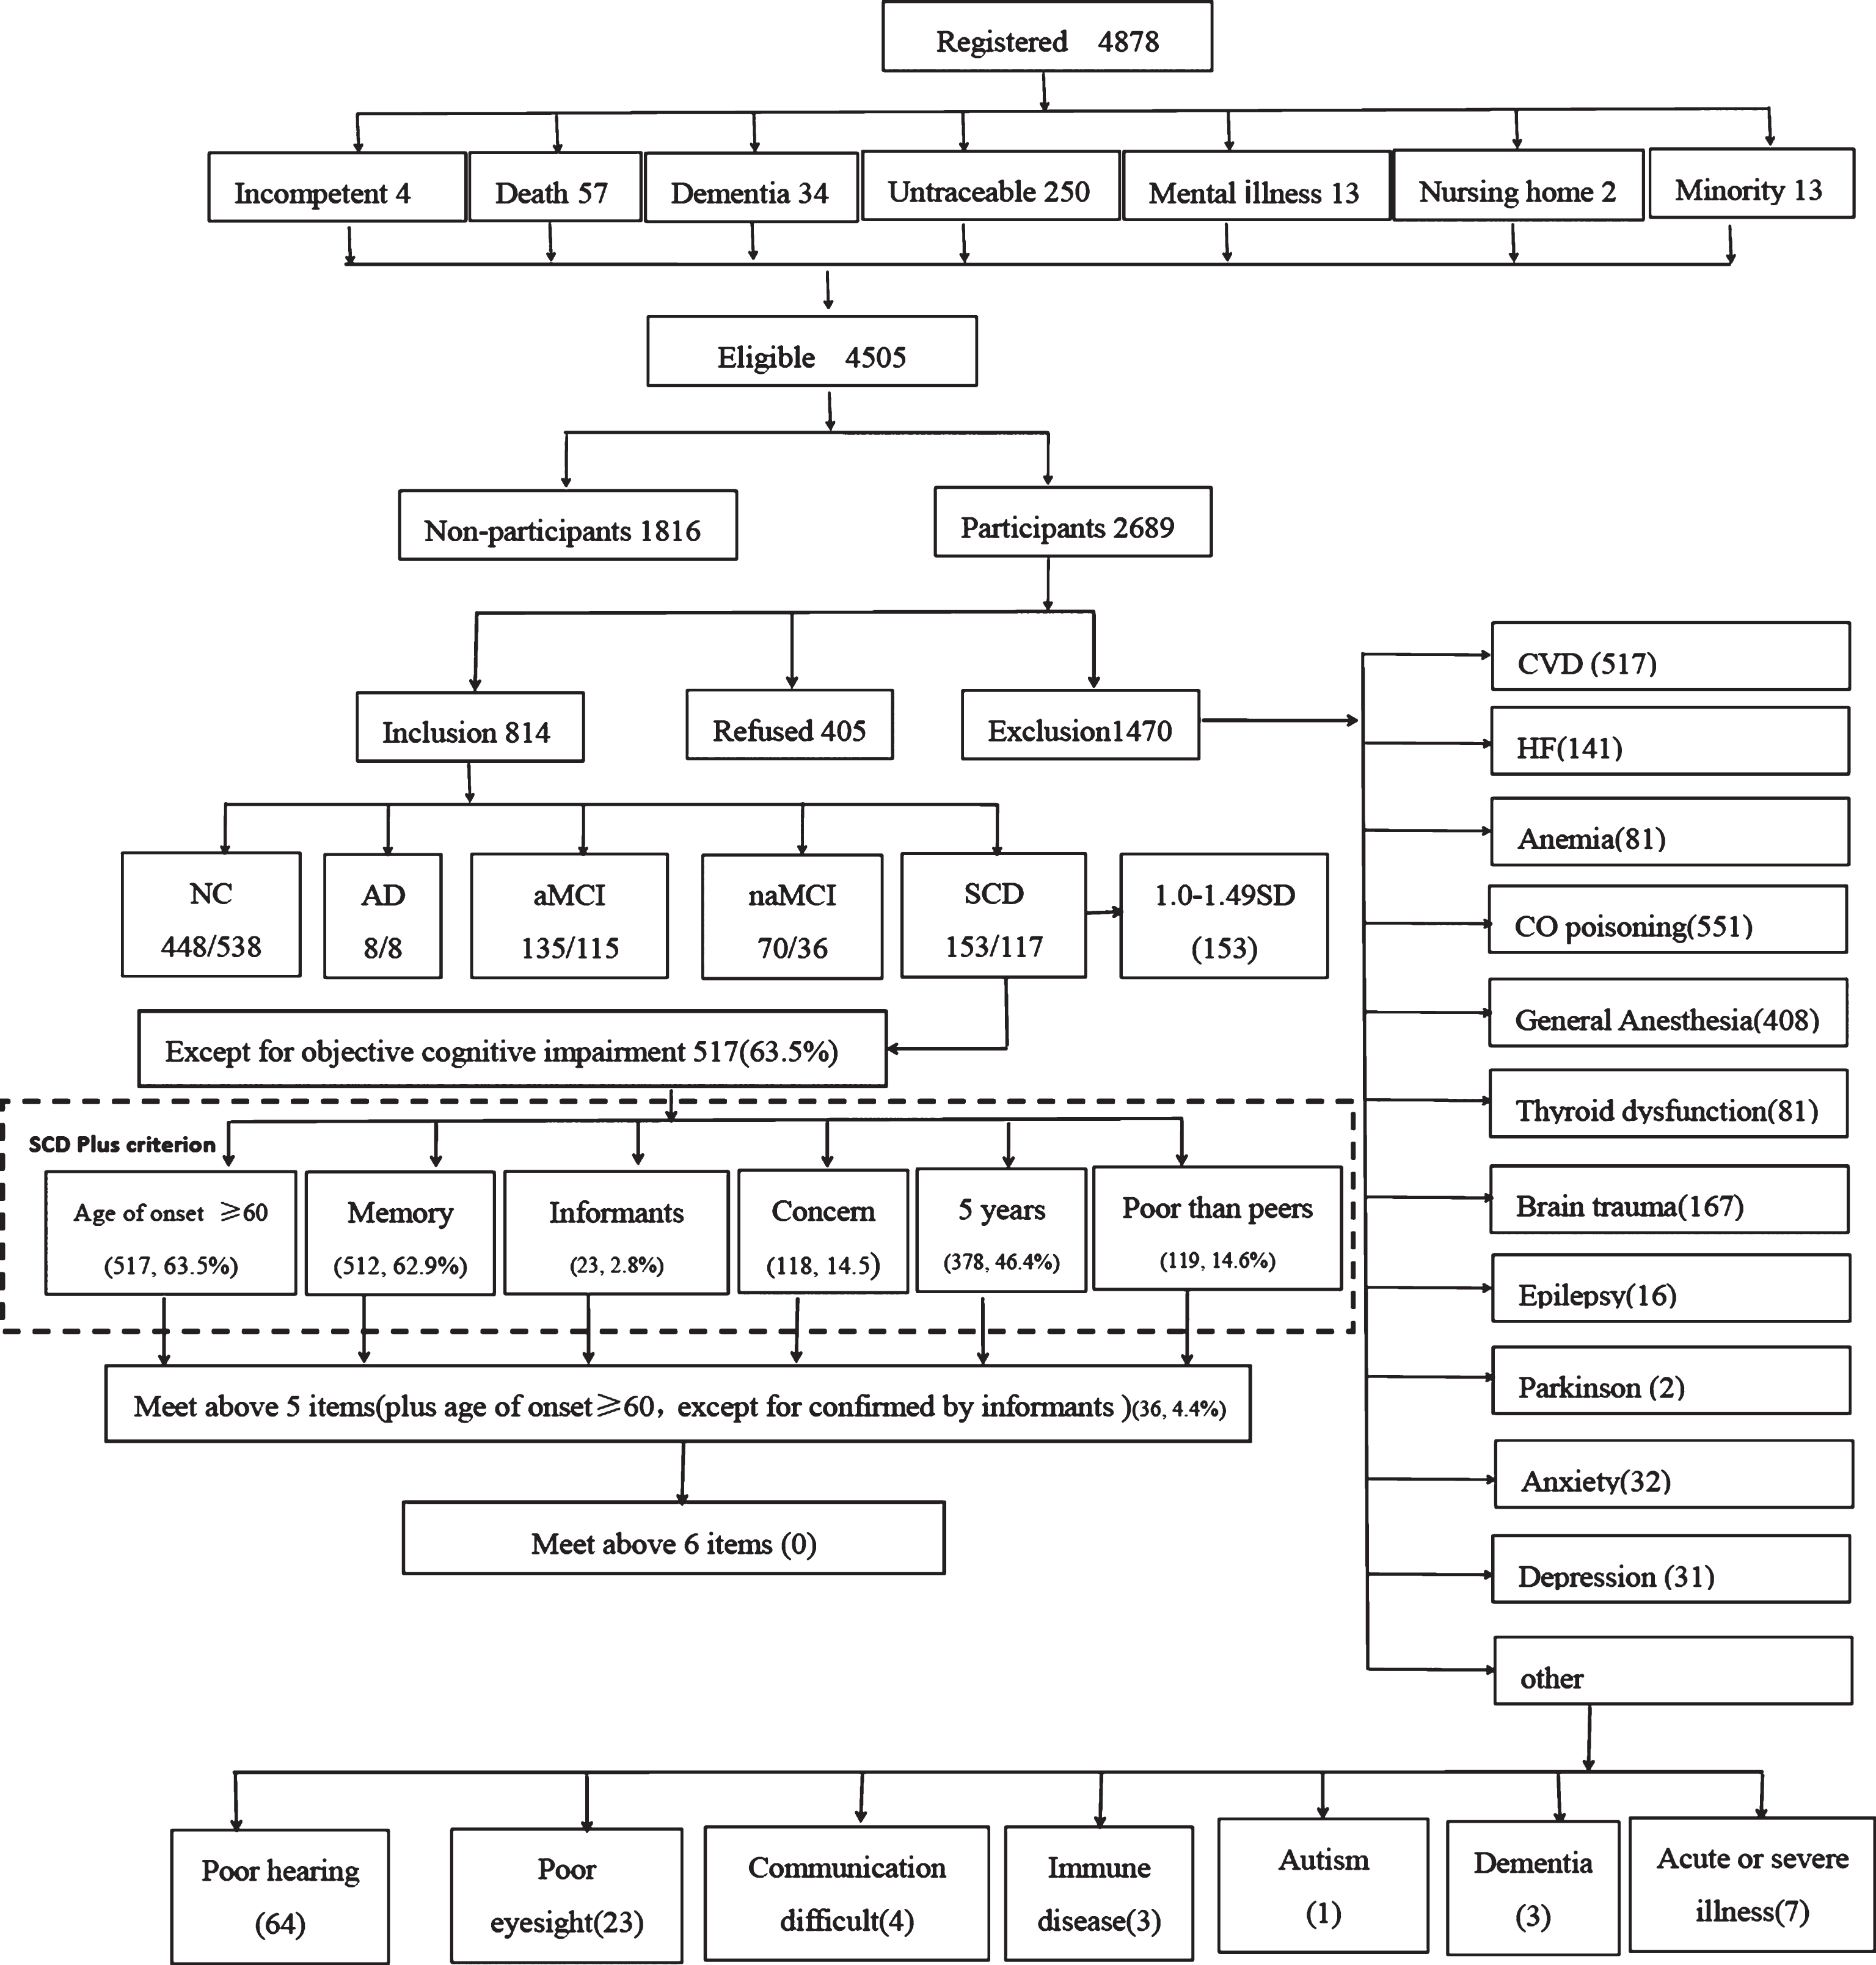
Among 4,878 registered residents aged 60–80 years old, 4,505 were eligible subjects, and 2,689 (60%) subjects participated in the study. After completing Questionnaire 1, 814 (67%) went on to complete Questionnaire 2 and 405 declined out of the 1,219 included subjects. aMCI, amnestic mild cognitive impairment; naMCI, non-amnestic mild cognitive impairment; SCD, subjective cognitive decline; AD, Alzheimer’s disease; NC, normal control; CVD, cerebrovascular disease; HF, heart failure.
Inclusion criteria: permanent residents (living in the target community for at least half a year) Han ethnicity, and 60–80 years old.
Exclusion criteria (questionnaire 2): 1) neurological diseases: cerebrovascular disease, encephalitis, brain tumors, brain trauma, epilepsy, Parkinson’s disease, and so on which could lead to cognitive decline; 2) metabolic diseases: anemia, thyroid dysfunction, lack of folic acid and vitamin B12; 3) a history of CO poisoning; 4) history of general anesthesia; 5) dementia; 6) acute or severe life-threatening illness; 7) severe problems of vision, hearing, or speaking, and not able to participate in the neuropsychological evaluation (Fig. 1).
Subject recruitment
Cadres of sample villages (sub-district areas) were centrally trained. They were required to be familiar with the purpose of this study and the specific operational procedures. Then the coordinators and cadres visited each resident’s house to explain the objective of this study, and asked for their consent to join the study. Those who agreed to join were informed of the specific research site and the time for a further telephone contact and broadcastings in advance. For the residents who had difficulties in movement, household surveys were performed.
As a result, 2,689 people (60% response rate) participated in the study (Table 2). The proportion of females was 56.5%, which was consistent with the proportion of females in the overall population (52.4%). However, significant sex difference has been found between the participants and the non-participants (p < 0.01) (Table 1). The participants were significantly younger than non-participants, with an average age of 67 (SD = 5.4) and 68 (SD = 5.9), respectively (p < 0.01) (Table 1). However, comparing the participants and non-participants of the included population who needed further neuropsychological assessment, we found that there was no significant difference in age composition between the groups (p > 0.05), and the proportion of male in the non-participant group (50.9%) was higher (p < 0.05) (Table 1).
Characteristics of study participants and non-participants (total eligible population/total included population)
Characteristics of the sample populations
Daily drinking, present daily drinking and stopped drinking within 10 year (regardless of alcohol type, more than 80% of people in this study drunk white wine, and red wine and only a minority of people drunk liquor); BMI, body mass index.
Assessment and diagnosis procedure
Most investigators were postgraduates of our research group and junior neurologists of XuanWu Hospital. A couple of volunteer investigators were recruited throughout the country (all were senior neurologists). Furthermore, we set up an expert panel that included two neurologists and two neuropsychologists with special expertise in cognitive impairment disorders. All interviewers and experts received consistent training on the neuropsychological assessment and diagnosis, and became qualified to participate in research when the inter-rater reliability exceeded 0.90 for cognitive tests and diagnoses coming out of face-to-face interviews.
Next, each subject was required to complete questionnaire 1, which includes information on sociodemographic characteristics, social support, medical history (cerebrovascular disease, hypertension, diabetes, cardiovascular disease, hyperlipidemia, anemia, CO poisoning, general anesthesia, thyroid dysfunction, brain trauma, epilepsy, etc.), lifestyle (smoking and drinking history), and the SCD-Q9 [33]. The Hamilton Depression [35] and Anxiety Scale [36] were administered to assess psychiatric symptoms. The neurological examination included assessments of the sensory neurons, motor responses, and reflexes of each participant. Informants information were also required regarding the cognitive complaints, medical history, and up-to-date mental status.
A comprehensive neuropsychological test battery which was designed to examine four cognitive domains was administered to each participant: 1) Memory: AVLT-H (Auditory Verbal Learning Test-Hua Shan), which was adapted from the California Verbal Learning Test, presenting 12 words over 5 trials, and the scores on immediate recall, short-delay free recall (5 min), long-delay free recall (20 min), and long-delay recognition were derived from Guo et al. [37]; the score on the five words-long-delay free recall was derived from the Montreal Cognitive Assessment-Basic (MoCA-B) (Hua Shan Hospital, Guo QiHao) [38]; 2) Executive function was examined by the Trail Making Test B (STT-B) [39], and the Clock-Drawing Test (CDT-30) [40]; 3) Language was examined by a Semantic Verbal Fluency Test (category, animals and fruits) [41]; and 4) Visuoconstructive skill was examined by the CDT-30. In addition, the MoCA-B was performed to assess the condition of global cognition. The cognitive and functional performance related to the clinical stages of dementia was assessed by the Clinical Dementia Rating Scale (CDR) [42]. The Activity of Daily Living (ADL) [43] was administered for the evaluation of social functioning. The Hachinski Ischemic Index (HIS) [44] was used to differentiate between degenerative and vascular etiologies. At the end of each workday, the expert panel and interviewers reviewed all data and assigned final cognitive diagnoses. When a consensus could not be reached, an expert returned to the residence the following day for further evaluation.
Participants were divided into the following categories: normal controls (NC), SCD, amnestic MCI (aMCI), non-amnestic MCI (naMCI), or AD dementia. Dementia was diagnosed according to the Diagnostic and Statistical Manual of Mental Disorders, fourth edition (DSM-IV) [45] criteria for dementia. Diagnosis for AD1 dementia according to DSM–IV criteria and required CDR = 1.
Two neuropsychological standards were applied for the classification of MCI, SCD, and NC. Standard 1 (ADNI 2 standard) [5, 46]: 1) NC was assigned when participants did not have SCD complaints and achieved a normal score (> –1.5 standard deviations (SD) cutoff) in all four cognitive domains and MoCA-B. Additionally, the CDR score needed to equal 0 in NC. 2) The criteria for diagnosing naMCI was as following: a) cognitive impairment in one or more domains (scored at least 1.5 SD below the norm in the fields of executive function, language, or visuoconstructive skill); b) global score of CDR was 0.5 or more; c) total score of MoCA-B lower than the cutoff; d) preserved ability to perform daily activities and social functions; and e) absence of dementia. 3) The criteria for diagnosing aMCI was similar to those for naMCI, except that aMCI needed to demonstrate impairment in the memory domain and the HIS score needed to be lower than 4. No other further separation for single- or multi-domains was needed for the diagnosis of aMCI and naMCI. 4) For SCD, there were the following requirements: a) the answer needed to be “yes” to the question “Do you have problem in memory?”; b) subtle cognitive impairment in SCD was defined as any of the cognitive performances within –1.0 and –1.49 SD; c) HIS score should be lower than 4.
Standard 2 (Jak/Bondi standard) [20] was different from Standard 1 in the diagnosis of MCI in that MCI was assigned when 1) scores of two measures in the same cognitive domain were >1.0 SD below normative mean; or 2) scores of at least one measure in each of the three cognitive domains (Memory, Execution, and Language) were >1.0 SD below the normative mean. For the diagnosis of aMCI, participants needed to demonstrate impaired cognitive domain in memory and a HIS score lower than 4, whereas naMCI needed to show dysfunctions in the domain of either executive function or language. But ADL in both groups had to be normal. For the diagnosis of SCD, the following requirements were needed: 1) the answer needed to be “yes” to the question “Do you have problem in memory?”; 2) subtle cognitive decline was objective in the neuropsychological examination, indicated by the impaired score (>1.0 SD below normative mean) on two measures in different cognitive domains; 3) ADL was normal; 4) HIS score was lower than 4. NC was assigned when participants did not have SCD complaints, did not reached the criteria for the diagnosis of AD dementia, MCI, or SCD, and had normal ADL scores.
Statistical analysis
We conducted all analyses using the Statistical Package for the Social Sciences version 17.0 (SPSS Inc., Chicago, IL). Descriptive statistics (sociodemographic characteristics, score of SCD-Q9, social support, comorbidities, etc.) of the research populations were calculated by percentages. The Chi-Square Test (χ 2 test) was used to assess group differences between sub-district area, regional office, and town populations. The proportion of NC and the prevalence of SCD, aMCI, naMCI, and AD dementia were then calculated with 95% confidence intervals (CI) in the corresponding populations. The crude prevalence was directly calculated by dividing the number of patients by the corresponding population. The age- and sex-specific prevalence was also calculated, respectively. Finally, using sex, age, education, occupation, body mass index (BMI), marital status, smoking, drinking, social support, comorbidities, and family history of dementia as the independent variables and diagnosis as the dependent variable, multiple logistic regression analyses with the removed backwards method were performed to examine the potential risk factors for each group. SCD population was used as the reference group for all the regression models. Odds ratios (ORs) were calculated for each variable, and a significance level of p < 0.05 was required for variable retention in the model. Finally, we analyzed the relationship between the total score of SCD-Q9 and the values of the Auditory Verbal Learning Test-Long Delay Free Recall (AVLT-LR) using Pearson correlation analysis.
RESULTS
Characteristics of the sample populations (total participants)
A total of 2,689 people participated in the study, including 621 in the sub-district area, 820 in regional office, and 1,248 in the town, close to 2:3:4.
Table 2 details the major characteristics of the study populations. Notably, significant differences in education and occupation were found in the participants from the sub-district area, regional office, and town (p < 0.01). More participants with fewer than 6 years of education lived in the town than in the sub-district area (p < 0.01). More than 88.5% participants living in the town were manual workers. Participants from the sub-district area obtained more social support than those living in the town (p < 0.01).
Characteristics of the sample populations (included participants)
A total of 814 people completed the neuropsychological assessment. Differences of characteristics shown in the total population, including current smoking, hypertension, and cardiovascular disease history in sub-district area, regional office and town disappeared (p > 0.05 for all) (Table 3).
Characteristics of the sample populations (included participants)
Daily drinking, present daily drinking and stopped drinking within 10 year (regardless of alcohol type, more than 80% of people in this study drunk white wine, and red wine and only a minority of people drunk liquor); BMI, body mass index.
Prevalence of SCD
Tables 4 and 5 show the crude and standardized prevalence of SCD, aMCI, and naMCI in the total, sub-district area, regional office, and town populations. According to two neuropsychological standards, the total prevalence of SCD, aMCI, and naMCI, was 18.8% (95% CI = 14.7–22.9%)/14.4% (95% CI = 10.7–18.1%), 16.6% (95% CI = 14.0–19.2%)/14.1% (95% CI = 10.5–17.7%), and 8.6% (95% CI = 5.7–11.5%)/4.4 (95% CI = 2.3–6.5%), res-pectively. These results indicate that the prevalence based on Standard 1 (ADNI2 standard) was higher than the one obtained with Standard 2 (Jak/Bondi standard). Cross-tabulation statistical analysis of the two standards showed that Standard 1 could screen out 76.8% NC, 35.0% SCD, 81.7% aMCI, and 100% naMCI in those diagnosed with Standard 2; and Standard 2 could screen out 92.2% NC, 26.8% SCD, 69.6% aMCI, and 51.4% naMCI of those diagnosed by Standard 1. Comparing the two standards, we found that the “false” positive rate was marginally higher in Standard 1, and the “false” negative rate was relatively higher in Standard 2. The two standards showed no significant difference in the crude prevalence of SCD in sub-district area (22.8%, 95% CI = 17.0–28.6% and 15.8%, 95% CI = 10.8–20.8%), regional office (19.5%, 95% CI = 14.5–24.5% and 12.6%, 95% CI = 8.5–16.7%), and town (16.1%, 95% CI = 12.3–19.9% and 14.8%, 95% CI = 11.2–18.4%) (p > 0.05). After adjusting for age and sex, the results showed that the sub-district area (22.3%, 95% CI = 20.3–24.3% /15.6%, 95% CI = 13.8–17.4%) had more SCD than those from town (13.9%, 95% CI = 12.6–15.2% /13.7%, 95% CI = 12.5–14.9%).
Crude prevalence (95% CI) of NC, SCD, aMCI, naMCI, and AD in the total, sub-district area, regional office and town by two standards
NC, normal control; SCD, subjective cognitive decline; aMCI, amnestic mild cognitive impairment; naMCI, non-amnestic mild cognitive impairment; AD, Alzheimer’s disease dementia (CDR = 1); S1, Standard 1; S2, Standard 2. Cross-sectional (%): The number of repetitions accounting for the total number diagnosed by Standard 1 and Standard 2.
Standardized prevalence of SCD, aMCI, naMCI, AD, and standardized rate of NC in the total, sub-district area, regional office and town by two standards
NC, normal control; SCD, subjective cognitive decline; aMCI, amnestic mild cognitive impairment; naMCI, non-amnestic mild cognitive impairment; AD, Alzheimer’s disease dementia (CDR = 1); S1, Standard 1; S2, Standard 2.
The age- and sex-specific prevalence of SCD, aMCI, and naMCI in the total population is shown in Fig. 2. aMCI and naMCI increased with age both in the total population and in the female group, noticeably in the 70–80 age group. SCD increased in the 60–69 age group, but decreased after the age of 69 in both sexes (Fig. 2).
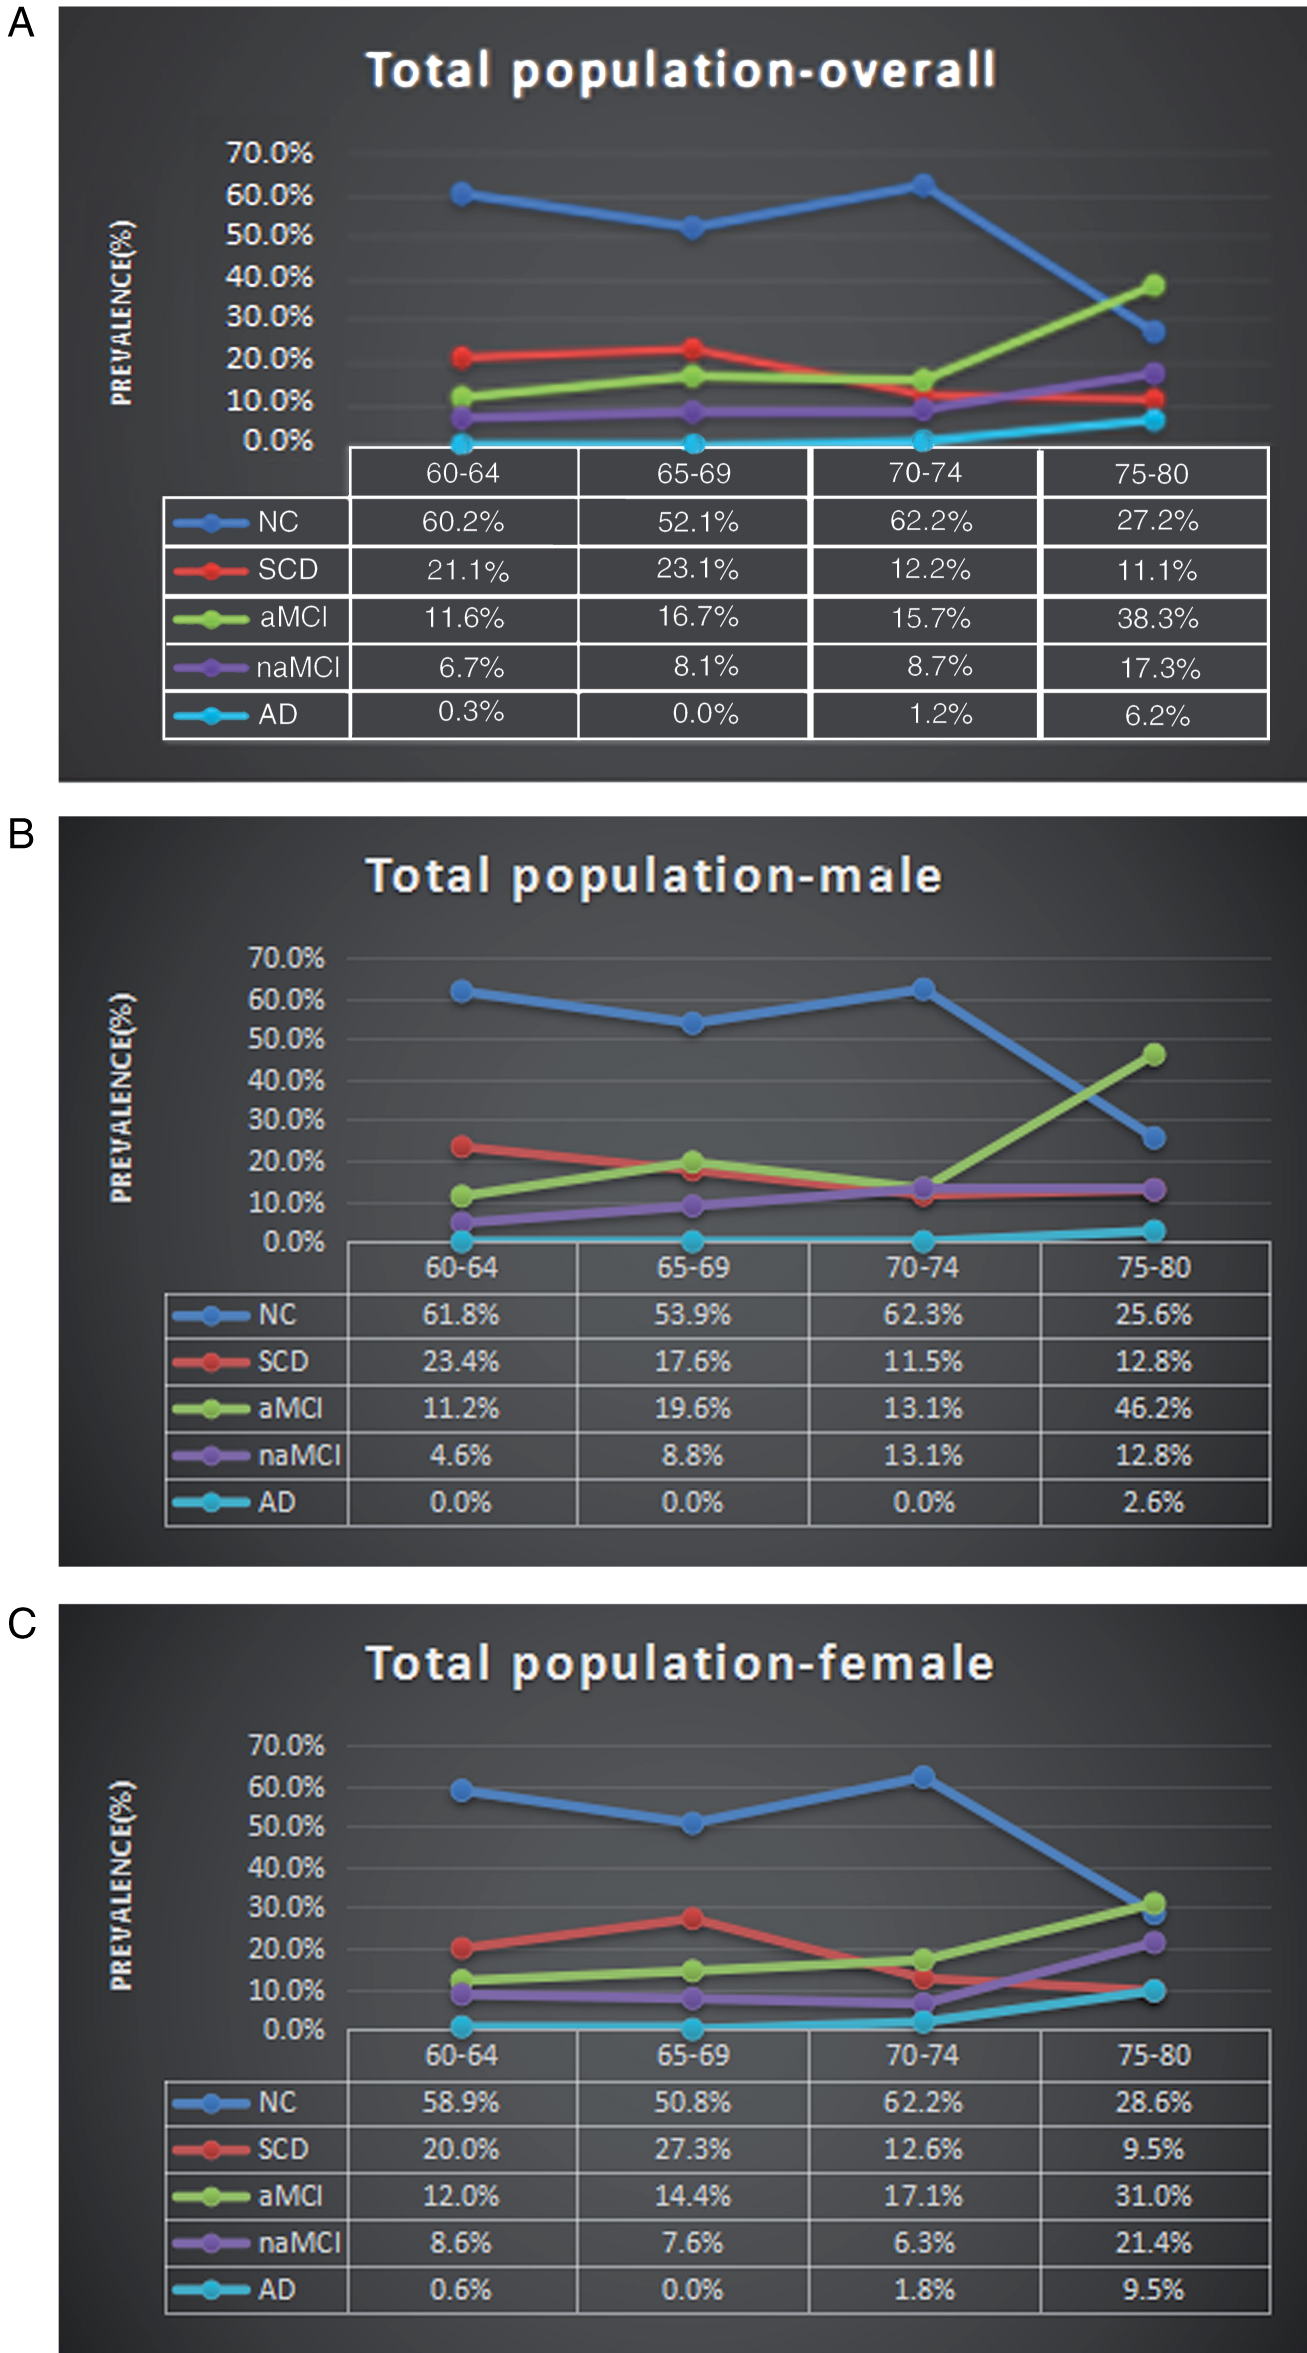
Age- and sex- specific prevalence of SCD, aMCI, naMCI, and the proportion of NC in the total population. The aMCI and naMCI increased with age in total population and in the female group, especially in the 70–80 age group. SCD decreased after the age of 69 in both sexes (A, B, C). NC, normal control; SCD, subjective cognitive decline; aMCI, amnestic mild cognitive impairment; naMCI, non-amnestic mild cognitive impairment; AD, Alzheimer’s disease dementia (CDR = 1).
We also compared the prevalence for different sex and age groups according to Standard 1 and Standard 2. Using Standard 1, the SCD prevalence in males was 18.1% (95% CI = 14.1–22.1%), lower than females at 19.3% (95% CI = 15.7–22.9%). However, the group difference was not significant (p > 0.05). When further dividing them into different age groups, the SCD prevalence in the groups of 60–64 and 65–69 were 21.1% (95% CI = 16.7–25.5%) and 23.3% (95% CI = 17.9–28.7%), respectively. These were significantly higher than the rates of the 70–74 (12.1%, 95% CI = 7.3–16.9%) and 75–80 age groups (11.1%, 95% CI = 4.3–17.9%) (p < 0.01). Based on Standard 2, the prevalence of females (17.4%, 95% CI = 13.9–20.9%) was significantly higher than males (10.5%, 95% CI = 7.3–13.7%) (p < 0.01). However, there were no significant differences between the different age groups (p > 0.05) (Table 6).
Prevalence and 95% CI for SCD among inclusion participants, by age and sex by two standards
SCD, subjective cognitive decline; S1, Standard 1; S2, Standard 2.
Affecting factors of SCD
(Standard 1) By using “diagnosis” as the dependent variable, “age, education, marital status, job category, BMI, medical history (hypertension, diabetes, coronary heart disease, hyperlipidemia), family history of dementia, life habits (current smoking and daily drinking), social support” as independent variables, and SCD group as the reference, we conducted a multiple logistic regression analysis. Several variables entered into the equation are listed in Table 7. Results show that age was significantly associated with greater odds of SCD progressing to aMCI and naMCI (p < 0.05), whereas higher education was identified as a protective factor (p < 0.05). Daily drinking accelerated the conversion from SCD to aMCI (p < 0.05), and less social support (number of close friends ≤2) was a risk factor for SCD progression (p < 0.01). Comparing to the other marital status (divorced, widowed, unmarried, remarried), “married” showed an agonistic effect of SCD developing (p = 0.055).
Logistic regression models for NC, SCD, aMCI and naMCI
NC, normal control; aMCI, amnestic mild cognitive impairment; naMCI, non-amnestic mild cognitive impairment; S1, Standard 1; Married*: p = 0.055.
SCD complaints
Approved by the developers of Gifford, we translated SCD-Q9 to Chinese and revised it. The reliability and validity of this revised version were measured as well. The Cronbach’s alpha of reliability was 0.847 and the coefficient of validity was 0.871, which showed that the translated version of SCD-Q9 used in this study is reliable.
Table 8 lists the items and results of SCD-Q9 in details. It shows that more than half of the elderly (60–80 years old) subjectively complained that their memory got worse, and the proportion of those reporting memory decline within 5 years was 82.3%.
Screening result of SCD-Q9 among the total participants
Figure 1 shows that the prevalence of pre-MCI SCD not defining subtle cognitive decline was 63.5%, among which 512 individuals reported memory decline, accounting for 62.9% of the total population. 14.5% of the total population reported concerns of cognitive decline. Almost half of the individuals complained about SCD within the past five years, and 14.6% of the complainers felt their performance was not as good as their peers, but only 2.8% were confirmed by the informants (SCD plus). The prevalence of fitting five of the SCD plus criteria (age of onset, memory, with concerns, within past 5 years, compared to peers) was 4.4%. Prevalence of meeting all SCD plus criteria was zero (Fig. 1).
The results of descriptive analysis showed that the score on the SCD-Q9 gradually increased as the disease progressed (NC⟶SCD⟶MCI⟶AD1). Using Pearson bivariate correlation analysis, we did not find any correlation between the total score on the SCD-Q9 and age (p > 0.05), but SCD-Q9 was significantly correlated with sex (r = 0.17, p < 0.01) and education (r = –0.137, p < 0.01). The score on the SCD-Q9 in males (3.90±2.78) was lower than that in females (4.85±2.60, p < 0.05). SCD-Q9 score and education were negatively correlated (r = –0.137; ≤6 years of education, 4.83±2.72; ≥7 years, 4.09±2.68) (Table 9). Additionally, there was a negative correlation between scores of SCD-Q9 and AVLT -LR (p < 0.01), which can described by a linear equation Y = –0.164X+5.091, where Y represents the score of SCD-Q9, and X indicates the values of AVLT-LR.
Total score of SCD-Q9 for NC, SCD, aMCI, naMCI, and AD by education
NC, normal control; aMCI, amnestic mild cognitive impairment; naMCI, non-amnestic mild cognitive impairment; AD1, Alzheimer’s disease dementia (CDR = 1).
DISCUSSION
To the best of our knowledge, the current study is the first to report the prevalence and relevant risk factors of SCD, which has defined subtle cognitive decline and SCD plus. Furthermore, it is also the first attempt to make a diagnosis of SCD and MCI using two neuropsychological standards. In addition, this is the first study that applied the SCD-Q9 to screen SCD in a large cohort of the Chinese population.
In our study, we found that the prevalence of SCD was high in the District of ShunYi in China. Our results showed that the prevalence was 18.8% (95% CI = 14.7–22.9%) (ADNI2 standard) and 14.4% (95% CI = 10.7–18.1%) (Jak/Bondi standard), whereas the occurrence rate based on the Jak/Bondi standard was relatively lower. According to the pre-clinical diagnosis framework of SCD which was developed by Jessen et al. in 2014 [5], 517 (63.5%) individuals demonstrated no impairment using the neuropsychological cognitive tests. This was consistent with the outcome of a study performed by Xiao et al. [16], whereby 62.9% of individuals reported decline in the memory cognitive domain. According to the SCD plus criteria, all participants were aged over 60 (inclusion criterion of this study), 46.4% of individuals reported onset of SCD within the last 5 years, 14.5% expressed concerns (worries) associated with SCD, and 14.6% felt that their performance was worse than their peers. However, the rate of having cognitive decline confirmed by informants was very low (2.8%). The proportion of fulfilling five of the criteria above (in exception the confirmation from informant) was 4.4%. The prevalence when all six criteria were met was 0. This is probably due to the reason that the number of informants who participated in this survey was few. In addition, this result may reflect that not all of SCD individuals conformed to AD pre-clinical diagnosis framework.
In view of the above, we applied Standard 1 and Standard 2, and the items of SCD plus that were not included in the two standards. In line with some previous studies [47, 48], complaint was defined by a single question, and our study did not restrict the period of memory decline, which was considered to be arbitrarily restricted within 5 years [5]. The difference in the two standards was the neuropsychological cutoff between normal cognition, subtle cognitive decline, and the objective cognitive deficits. Our results showed that the prevalence of SCD, aMCI, and naMCI according to Standard 2 was lower than using Standard 1 as the reference. This may be consistent with the aim of the Jak/Bondi standard to improve diagnostic precision, and to remove “false” positive cases [20]. Using Standard 1, SCD prevalence showed no statistical difference between males and females (p > 0.05). But using Standard 2, the prevalence of females was higher than males (p < 0.01). Age is a strong risk factor of the cognitive decline. The prevalence of SCD in the 60–69 age group of the total population and in the female group both support that SCD increases with age. Also, the prevalence of aMCI and naMCI shows the same effect of age, especially in the total population and in the female group of 60–80 years old. However, the prevalence of SCD decreased from 70 years of age. This might be explained by the following reasons: SCD is a phenomenon that occurs in the longitudinal course of AD. This means no or only a little SCD occurs in the very early phase of AD pathology. Then as the AD pathological processes to involve brain function, SCD appears. But at later stage, when anosognosia sets in, SCD disappears. This suggests that the sensitivity and the specificity of SCD for AD pathology are dynamic. In our study, beginning with age 70, the population of MCI gradually increased, and more and more SCD patient progressed to MCI, even to AD dementia. At this later stage, SCD disappeared. Mitchell et al. [49] reported that the conversion rate of SCD to MCI was 34.2% in the community-based population over the period of 5 years through review of 28 studies. The result of 21 studies showed that the conversion rate SCD to dementia was 10.79% over the mean period of 5 years. The annual conversion rate of SCD to dementia is 2.9% –11% [50 –53]. More elderly (≥70 years older) consider that SCD is a normal phenomenon of aging, rather than a problem. Although the SCD-Q9 scores increased with disease progression, the types of complaints varied among the different age ranges [19]. The memory complaints became more ubiquitous as individuals aged [54], but SCD without cognitive impairment became more diverse. The relationship between SCD and age is not yet conclusive. SCD-I only infers the likelihood of SCD associated with AD that increases with age [19]. Regarding the age–related SCD rate, the outcomes of two standards were also inconsistent, indicating that the two standards were not completely unanimous. This may be due to the reason that we did not define Standard 2 completely in accordance with the Jak/Bondi standard (i.e., our cognitive test did not include Boston Naming Test and STT-A).
However, we calculated the prevalence following Jak/Bondi by measuring the cognitive function quantitatively. The overlap of the two neuropsychological standards may provide some certain and important references to increase the diagnostic accuracy of SCD. In terms of area distribution, no statistical difference was identified using the two methods, which was not consistent with previous studies on dementia [55] and cognitive decline [28]. Possible reasons include: 1) although SCD prevalence has been reported, the risk factors of cognitive decline, such as cerebrovascular disease and so on also demonstrated area prevalence differences, which was eliminated in this study; 2) there has not been a clear boundary among the rural, urban, and the two integrated in the ShunYi District in Beijing, and thus we do not find area distribution difference of SCD prevalence; 3) the sample size is still relatively small, although the sample size (2,688 participants) in our study is comparable to or even larger than in some of the previous studies.
By analyzing and comparing the results of the two neuropsychological standards, we are still unable to make a conclusion of which standard is better; however, we find that Standard 1 has a relatively higher “false” positive rate, whereas Standard 2 has higher “false” negative rate. Since the scales are not designed completely following the Jak/Bondi standard, and it is not conclusive that CDT could replace STT, more amyloid-β–PET studies and follow-up data are necessary for making a final decision. We utilized Jak/Bondi to calculate the prevalence of SCD. This helped us to compare the two methods and establish a baseline for verifying the standard in the future. Due to the above reasons, we will use Standard 1 (ADNI2) in the following statistics.
We found that the previous reported prevalence of SCD ranged from 12.3% [14] to 84.5% [16] in which many studies did not rule out objective cognitive decline, except for the longitudinal German Study on Ageing, Cognition, and Dementia [15]. By now, the prevalence of SCD defined subtle cognitive decline has not yet been reported. Though our current study is exploratory, the prevalence of aMCI (16.6%, 14.1%) and naMCI (8.6%, 4.4%) are comparable to many previous studies [56 –58]. Therefore, this suggests that our design may provide a reasonable model for future studies on the prevalence of SCD.
Our results showed that higher education and young age were protective factors for SCD, and they could protect SCD from developing into MCI, which was consistent with numerous previous studies on cognitive decline [22 , 28]. To our surprise, we found that marriage is a contributing factor and being married (spouses living) was a protective factor versus other marital status (divorce, unmarried, widowed, remarriage). Although the p value was equal to 0.055, it revealed that there was a trend of difference between the aMCI and SCD group. There has been no study reported on pre–MCI SCD defined subtle cognitive decline, and this result complies with the studies of Deng et al. [27] and Ao and Liu [28] who reported marital status (singled, widowed) as being a risk factor for cognitive decline. The association between smoking and alcohol drinking and dementia has been shown in a few previous studies [59]. Several studies recently suggested that alcohol drinking in elderly people might contribute to impaired cognitive function [60, 61]. Zhou et al. [59] also reported that daily drinking increased the incidence of AD and vascular dementia in their 7–year follow–up study, which is consistent with our results. Loneliness increased the risk of developing dementia [62, 63], and more social isolation and loneliness were found in the AD group [64]. Our study also identified that having few close friends (≤2) is a risk factor for developing aMCI, indicating that social support must be considered.
So far, a screening tool for SCD continues to be a difficult problem around the world. Applying different screening tools might lead to different results from different studies. How to define the complaint and the cutoff of the objective cognitive decline is very important. Our study followed the standard of ADNI2 for the design of cognitive screening scales, which are in accordance with the definition of SCD by ADNI2, making the cutoff reasonable as well. Taking advantage of the ADNI2 standard, we conducted an exploratory study with respect to the definition of SCD complaints and its quantitative implementation. As SCD progressed, we found that SCD-Q9 scores also increased, which agrees with our expectation. Also, we found the level of education has a negative correlation with the SCD-Q9 score, which was consistent with previous studies [65]. In addition, our correlation analysis showed that this score was negatively correlated with the value of AVLT-LR, indicating that a simple scale might be used as the initial screen tool in primary care. This may be a crucially important step for generating a SCD screener. Finally, through screening, we found that 64.2% individuals reported to have different degrees of memory difficulty, which calls for an increase in medical and social concern.
Limitations
Our findings must be interpreted in light of some possible limitations. First, the relatively low response rate (60%) could lead to selection bias, but even lower response rate (31.8%) in regard to dementia and cognitive complaints has been reported previously [66]. The comparisons of the characteristics of participants and non–participants showed that those who refused to participate were older and had a higher proportion of male. Also, our participants were fewer than the non–participants in the 70–80th age group. Together with the small sample size, this may result in a crowd bias. Even though we tried to expand the sample size to eliminate the bias, many people still refused to participate in the research due to social concerns. Again, this reflects that SCD as the earliest stages of AD has not attracted people’s attention, especially in China.
It is well known that women are likely to develop dementia. However, the relationship between SCD and sex is controversial. Some studies reported that women were more prone to report memory complaints compared to men [65, 67], but the opposite has also been shown [68, 69]. We found no sex difference in the present study. Taking our result of the prevalence with age into account, the prevalence of SCD maybe overestimated. Given the fact that individuals living in nursing homes, where the occurrence of cognitive impairment is relatively high, were not included in the study, we might overestimate the prevalence of SCD as well. To overcome this issue, a standardized prevalence of SCD was calculated by adjusting sex and age.
In our study, morbidity was conceptualized based on the participants’ self–reports, which might compromise the validity of these data. Furthermore, our study results may not be generalized to the whole Chinese population since our sampling population was mainly from rural areas where the living conditions are worse than those in urban areas. Even though we have conducted a stratified sampling through living conditions, our findings may still overestimate the age-specific prevalence of SCD in China.
The final limitation is that this is a cross-sectional study design and the definition of SCD is only based on the diagnostic frame of pre-MCI SCD while eliminating other causes of the cognitive decline to make a clinical diagnosis. However, we have not obtained the data of AD biomarkers (e.g., Aβ–PET and Aβ1 - 42 in the cerebrospinal fluid) and some SCD individuals may not progress to MCI or AD dementia. Therefore, a longitudinal follow-up would be needed to make a more accurate diagnosis of SCD. A follow-up is also necessary to determine the long-term cognitive outcome for each patient group. The clinical assessments on all of the SCD patients need to be confirmed by other evidence such as PET, cerebrospinal fluid sampling, and gene examination.
Currently in China, conservatively estimated based on our study results, there are at least 14.4% elderly aging from 60 to 80 are living with SCD, most of them are at risk for developing dementia. Population–based prospective studies in China are needed to further examine the incidence of SCD, the progression rate and risk factors of the conversion from NC to SCD, from SCD to MCI, and even to AD. Noticeably, the common low response rates indicate that SCD has not raised enough public attention. Ultimately, the definite prevalence will need to be confirmed in our postmortem studies.
Footnotes
ACKNOWLEDGMENTS
This article was supported by the National Key Research and Development Program of China (2016YFC1306300), National Natural Science Foundation of China (Grant No. 31371007, 81430037, 61633018), grant from Beijing Municipal government (20170026), Beijing Nature Science Foundation (7161009), Beijing Municipal Science & Technology Commission (Z161100002616020), Fundamental and Clinical Cooperative Research Program of Capital Medical University (16JL-L08), Opening Foundation of Key Laboratory of Behavioral Science, Chinese Academy of Sciences, and Health and Family Planning Commission of ShunYi District Beijing.