
Abstract
Background:
Cerebral microinfarcts (CMIs) are small ischemic lesions that are a common neuropathological finding in patients with stroke or dementia. CMIs in the cortex can now be detected in vivo on 3 Tesla MRI.
Objective:
To determine the occurrence of CMIs and associated clinical features in patients with possible vascular cognitive impairment (VCI).
Method:
182 memory-clinic patients (mean age 71.4±10.6, 55% male) with vascular injury on brain MRI (i.e., possible VCI) underwent a standardized work-up including 3 Tesla MRI and cognitive assessment. A control group consisted of 70 cognitively normal subjects (mean age 70.6±4.7, 60% male). Cortical CMIs and other neuroimaging markers of vascular brain injury were rated according to established criteria.
Result:
Occurrence of CMIs was higher (20%) in patients compared to controls (10%). Among patients, the presence of CMIs was associated with male sex, history of stroke, infarcts, and white matter hyperintensities. CMI presence was also associated with a diagnosis of vascular dementia and reduced performance in multiple cognitive domains.
Conclusion:
CMIs on 3 Tesla MRI are common in patients with possible VCI and co-occur with imaging markers of small and large vessel disease, likely reflecting a heterogeneous etiology. CMIs are associated with worse cognitive performance, independent of other markers of vascular brain injury.
Keywords
INTRODUCTION
Cerebral microinfarcts (CMIs) are small ischemic lesions and a common neuropathological finding in patients with a history of stroke or dementia [1]. With the advent of high field strength MRI, cortical CMIs can now be visualized in living patients [2]. Recently it has been established that CMIs are also detectable on 3 Tesla MRI [3]. Despite the lower detection sensitivity, the widespread availability of 3 Tesla MRI scanners offers the opportunity to assess CMI burden in larger study cohorts. In two recent studies, assessing an Asian population-based and a memory-clinic cohort, CMIs were associated with worse cognitive functioning [3, 4]. These findings highlight CMIs as a clinically relevant imaging marker in vascular cognitive impairment (VCI). This study aims to determine the occurrence of CMI in patients with VCI at a memory-clinic compared to controls. The second aim is to identify the associated features of CMI presence among the patients, including vascular risk factors, other neuroimaging markers of vascular brain injury, cognitive performance, and clinical diagnosis.
METHODS
Population
The patients were selected from the Vascular Cognitive Impairment cohort of the University Medical Center (UMC) Utrecht [5]. The study cohort consists of 196 consecutive patients who received a standardized memory-clinic evaluation of the neurology or geriatric department of the UMC Utrecht between 2009 and 2013. For this study, analyses were carried out on 182 patients as 14 participants were excluded from analysis due to insufficient scan quality or lacking MRI sequences. All patients had evidence of vascular brain injury on MRI. Vascular brain injury was operationalized as white matter hyperintensities (WMH) on the Fazekas scale grade ≥ 2 [6]; or ≥ 1lacunar infarct(s); or ≥ 1 non-lacunar infarct(s); or ≥ 1 cerebral microbleed(s); or ≥ 1 intracerebral hemorrhage(s); or the presence of Fazekas scale grade 1 and an increased vascular risk defined as the presence of ≥ 2 vascular risk factors (hypertension, hypercholesterolemia, diabetes mellitus, obesity, current smoking, or self-reported history of a vascular event other than stroke, e.g., ischemic heart disease,peripheral arterial disease, or carotid artery stenting). The cohort includes patients with evidence of co-existing neurodegenerative disorders (such as Alzheimer dementia), in line with proposed VCI criteria [5]. Patients visiting the memory-clinic and proved to have vascular brain injury, but did not have objective cognitive impairment, were also included. We excluded patients with primary non-vascular/non-degenerative causes of cognitive dysfunction (e.g., brain tumors, traumatic brain injury) or psychiatric disease (other than depression). Patients with monogenetic (non-) vascular (e.g., NOTCH3) causes cognition dysfunction were also excluded.
The control group consisted of individuals that were recruited through general practitioners between April 2010 and June 2011 as part of the Second Utrecht Diabetes Encephalopathy Study [7]. We included all 60 individuals without diabetes from this case control study. We also randomly selected 10 subjects with type 2 diabetes mellitus from that study, to obtain a reference group with a diabetes prevalence representative of the Dutch population in this age group [8]. Exclusion criteria were a history of stroke and neurological or psychiatric disease that were likely to affect cognition.
Ethical approval was provided by the institutional review board of the UMC Utrecht. Informed consent was obtained from all participants prior to research related procedures.
Vascular risk factors
For all patients, the followings risk factors were identified. Hypertension was defined as present in medical history, use of antihypertensive medication, or current blood pressure above 140/90 mmHg. Hypercholesterolemia was identified based on medical history or use of cholesterol lowering medication. Diabetes mellitus was identified based on medical history or use of appropriate medication. Obesity was defined as a baseline body mass index (BMI) ≥ 30, calculated as weight in kilograms divided by height in meters squared. History of stroke was based on a history of clinical hemorrhagic or ischemic stroke. History of atrial fibrillation was based on a history (obtained from interview and screening of medical records) of paroxysmal and permanent atrial fibrillation and history of cardiac disease included myocardial infarction, congestive heart failure, atrial fibrillation or cardiac intervention (e.g., percutaneous coronary intervention).
MRI protocol and assessment of conventional neuroimaging markers
MRI scans of the brain were performed on a Philips 3 Tesla MRI scanner (Intera; Philips, Best, the Netherlands) with a scan protocol that included 3D T1-weighted images (TR/TE: 7.2/2.9 ms; reconstructed voxel size 1.0×1.0×1.0 mm3), 2D T2-weighted turbo spin echo (TSE) images (TR/TE:3194/14.0 ms; reconstructed voxel size 0.96×0.95×3.0 mm3), T2*-weighted (TR/TE: 1653/20 ms; reconstructed voxel size 0.96×0.95×3.0 mm3) and fluid-attenuated inversion recovery (FLAIR) images (TR/TE/TI: 11000/125/2800 ms; reconstructed voxel size 0.96×0.95×3.0 mm3). Scans were evaluated for medial temporal lobe atrophy (MTA) by visual assessment according to the Scheltens Scale for both hemispheres separately and averaged [9]. WMH was determined according to the Fazekas scale [6]. Both the presence and number of (non-) lacunar infarcts and microbleeds were rated based on the STRIVE criteria [10].
Rating of CMIs
The cortical CMIs were identified by visual inspection according to criteria that have been recently proposed by a group of international collaborators and previously validated [11, 12]. CMIs were rated on high resolution 3 Tesla MRI and had to be hypointense on 3D T1, hyperintense or isointense on 2D FLAIR/T2-weighted images, and isointense on T2*-weighted MRI; restricted to the cortex and ≤ 4 mm in the greatest dimension on T1. If on FLAIR/T2-weighted image, the lesion was substantially larger than 4 mm, the lesion was disregarded as the region was considered part of a larger infarction. CMIs had to be identified in at least two views of the brain (e.g., sagittal, transversal, coronal plane) and distinct from other structures and lesions such as arteries, veins, enlarged perivascular spaces, or microbleeds. Lesions neighboring a larger stroke (i.e., <1 cm in the same gyrus) were not classified as CMIs. Video instruction and methodological details on the detection and visual rating criteria of cortical cerebral microinfarcts on high resolution 3 and 7 Tesla MRI is available [11]. Figure 1 shows an example of a typical CMI in the cohort. Ratings took on average between 15–30 min per subject and were performed in MeVisLab (MeVis medical solutions, Bremen, Germany) by one trained rater (DF) blinded to the clinical condition of the subjects. With the applied criteria, DF had a good intra-rater agreement (test set 40 scans; intra-class correlation coefficient (ICC) = 0.95; Dice’s similarity index (DSC) = 0.63) and inter-rater agreement compared to another trained rater (SvV) (ICC = 0.99, DSC = 0.68).

Example of a CMI in the cohort. On the far left a T1 image of right hemisphere. The dotted area is enlarged showing the CMI in detail below (arrow) on T1, Flair and T2 (left to right).
Neuropsychological testing battery and level of education
A Dutch version of the Mini-Mental State Examination (MMSE) was used as a measure of global cognitive functioning [13]. The neuropsychological testing battery consisted of several tests covering four cognitive domains: 1) Memory using the Visual Association Test [14] and a Dutch version of the Rey Auditory Verbal Learning Test [15]. 2) Attention and executive functioning using the Trail Making Test part B and A (TMT-A, TMT-B) [16], the Stroop Color-Word Test part III [17] and verbal fluency [18]. 3) Processing speed using scores on the TMT-A, the Stroop Color Word Test I and II, and the subtest Digit Symbol of the WAIS-III. 4) Perception and construction using the Incomplete Letters and Dot Counting, which are two separate tests of the Visual Object and Space Perception Battery. Raw test scores of individual patients were standardized into z-scores (reversed z-scores for the TMT and Stroop Color Word Test) using mean and standard deviation within the study cohort. To create a domain score per patient the individual z-scores for the subtests of that domain were averaged and again standardized into z-scores for this cohort. Missing variables were not included in the formation of domain scores. Level of education was ranked according to the Verhage criteria, according to a 7-point rating scale [19].
Clinical diagnosis
As part of the clinical work-up, patients received a clinical diagnosis in a multidisciplinary consensus meeting. Mild cognitive impairment (MCI) was diagnosed when there was a decline in cognitive function from a prior baseline and impairment in at least 1 cognitive domain. Instrumental activities of daily living were normal or only mildly impaired [20]. Dementia was diagnosed is patients suffered a decline in cognitive function defined as a deficit in ≥ 2 cognitive domains at neuropsychological testing and interference in daily living [20]. Patients with dementia were further classified according to the etiological diagnosis based on internationally established diagnostic criteria. Alzheimer’s disease (AD) [21], vascular dementia (VaD) [22], or other (including frontotemporal dementia, Lewy body dementia, Parkinson plus syndromes, or unknown etiology). Patients with cognitive complaints but no objective cognitive impairment (i.e., a domain score below the 5th percentile on normative values) on the neuropsychological testing battery were classified as No objective cognitive impairment (NOCI).
Data analysis
Statistical comparisons between patients and controls, diagnostic subgroups, patients with and without CMIs were respectively analyzed with one-way ANOVA (for continuous normally distributed data), Mann-Whitney U tests (for non-parametric data) and χ-square tests (for proportions) including odds ratios.
A linear regression model was applied to investigate the relationship between CMI occurrence and cognitive functioning (Model I). Additional adjustments were made for age, sex, education (Model II), and age, sex, education, and other neuroimaging markers (WMH-score, MTA-score, (lacunar) infarcts, microbleeds) (Model III). All data analyses were carried out in IBM SPSS statistics (version 22) and a p-value <0.05 was considered significant.
RESULTS
Demographics and CMI occurrence in patients and controls
Patients and controls were similar with respect to age, sex, and education (Table 1). In the patient group 180 CMIs were found in a total of 37 subjects (20%). In the control group, 12 CMIs were found in a total of 7 subjects (10%). Patients had higher numbers of CMIs than the controls (p < 0.05). The spatial distribution of CMIs is plotted for both patients and controls in Fig. 2, showing a clustering in the pre- and postcentral gyri and middle frontal gyri in both hemispheres, possibly with a preference in watershed areas.
Characteristics of patient group and controls
Data are presented as means±SD, n (%), or median [range]. * p = 0.05, ± p < 0.05.
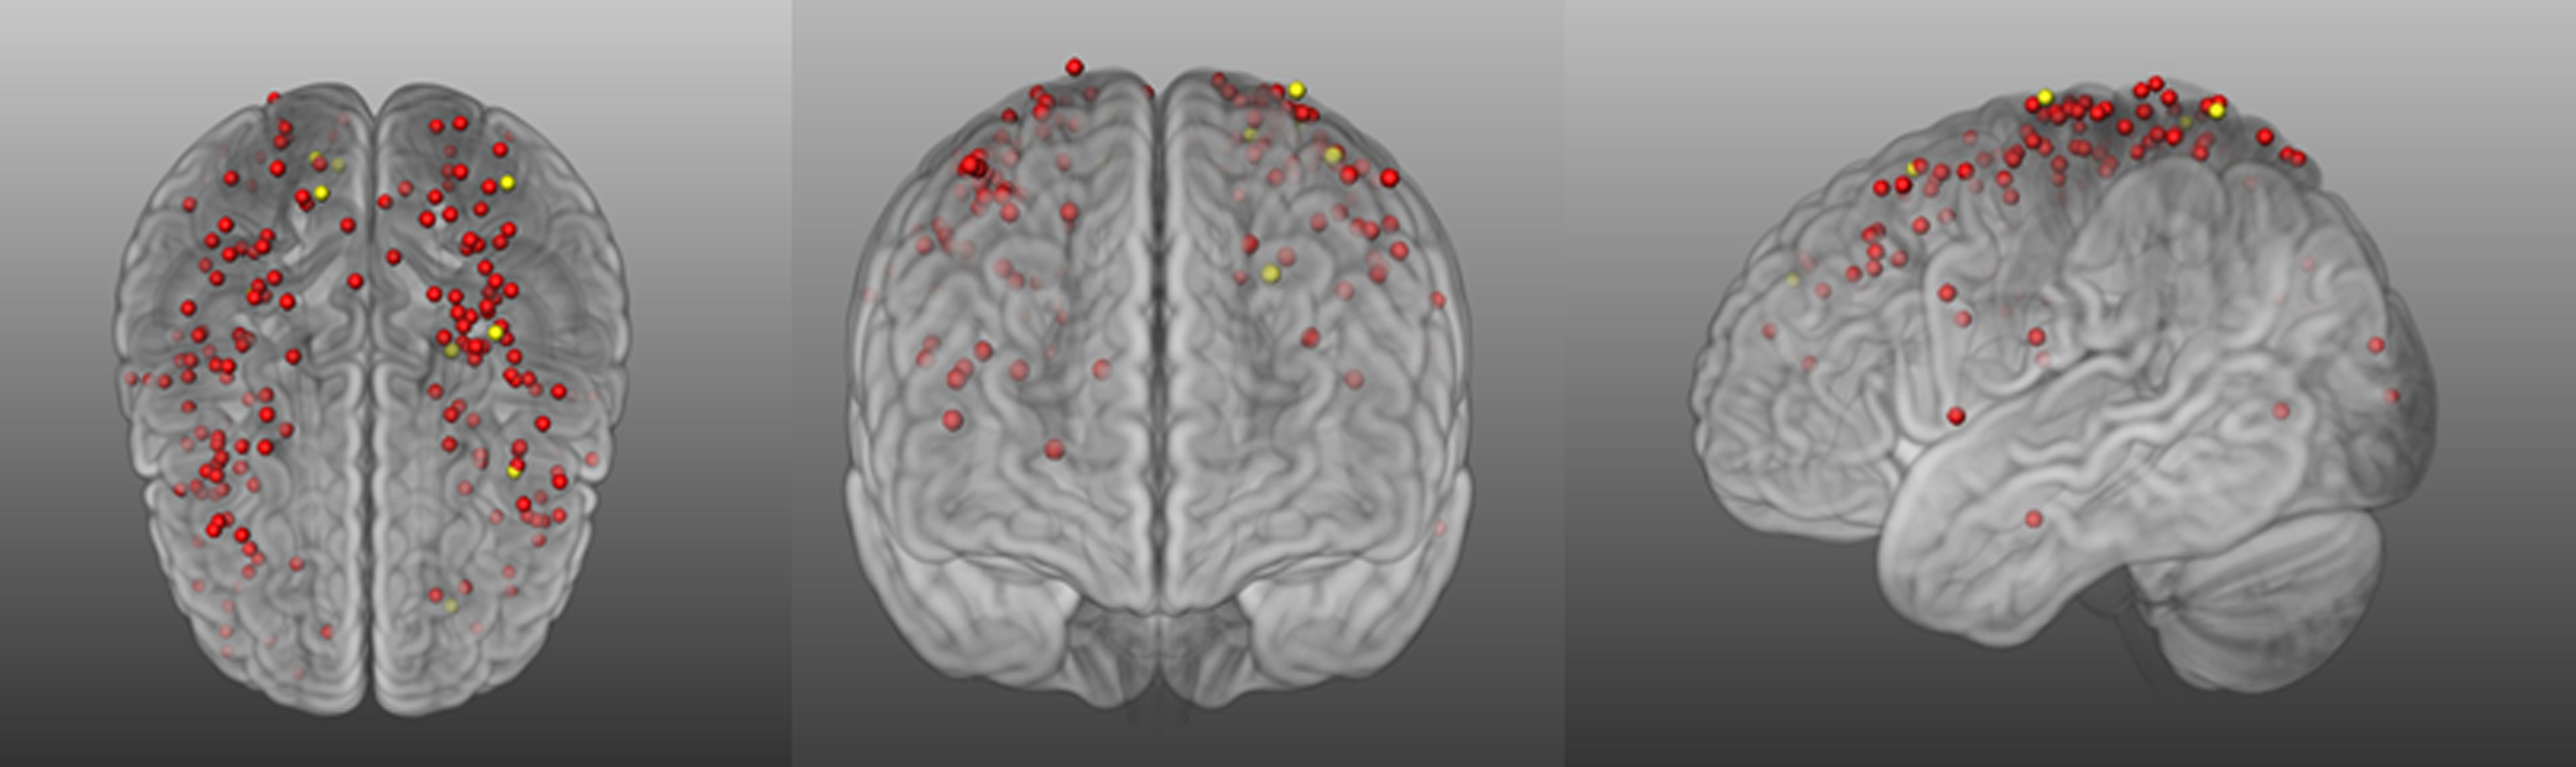
3D representation of the spatial distribution of CMIs across the brain in patients (red dots) and controls (yellow dots) in transversal, coronal and sagittal views (left to right). Map was configured by registering the CMIs to MNI152 standard brain.
Vascular risk factors and neuroimaging markers in patients with possible VCI
Table 2 shows the demographics, vascular risk factors, and neuroimaging markers in patients with and without CMIs. Patients with and without CMIs were similar with respect to age and education. Patients with CMIs were more likely to be male (OR 2.7, CI 1.2–5.9, p < 0.02) and to have a history of stroke (OR 4.1, CI 1.9–8.8, p < 0.001) than patients without CMIs. CMIs presence was also associated with more frequent occurrence of severe WMHs (OR 2.6, CI 0.99–6.7, p < 0.05) and infarcts (OR 7.01, CI 3.2–15.5 p < 0.001), but not with other neuroimaging markers.
Demographics, vascular risk factors and neuroimaging markersfor patients with and without CMIs
Data are presented as means±SD, n (%), or median [range]. ± p < 0.001; * p < 0.05.
Cognitive performance in the patients with possible VCI
MMSE scores were similar for patients with (25.7±2.9) and without CMIs (26.0±3.3). Table 3 presents the regression models of CMI presence on four cognitive domains in patients with possible VCI. CMI presence was associated with lower performance on cognitive domains attention & executive functioning and perception & construction, with a trend toward a slower processing speed (Model I). The association between presence of CMIs and cognitive domains was independent of age, sex, and level of education (Model II). After an additional adjustment for conventional neuroimaging markers, a significant association remained between CMIs and the domain perception & construction and a trend for attention & executive functioning (mainly due to widening of the confidence interval, rather than attenuation of effect size after adjustment).
Regression analysis of CMIs on cognitive performance
A&EF, Attention and executive functioning; PS, processing speed; P&C, perception and reconstruction. Model I: CMI presence on cognitive domain (z-scores). Model II: adjusting for age, gender and education. Model III: additionally adjusting for other MRI markers (WMH, MTA, (non-) lacunar infarcts, microbleeds).
Clinical subgroups in patients with possible VCI
The patient group was further categorized into clinical subgroups NOCI, MCI, AD, VaD, and other dementia. The clinical subgroups did not differ from each other with respect to sex, but patients were older in the AD (76.2±7.8), MCI (72.6±10.9), and other dementia group (71.4±9.1) than in the NOCI (62.3±8.9) and VaD group (61.6±9.4), p < 0.0001). The percentage of subjects with CMIs per clinical diagnosis is displayed in Fig. 3. There was a significant association between CMI occurrence and clinical diagnosis (p < 0.05). In particular, CMIs were more common in patients with a diagnosis of VaD compared to all other diagnoses combined (OR 5.4, CI 1.6–18.9, p < 0.005).
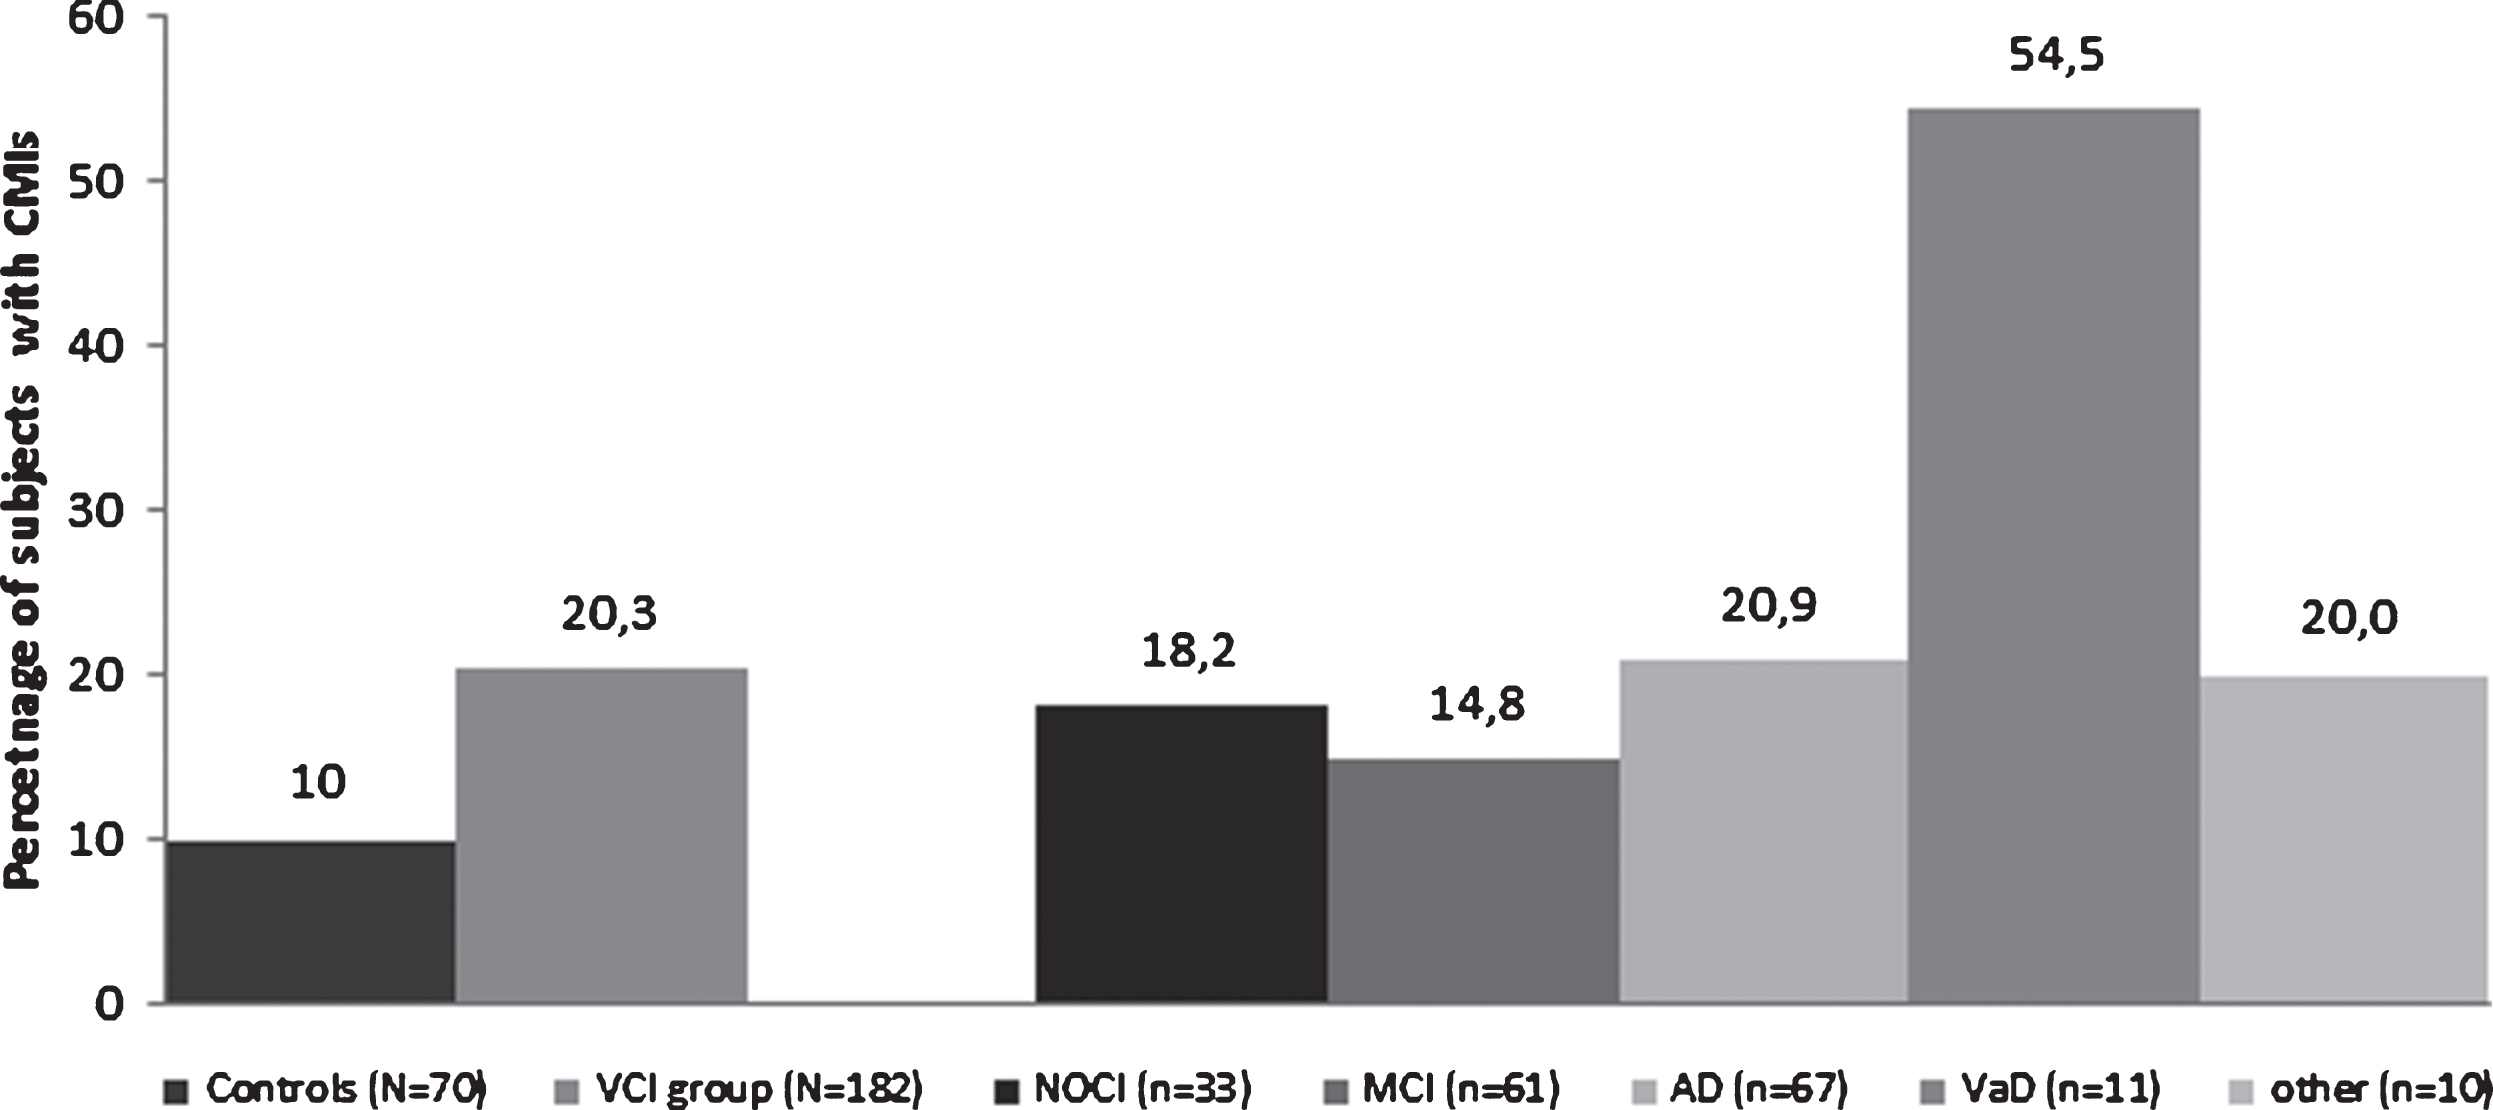
Percentage of subjects with CMIs in the controls and patients, as well as per patient clinical subgroups. NOCI, no objective cognitive impairment; MCI, mild cognitive impairment; AD, Alzheimer’s disease; VaD, vascular dementia.
DISCUSSION
CMI burden was higher in memory-clinic patients with vascular brain injury (20.3%) compared to controls (10.0%). Among patients, cortical CMIs were associated with male sex, history of stroke and the presence of both small vessel disease (SVD) and large vessel disease MRI markers. Moreover, we found that patients with CMIs had reduced performance in multiple cognitive domains and were more likely to have the clinical diagnosis VaD. These findings add to a growing body of research highlighting CMIs as relevant vascular imaging markers in cognitive impairment and dementia.
Over the last few years there is an emerging literature on CMIs detected with MRI. CMIs were found in 16–32% in a memory-clinic cohorts, 15% in an acute stroke cohort, and 6% in a population based cohort, which is in line with the 20% reported in our VCI cohort [3 , 23–26]. Our findings are also in agreement with a systematic review of pathology studies, concluding that the CMI burden is increased in cerebrovascular disease and dementia, especially inVaD [27].
In this study we only addressed cortical CMIs, because subcortical CMIs on MRI cannot yet be readily resolved from other lesions such as WMHs or enlarged perivascular spaces [11]. The preferential location of cortical CMIs is not yet firmly established. This study found a strong clustering of CMIs around the pre- and postcentral gyri and medial frontal areas in both hemispheres. Two previous MRI studies reported a predominance in parietal areas [3, 4],while in pathology studies a predilection for cortical watershed areas was shown [28]. Although there is interpersonal variation in the location of watershed regions, a majority of the CMIs displayed in Fig. 2 are indeed located in the watershed area between the middle cerebral artery and the anterior and posterior arteries.
CMIs were related both to markers of SVD and large vessel disease in this study, but not with classical vascular risk factors such as hypertension orhypercholesterolemia. Other studies have also found that CMIs were associated with intracranial atherosclerosis [4 , 29], microbleeds [23 , 30], and atrial fibrillation [25]. A recent pathology study suggested that etiology of CMIs might differ per brain location [31]. Taken together, these studies indicate that CMIs have a heterogeneous etiology in memory-clinic patients.
We found that CMIs were associated with worse cognitive functioning in multiple domains; perception & construction, attention & executive functioning, and possibly processing speed. The association with perception & construction was independent of other markers of vascular injury, which was also previously established in both MRI and pathology studies [3 , 32]. Perception & construction ability is linked to functioning of the parietal cortex, a location with a high density of CMIs in this study. Deficits in attention & executive functioning and processing speed are the core cognitive features of advanced SVD. At this stage, it is too early to link this cognitive profile to the lesion distribution as show in Fig. 2, also given the limited sample size. Moreover, it has been proposed that the functional impact of CMIs might also be determined by more widespread disruption of white matter networks [33]. Yet, lesion burden and location, and cognition relations in CMIs is an emerging area of research that requires further study.
The size of a single cortical CMI is most likely not sufficient to cause substantial cognitive deficits. It is not yet clear to which extent MRI visible cortical CMIs are accompanied smaller cortical and subcortical lesions. Hence, one cortical CMI on MRI could be indicative of a more widespread burden of hundreds or even thousands of smaller CMIs that escape detection on in vivo MRI. Evidence for this notion comes from two studies mathematically estimating total CMI burden, using the prevalence of acute CMIs detected with diffusion-weighted imaging [34] and pathology data [35]. These findings suggest that MRI visible CMIs may reflect a more widespread form of vascular brain injury.
Strength of this study is the availability of high quality imaging and cognitive data from a memory-clinic cohort with the full spectrum of vascular brain injury and cognitive impairment. This study also has some limitations. We used an unselected group of memory clinic patients with MRI evidence of vascular brain injury in our study, without prior selection of certain diagnostic subgroups or severity of cognitive impairment. Although this may benefit the generalizability of the results, the study population is heterogeneous due to this design. As a consequence, the CMIs in the cohort probably have different etiologies. This may be of prognostic relevance; however, due to limited sample size, this could not be further explored. Moreover, the cross-sectional design of this study limits the causal inferences can made regarding cognitive decline.
In conclusion, CMIs are common findings on 3 Tesla MRI in memory-clinic patients with vascular brain injury and a relevant vascular imaging marker in cognitive impairment and dementia.
Footnotes
ACKNOWLEDGMENTS
The authors would like to thank Hugo Kuijf for his support in image processing. We greatly acknowledge the use of MeVisLab.
Members of the Utrecht Vascular Cognitive Impairment (VCI) Study group involved in the present study (in alphabetical order by department): University Medical Center Utrecht, the Netherlands, Department of Neurology: E. van den Berg, J.M. Biesbroek, G.J. Biessels, M. Brundel, W.H. Bouvy, L.G. Exalto, C.J.M. Frijns, O. Groeneveld, S.M. Heringa, N. Kalsbeek, L.J. Kappelle, Y.D. Reijmer, J. Verwer,; Department of Radiology/Image Sciences Institute: J. de Bresser, H.J. Kuijf, A. Leemans, P.R. Luijten, M.A. Viergever, K.L. Vincken, J.J.M. Zwanenburg; Department of Geriatrics: H.L. Koek; Hospital Diakonessenhuis Zeist, the Netherlands: M. Hamaker, R. Faaij, M. Pleizier,E. Vriens.
The research of GJB is supported by grant 2010T073 from the Dutch Heart Association and Vidi grant 91711384 from ZonMw, The Netherlands Organization for Health Research and Development.
SJvV is supported by a Rubicon grant from the Netherlands Organization for Scientific Research [019.153LW.014].