



Abstract
Recent advances in neuroimaging technology have shown that rich club organization in human brain networks plays a crucial role in global communication and cognitive functionality. In this study, we investigated rich club organization within white matter structural brain networks in two common types of dementia, Alzheimer’s disease (AD) and subcortical vascular dementia (SVaD). We recruited 30 AD patients ([11C] Pittsburgh compound-B (PiB) PET positive), 39 SVaD patients (PiB negative), and 72 age-, gender-, and education-matched cognitively normal (CN) subjects. Rich club organization was significantly disrupted in both dementia patient groups, which exhibited higher rich club coefficients than the CN group. Rich club organization in the patient groups was primarily disrupted over the left frontal and left middle temporal areas when compared to the CN group. The number of rich club nodes was significantly reduced in the dementia groups, which was more severe in SVaD (p = 0.0107, permutation-based t-test). Although rich club organization was disrupted both in the patient groups, its disruption pattern is different between them. The rich-club connections normalized by degree-and-strength preserved random networks were significantly increased in the dementia groups with SVaD more severely, and feeder connections were reduced more significantly than in AD. Furthermore, SVaD patients exhibited more sporadic disruption in white matter connectivity than AD patients, with local connections showing a more significant degree of deterioration. Combined with the distinct disruption in rich club nodes, these findings may imply a differing role for rich club organization in AD and SVaD, due to different pathological mechanisms.
Keywords
INTRODUCTION
The onset of dementia causes a significant deterioration in quality of life with declines in cognitive domains including memory. Alzheimer’s disease (AD) is the most common cause of dementia, and is characterized by amyloid plaques and neurofibrillary tangles in gray matter [1, 2]. In contrast, subcortical vascular dementia (SVaD) is another distinct type of dementia that appears to arise from small vessel diseases (SVD) including white matter hyperintensities (WMH), lacunae, microbleeds, and micro-infarcts, mostly in the white matter [3–7]. Although they have different pathogeneses, both lead to disruptions in white matter connectivity [6, 8–10].
Recent advances in graph theoretical analysis of whole brain networks have revealed that a few central brain regions, referred to as ‘rich clubs’, are distinctly more interconnected than other regions of the brain [11]. This rich club organization plays a crucial role in global communication in the brain, and can be affected by various diseases [12–14]. A number of studies have investigated rich club organization in the white matter networks of dementia patients. Disrupted rich club organization has been observed in AD [14, 15], frontotemporal dementia [16, 17], and small vessel disease [18]. However, although rich club organization in two major forms of neurodegenerative dementia has been investigated separately [16, 17], little information exists regarding the differences in rich club organization between various dementia subtypes.
In this study, we investigated rich club organization in AD and SVaD patients. By selecting the pure AD patients and the pure SVaD patients through [11C] Pittsburgh compound-B (PiB) Positron Emission Tomography (PET) imaging, we investigated the distinct pathological effects of AD and SVaD to the rich club organization. We specifically hypothesize that patients with AD and SVaD harbor differing rich club organization compared to the cognitively normal (CN) subjects, as rich club organization is associated with cognitive function [19–21]. In addition, we postulate that the different pathogeneses of AD and SVaD may differentially affect the role of rich clubs within brain networks using our novel normalized analysis of the rich-club connections, feeder connections and local connections. This has led us to propose that the different pathological hallmarks of AD and SVaD are associated with distinct patterns of rich club organization in white matter structural networks.
MATERIALS AND METHODS
Participants
We recruited 39 patients with SVaD, 30 patients with AD, and 72 age-, gender-, and education-matched CN subjects at Samsung Medical Center (Table 1). All patients with SVaD were assessed between August 2007 and April 2011 and satisfied the diagnostic criteria for vascular dementia as determined by the Diagnostic and Statistical Manual of Mental Disorders, Fourth Edition (DSM-IV), and imaging criteria described for SVaD [5, 23]. The patients completed a clinical interview, neurological examination, and blood tests as described previously [24], and underwent standardized [11C] Pittsburgh compound-B (PiB) PET [25, 26]. We included only patients with pure subcortical vascular cognitive impairment whose global PiB uptake was under 1.5 [25]. Further details regarding PiB-PET including detailed radiochemistry profiles, the scanning protocol, and PiB-PET data analysis have been described in a previous study [25].
Patients with AD were assessed between November 2008 and November 2010, and fulfilled the criteria for probable Alzheimer’s disease proposed by the National Institute of Neurological and Communicative Disorders and Stroke, and the Alzheimer’s Disease and Related Disorders Association (NINCDS-ADRDA) [27]. We confirmed that all patients with AD were PiB positive. CN subjects were age-, gender-, and education-matched and recruited between January 2008 and August 2010. There were no histories of neurological or psychiatric illnesses, or abnormalities detected during neurological examination. The CN subjects were determined after undergoing both Mini Mental-State Examination (MMSE) and magnetic resonance imaging (MRI) scanning in their medical reports. The severity of all patients was evaluated with a widely-used clinical dementia rating sum of boxes (CDR-SOB) score, as well as the Korean version of MMSE [28, 29].
Subject demographic information
CN, cognitively normal; AD, Alzheimer’s disease; SVaD, subcortical vascular dementia; MMSE, mini-mental state examination. †Chi-squared test was used to compare gender and Kruskal-Wallis test to compare age, education years, and MMSE among groups.
The study was approved by the Institutional Review Board of Samsung Medical Center and written informed consent was obtained from all participants. Structured written consent procedures were used for those participants with cognitive impairment [22, 30]. Permission from next of kin was required for participation by subjects with cognitive impairment who were unable to provide informed consent themselves.
Acquisition of MR images
We obtained T1-weighted and diffusion-weighted images of all participants using a 3-Tesla MR scanner (Philips 3.0T Achieva) at Samsung Medical Center. T1-weighted MRI data was recorded using the following imaging parameters: 1 mm sagittal slice thickness, over-contiguous slices with 50% overlap; no gap; repetition time (TR) of 9.9 ms; echo time (TE) of 4.6 ms; flip angle of 8°; and matrix size of 240×240 pixels, reconstructed to 480×480 over a 240 mm field of view. In the whole-brain diffusion-weighted MRI examinations, sets of axial diffusion-weighted single-shot echo-planar images were collected using the following parameters: 128×128 acquisition matrix, 1.72×1.72×2 mm3 voxels; reconstructed to 1.72×1.72×2 mm3; 70 axial slices; 220×220 mm2 field of view; TE 60 ms, TR 7383 ms; flip angle 90°; slice gap 0 mm; and b-factor of 600 s/mm2. With the baseline image without diffusion weighting (the reference volume), diffusion-weighted images were acquired from 45 different directions. All axial sections were acquired parallel to the anterior commissure-posterior commissure line.
Network construction
As shown in Fig. 1, we constructed white matter networks from brain MR images as described in our previous studies [31, 32]. Networks are composed of nodes and edges, with nodes as anatomically distinct brain regions defined by an automated anatomical labeling (AAL) template [33], which contains 78 cortical regions and 12 sub-cortical structures. The edges are relationships between any pairs of brain regions quantified through tractography [34]. We used nonlinear registration between the AAL template and each individual’s diffusion-weighted image to define nodes. For each subject, we first linearly registered the T1-weighted image to the reference volume of the diffusion image using the FSL Linear Registration Tool (FLIRT) [35, 36] and nonlinearly to the International Consortium for Brain Mapping T1 template (ICBM152) in the Montreal Neurological Institute (MNI) space where the AAL template are defined using the FSL Nonlinear Registration tool (FNIRT) [37, 38]. We mapped the AAL atlas to individuals’ diffusion spaces using the inverse of the nonlinear transformation from T1 spaces to the MNI space, and the linear transformation from T1 to diffusion spaces, with the nearest neighbor interpolation method to preserve the discrete labels of the AAL atlas.

Overview of the methods used. A white matter connectivity matrix was obtained for each subject from MR images using deterministic tractography and the AAL atlas. We generated 1000 random networks for each subject to normalize the rich club coefficients, and for the rich-club, feeder and local connection analysis.
After the diffusion weighted images were corrected for eddy current distortions and head movements, we employed deterministic tractography using the diffusion toolkit [39]. We initiated fiber tracking from each of white matter (WM) voxels with following stopping criteria: 45 degree angle threshold and 0.2 fractional anisotropy (FA) threshold [40]. Multiple streamlines for each voxel were initiated similar to the previous rich club study, and 10 random seeds per voxel were used [41]. We then removed streamlines shorter than 20 mm to reduce tractography artifacts [42, 43]. Finally, we counted the number of streamlines between any pairs of nodes to define edges, resulting in a 90×90 connectivity matrix for each subject.
Rich club organization and coefficient determination
We computed a rich club coefficient for each subject using a method similar to previous descriptions [11, 44]. Specifically, for each threshold of nodal degree k in a defined range, we first removed the nodes with degrees that were less than the selected value of k in the network. We then referred the number of edges among the remaining nodes as E>k and the summation of their weights as W>k. The rich club coefficient of the weighted network, Φ
W
(k), is computed through the ratio of W>k to the summation of the weights of the E>k strongest edges of the entire network (i.e. the top E>k edges in the sorted weight values W
sorted
in descending order).
We then normalized the rich club coefficient by using 1000 degree-strength-preserved random networks [45]: the rich club coefficient for each subject was divided by the average value of the rich club coefficients from the corresponding random networks. The rich club coefficients were compared among three groups using a permutation-based analysis of covariance (ANCOVA), by adjusting for age, gender, and education years. We then used same ANCOVA and Bonferroni multiple comparison correction for pairwise comparisons.
We identified the rich club regime for which the rich club coefficient significantly exceeded one using a permutation-based one sample t-test and Bonferroni multiple comparison correction for post-hoc tests. In our experiments, we extracted the rich club nodes using a range of threshold values k. We then set the threshold at 23, as it was located in the center of the rich club regime for all three groups. The rich club nodes are the nodes whose degrees significantly exceeded the selected threshold [11]. We statistically determined the rich club nodes by confirming whether a certain node’s degree significantly exceeds the selected threshold using a permutation-basedone-sample t-test and Bonferroni multiple comparison correction for each group. Finally, for a comparison of the number of rich club nodes among three groups, we used a permutation-based t-test and Bonferroni multiple comparison correction.
Normalized analysis of rich-club, feeder, and local connections
We compared the rich-club connections (the sum of all weights between the rich club nodes), the feeder connections (the sum of weights between rich club nodes and non-rich club nodes), and the local connections (the sum of weights between the non-rich club nodes) between groups [11, 13]. The dementia groups exhibited a lower number of total connections and rich club nodes compared to the CN group. To account for the effects of disrupted connectivity and differing numbers of rich club nodes, we normalized the rich-club connections, the feeder connections, and the local connections using degree-strength-preserved random networks. Specifically, with the selected threshold of nodal degree for the rich club nodes, we identified the rich club nodes for each random network. We then computed the average rich-club connections, the feeder connections, and the local connections for the random networks. All the connection values were normalized with the corresponding average values. For group comparison, we employed permutation-based ANCOVA with covariates of age, gender and education years, along with pairwise comparisons with the same ANCOVA and Bonferroni correction [32].
RESULTS
Demographic and clinical information for the subjects is listed in Table 1. There were no significant differences in demographic information except for MMSE score (the two disease groups had mean values around 20 (AD: 19.4 ± 3.73SD, SVaD: 21.7 ± 4.52SD) while CN subjects had a 28.5 ( ± 1.40SD).
Disrupted rich club coefficients in dementia
Figure 2 shows rich club coefficients for the weighted white matter networks. All three groups exhibited rich club regimes with normalized rich club coefficients exceeding 1. The rich club coefficients for both AD and SVaD patients exceeded 1 for the lower threshold value k, when compared with the CN subjects (CN: 20, AD: 19, and SVaD: 18). This trend was similar to findings in a previous study which found that the rich club coefficients for AD patients were higher than the controls [14]. The CN group exhibited significantly different rich club coefficients for the disease groups, while the coefficients were not significantly different between disease groups. The rich club coefficient graph of the binary networks shared similar characteristics with that of the weighted networks (see the Supplementary Material for details of the binary network results).

Weighted rich club coefficients for CN (black circle), AD (red diamond), and SVaD (blue square) over different k levels of degree (normalized with those of degree-strength-preserved random networks). Solid markers represent points for which rich club coefficients significantly exceed 1 (permutation-based one sample t-test, Bonferroni corrected p < 0.05, CN > 20, AD > 19, and SVaD > 18 for weighted networks); otherwise the point is marked with an empty marker. Asterisks represent significant differences between the 3 groups.
Figure 3 shows the rich club nodes over various threshold values of k. In Fig. 3A, the number of rich club nodes were shown in the range of k from 18 to 26, where the asterisk represents the rich club regime for all three groups. The trends of decreasing number of rich club nodes were similar for all three groups: the disease groups had smaller numbers of rich club nodes compared with the CN group, and furthermore the SVaD group showed the smallest value over all rich club regimes. Figure 3B and 3C shows that the rich club nodes were consistently maintained over various threshold values of k when compared with the rich clubs extracted using the selected threshold value k of 23.
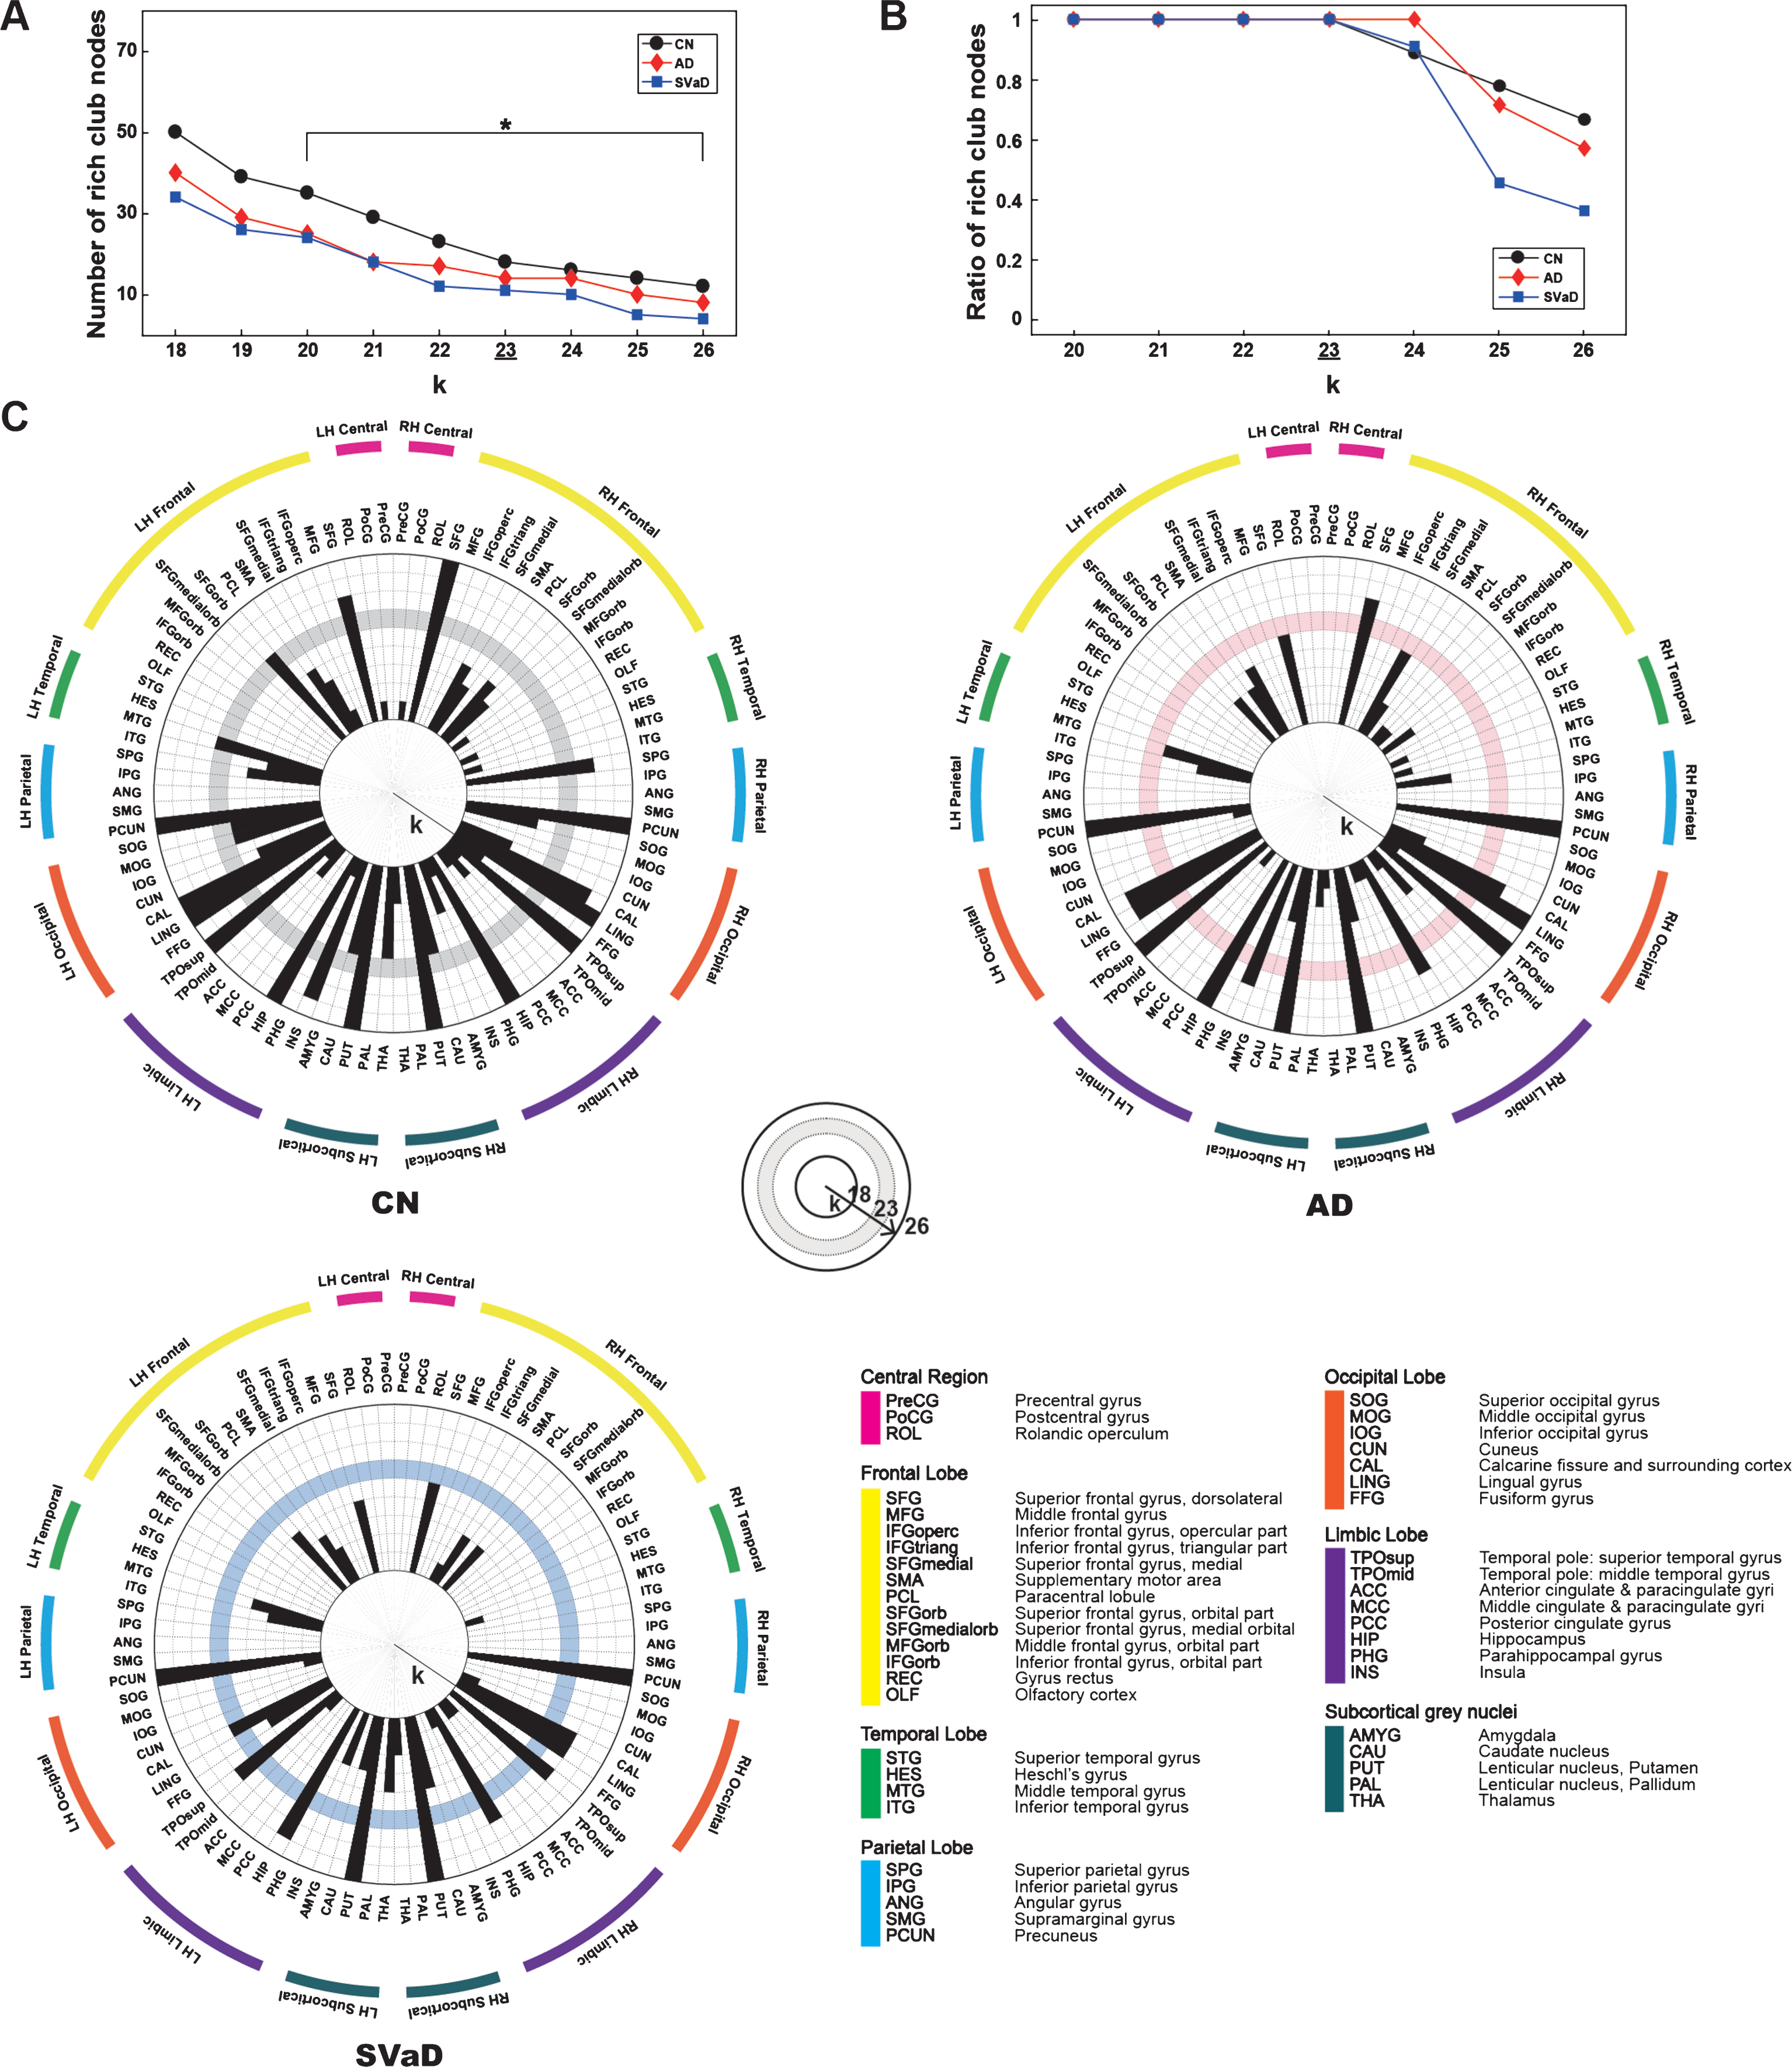
A) Number of rich club nodes over various threshold of k where the asterisks represent the rich club regime for all three groups. B) Consistency of the rich club nodes over various threshold of k where the y-axis represents the percentage of shared rich club nodes between the threshold value k of 23 and the other values. In A) and B), CN was denoted by black circles, AD did red diamonds, and SVaD did blue squares. C) Rich club nodes with the various threshold of k in the CN group, AD group, and SVaD group. The concentric circle showed different values of k and the shaded band showed the selected threshold of 23.
Reduced number of rich club nodes in dementia
We used an identical threshold of 23 to identify rich club nodes in each group. The number of rich club nodes in the disease groups was smaller than in the CN group (CN: 18, AD: 14, SVaD: 11, p = 0.0107, permutation-based t-test). Figure 4A shows the rich club nodes identified in the three groups, with the rich club nodes listed in Fig. 4B. The rich club nodes in the CN group included the precuneus, superior parietal, superior orbito-frontal, superior frontal, and subcortical regions including the hippocampus and putamen, which are commonly regarded as rich club nodes [11, 13]. AD patients had a lower number of rich club nodes, with the left superior orbito-frontal region, superior parietal region, left superior frontal region, left middle temporal region being excluded. SVaD patients exhibited an even lower number of rich club nodes than the AD patients, with the right lingual, left insula, and right superior frontal region more disrupted in SVaD than in AD.
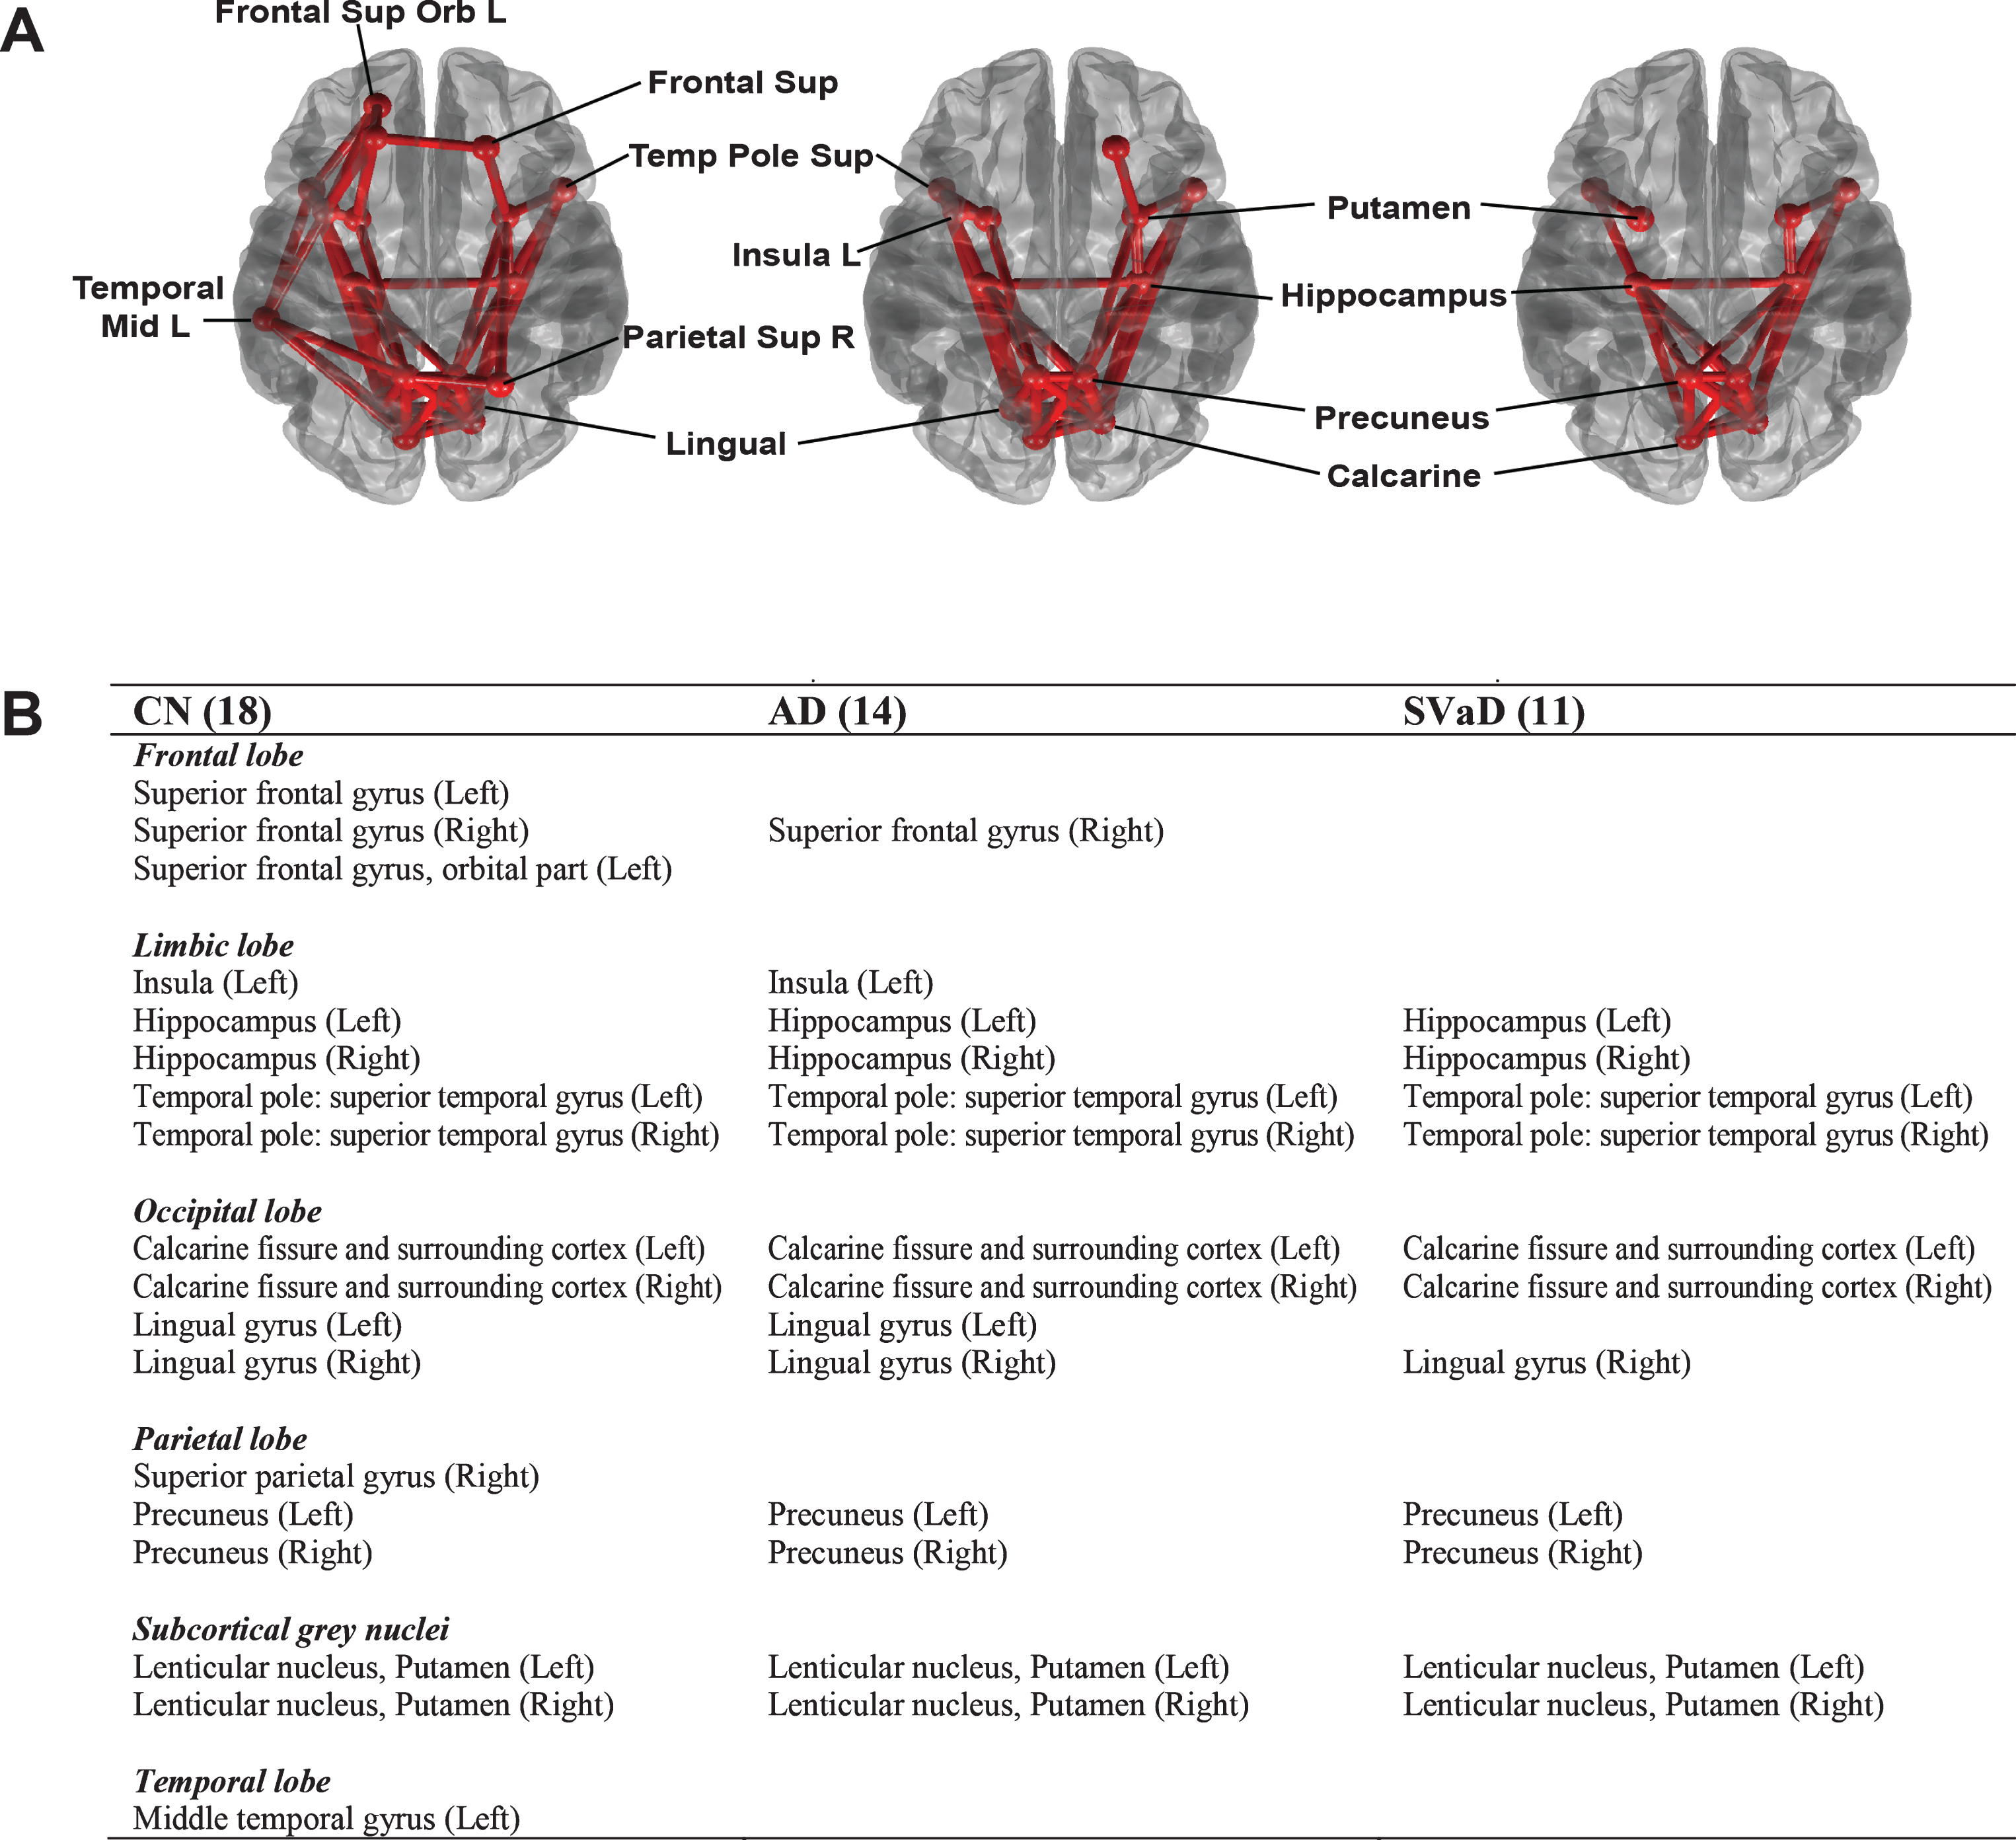
Rich club nodes with rich-club connections (A) and lists of rich club nodes (B) in CN, AD, and SVaD subjects at a degree threshold of k = 23. Circles represent the rich club nodes, and solid lines between them represent connections between rich nodes (rich-club connections).
Rich-club, feeder, and local connections in dementia
Figure 5 shows a comparison of rich-club, feeder, and local connections between groups. The normalized rich-club connections were significantly increased in the patient groups (p < 0.001, permutation based ANCOVA with the Bonferroni correction, all pairwise comparison were significant), while the normalized feeder connections were significantly reduced in the disease groups compared to the CN group (p < 0.001). The local connections were also significantly different between groups, with SVaD showing more disruption in the local connections than AD (p < 0.001). The details of the statistical results were listed in Supplementary Table 1.
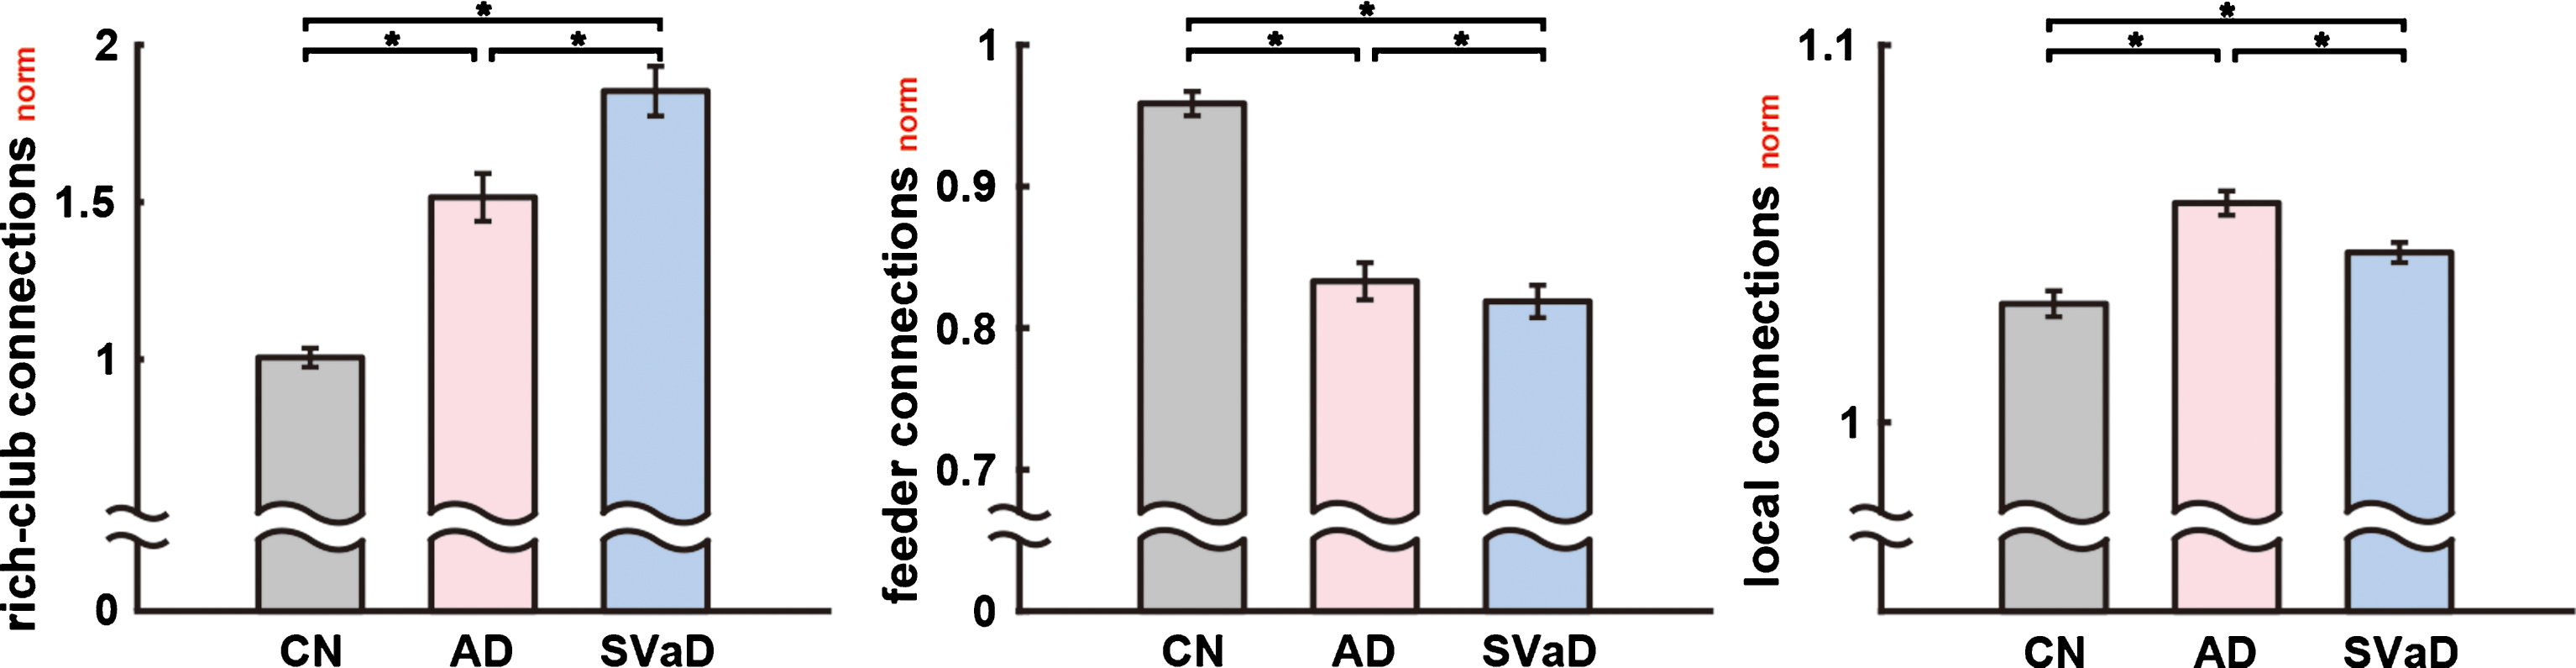
Normalized rich-club, feeder, and local connections in CN, AD, and SVaD subjects at the degree threshold of k = 23. Asterisks denote a significant difference between groups (as determined by permutation-based ANCOVA with covariates of age, gender, and education years, and the Bonferroni correction). The magnitude of each bar was corrected using ANCOVA controlling for age, gender and education years. The whiskers denote 2 standard deviations from the mean.
DISCUSSION
We observed that rich club organization in the dementia groups was significantly disrupted in comparison to the CN subjects. The rich club regime in dementia patients occurred with a smaller degree threshold than the CN subjects, consistent with previous findings in AD [14] and frontotemporal dementia [16, 17]. This could be merely due to an overall reduction in total connections, which may be associated with the lower average nodal degree. However, further analysis revealed that it is likely due to the distinct characteristics of SVaD and AD in terms of rich club organization.
The number of rich club nodes in the disease groups was smaller than in the CN subjects. As the rich club nodes were determined using the same degree threshold k for all groups (k = 23), the smaller number of rich club nodes may imply that the degree centrality of important brain regions (rich club nodes) are decreased in the patient groups, and thus their role in the network topology may be less influential in patients than in healthy subjects. One of the more notable regions is the superior parietal region, which was reported to be affected in the early stage of AD [46]. Moreover, recent studies of AD subtypes have shown that the hippocampal-sparing AD subtype (or parietal-dominant AD subtype) is associated with disruption of the parietal lobe and may lead to more severe symptoms [47–49].
SVaD patients exhibited the lowest number of rich club nodes. We found that the right superior frontal gyrus, left insula, and left lingual gyrus were further disrupted in SVaD, even compared to AD. These regions are known to be affected in patients with SVaD [50, 51]. The patients with subcortical vascular cognitive impairment (SVCI) have shown greater cortical thinning in the frontal, perisylvian, and lingual regions compared to AD patients [50, 51]. The superior frontal and insular regions form central executive [52] and salience networks [53], respectively. These two networks are thought to be responsible for neuropsychological deficits in the patients with SVCI [52, 54]. Specifically, the superior frontal gyrus is likely responsible for frontal executive function, which is an affected neuropsychological element in SVCI. Considering the important behavioral roles of the insular lobe [55], lesions within the insular lobe might be associated with maladaptive behavior such as the disinhibition, apathy, and obsessive-compulsive behaviors commonly observed in SVaD patients. Most studies involving neuropsychological evaluations of SVaD patients have focused on frontal/executive functions. However, a previous study [22] from our group showed that visuospatial dysfunction in SVCI patients might be related to disruptions in the middle and posterior portions of the superior longitudinal fasciculus which interconnects the medial posterior parietal lobe, cuneus, and lingual and fusiform gyri.
In our experiments, we showed that the number of rich club nodes is significantly smaller in the disease groups when compared with the CN group, while within the disease groups the SVaD patients had the smaller number of rich club nodes than the AD patients did. The reduced number of rich club nodes in the disease group may imply that some of the rich club nodes maintain stronger rich-club connections than the other rich club nodes, and those rich club nodes were survived even in brain networks of the disease groups. It is supported by the recent study of rich club organization in SVD [18]. They reported that a relationship between the number of rich club nodes and the rich-club connections was S-curved, implying that a few rich club nodes preserve their rich-club connections even in the SVD patients. In our analysis, the number of rich club nodes decreased as the threshold k increased (Fig. 3A). However, the rich club nodes at the threshold of 23 were consistently found with the larger thresholds (Fig. 3B, C).
It could be postulated that the reduced number of rich club nodes was simply due to disruption in the level of whole-brain white matter connectivity. Indeed, the sum of all weights of each group was smallest in the SVaD group, and the CN group had the largest value (CN: 3.5×10⁵ ± 4.0×10⁴, AD: 3.3×10⁵ ± 4.8×10⁴, SVaD: 3.2×10⁵ ± 4.1×10⁴). However, we note that the values were not different between AD and SVaD (p = 0.68, permutation-based ANCOVA, after Bonferroni correction), and only showed a declining trend in the AD group compared to the CN group (p = 0.099). In contrast, the numbers of rich club nodes were drastically different in the disease groups (p = 0.0107, permutation-based t-test), which may imply that the rich club nodes were more severely affected – further than mere random white matter disruption. This becomes clearer when the relatively low portion of rich-club connections over all connections are considered; in the CN group, the rich-club connections comprise only 7.0% of all connections. We believe this strongly supports the notion that the disruption of rich club organization is associated with distinct pathological hallmarks in the different dementia subtypes.
Further investigation of the rich-club, feeder, and local connections revealed a distinct role for rich club organization in AD and SVaD patients. Note that in our experiments we investigated the normalized rich-club, feeder, and local connections in order to remove the effect of reduced total connectivity in the disease groups. Since the total connectivity and the number of rich club nodes are different between the disease groups (Figs. 2 and 4), the original rich-club, feeder, and local connections could be affected by those factors. Indeed, because the number of rich club nodes in the patient groups was smaller than the CN group, the patient groups have reduced rich-club and feeder connections. The normalized analysis (Fig. 5), however, shows the adjusted results, which correct for these factors. The normalized results represent how strong those connections are, compared to the degree-and-strength preserved random networks. Thus, converse to the unnormalized analysis results, the normalized analysis showed that the patient groups have a significantly increased strength of normalized rich-club connections than the CN subjects, while the SVaD patients had even more normalized rich-club connections than the AD patients. This may imply that rich-club connections in the dementia group are more important than those in CN subjects. On the contrary, the normalized feeder connections were significantly decreased in the same order. In particular, the normalized local connections in SVaD were significantly lower than AD, which may imply that although disruption of the white matter networks in dementia affects the rich club nodes, disruption in SVaD is rather sporadic across the local connections which represent the majority of the connectivity (54.5% of the total connections in the CN subjects).
The normalized analysis also shed lights on the important role of feeder connections. In terms of the information flow, the role of rich-club connections can be compared with the role of highways in road networks; the information was delivered between rich club nodes with strong and long-range rich-club connections [56]. The feeder connections connect the highway to the local roads: to take an advantage of the rich club organization, the information should be delivered first to the nearest rich club nodes. In the disease groups, the normalized feeder connections drastically decreased compared to the CN group. This may imply that the role of feeder connection is more disrupted in the dementia group.
We note several limitations to our study design. First, we employed greedy deterministic tractography and thus cannot account for crossing fibers. Second, the number of subjects was small, considering the complexity of the analysis. However, our dataset is comparable to a previous study [16]; 42 AD subjects, and is the first to compare rich club organization in SVaD with that in AD and CN. Third, the heterogeneity of the SVaD patients may have caused slightly different results. Compared to AD, SVaD is a non-degenerative disease, and the affected white matter can be highly heterogeneous. In this context, the previous study of SVD also showed the two datasets had slightly different rich club nodes [18]. However, in this study, we sought to compare patients with a similar level of cognitive dysfunction, primarily in terms of rich club nodes. Fourth, the diffusion-weighted MR images used in this study were acquired with a b-value of 600, which could be relatively low for clear image contrast. Similarly in our previous publications using the same data sets, we conducted visual validation for each step of the image processingprocedures.
Our contribution is three-folded. First, our study is the first to compare rich club organization in SVaD with that of AD. Secondly, the thorough investigation postulated their distinct pathological effects on the rich club organization: distinctly affected rich club nodes (Figs. 2 and 4), and distinct composition of rich-club, feeder, and local connections (Fig. 5). Lastly, since the difference in the number of the rich club nodes between groups disables the previous method for investigating composition of rich-club, feeder, and local connections, we suggested a novel normalized analysis to fairly compare them between groups. The proposed normalized comparison method revealed the following key observations: The increased role of the rich-club connections in the dementia groups may cause the increased rich club coefficients. The role of feeder connection is severely compromised in the dementia groups. The distinct changes in the local connections between the dementia groups may be due to their distinct pathological hallmarks.
Conclusion
Our findings show that rich club coefficients in subcortical vascular dementia imply a different disruption pattern than in AD. Rich club organization was disrupted in the dementia groups in terms of rich club coefficients, rich club nodes, and rich-club connections. The dementia groups exhibited distinctly disrupted white matter networks, and the rich club nodes, rich-club connections, feeder connections, and local connections were different in the dementia groups. However, the dementia group exhibited a higher strength on rich-club connections when compared to the other WM connections. While the disruption of rich club organization was different between AD and SVaD patients, further analysis would be beneficial, for example, a study associating the differently disrupted rich club nodes and specific cognitive function in the dementia groups.
Footnotes
ACKNOWLEDGMENTS
This research was supported by the Bio & Medical Technology Development Program of the National Research Foundation of Korea (NRF) funded by the Korean government, MSIP (2015M3A9A7029725), by Brain Research Program through the National Research Foundation of Korea (NRF) funded by the Ministry of Science and ICT (2017M3C7A1048092), by the Ministry of Education of the Republic of Korea and the National Research Foundation of Korea (NRF-2015S1A5B6036594), by the Basic Science Research Program through the National Research Foundation of Korea (NRF) funded by the Ministry of Education of the Government of the Republic of Korea (2016R1D1A1B03934990) and by ICT R&D program of MSIP/IITP (R7124-16-0004).
