
Abstract
Background:
Alterations of intrinsic networks from resting state fMRI (rs-fMRI) have been suggested as functional biomarkers of Alzheimer’s disease (AD).
Objective:
To determine the diagnostic accuracy of multicenter rs-fMRI for prodromal and preclinical stages of AD.
Methods:
We determined rs-fMRI functional connectivity based on Pearson’s correlation coefficients and amplitude of low-frequency fluctuation in people with subjective cognitive decline, people with mild cognitive impairment, and people with AD dementia compared with healthy controls. We used data of 247 participants of the prospective DELCODE study, a longitudinal multicenter observational study, imposing a unified fMRI acquisition protocol across sites. We determined cross-validated discrimination accuracy based on penalized logistic regression to account for multicollinearity of predictors.
Results:
Resting state functional connectivity reached significant cross-validated group discrimination only for the comparison of AD dementia cases with healthy controls, but not for the other diagnostic groups. AD dementia cases showed alterations in a large range of intrinsic resting state networks, including the default mode and salience networks, but also executive and language networks. When groups were stratified according to their CSF amyloid status that was available in a subset of cases, diagnostic accuracy was increased for amyloid positive mild cognitive impairment cases compared with amyloid negative controls, but still inferior to the accuracy of hippocampus volume.
Conclusion:
Even when following a strictly harmonized data acquisition protocol and rigorous scan quality control, widely used connectivity measures of multicenter rs-fMRI do not reach levels of diagnostic accuracy sufficient for a useful biomarker in prodromal stages of AD.
INTRODUCTION
Today, early diagnosis of Alzheimer’s disease (AD) in prodromal and dementia stages is supported by the detection of disease characteristic biomarkers, such as amyloid accumulation or tau pathology [1–3]. In addition, people in prodromal or clinical at risk stages of AD such as people with mild cognitive impairment (MCI) [4] or subjective cognitive decline (SCD) [5] show characteristic pattern of metabolic decline in cortical areas belonging to cortical functional networks, particularly the default mode network [6], in 18FDG-PET studies [7–10]. In comparison to 18FDG-PET, functional MRI during resting state (rs-fMRI) is more widely available, less costly and has no radiation exposure. A large range of studies has shown that seed based as well as data driven analyses can reveal distinct intrinsic connectivity networks, including the default network, based on low frequency resting state fluctuations of the blood oxygenation level dependent signal (BOLD) (for review, see [11]). The BOLD signal is considered a measure of neuronal activity, similar to FDG-PET metabolism, and intrinsic connectivity networks from rs-fMRI have been suggested to carry diagnostically useful information in MCI and AD dementia [12]. However, the coupling between neuronal metabolism and activity and the oxygen extraction fraction, the physiological driver of the BIOLD signal, is complex, varying with blood flow, cerebral pathology, and activity [13]. Thus, findings on the accuracy of group discrimination based on rs-fMRI between prodromal and dementia stages of AD and healthy controls vary even between monocenter studies [14–17].
A step further in the evaluation of rs-fMRI as a diagnostic tool is the assessment of the multicenter stability of this measure across different scanners. In healthy people the pattern of functional connectivity was found to be affected by different scanners [18–21]. Studies on the effect of multi scanner variability on the diagnostic value of rs-fMRI in AD are still scarce. In a previous study using retrospectively collected multicenter rs-fMRI data [22] we found a medium sized effect of scanner on between group differences. The discriminatory accuracy between AD dementia and MCI patients and healthy controls after cross validation was about 80 to 70%, respectively, rendering multicenter rs-fMRI inferior in diagnostic accuracy compared with hippocampus volume [22], a well-established structural MRI marker of AD [23].
We expected that the retrospective collection of fMRI data without controlling for the acquisition parameters increased multicenter variability and decreased group discrimination compared with harmonized rs-fMRI acquisitions across scanners. Therefore, in the present study we determined the diagnostic accuracy of two frequently employed rs-fMRI indices, functional connectivity [16] and amplitude of low-frequency fluctuation (ALFF) [24], from a prospective cohort study with a harmonized acquisition protocol and prospectively employed scan quality control. Extending previous studies, we included not only people with AD dementia, MCI or healthy controls, but also a group of people with SCD which represent a preMCI at risk stage of AD [5]. We hypothesized that multicenter variability of functional connectivity and ALFF would be lower compared with previous multicenter studies using harmonized retrospective data collection. In addition, we hypothesized that the cross-validated diagnostic accuracy would be higher in the prospective cohort than in previous multicenter studies which were based on retrospective data. To address the issue of multicollinearity of functional imaging features, we employed the technique of elastic net regression [25] which was found superior for feature selection in several previous studies, including fMRI, FDG-PET, structural MRI and amyloid PET data of people with AD and MCI, compared with classical stepwise selection [26–29].
MATERIALS AND METHODS
Subjects
For the current study we used data from the DELCODE study, an ongoing observational longitudinal memory clinic-based multicenter study in Germany [30]. The sample included 27 patients with a clinical diagnosis of probable AD dementia according to the National Institute on Aging-Alzheimer’s Association (NIA-AA) workgroups guidelines [2], 50 patients meeting the core clinical criteria for MCI according to NIA-AA workgroups guidelines [1], 90 people with a diagnosis of SCD, and 80 cognitively healthy older controls. Participants with SCD were cognitively unimpaired and stated to have decline in cognitive functioning unrelated to an event or condition explaining the cognitive deficits according to research criteria [5]. Healthy controls never reported SCD and had no history of neurological or psychiatric disease or any sign of cognitive decline. All participants were tested with an extensive cognitive battery [30] including the Consortium to Establish a Registry of Alzheimer’s Disease (CERAD) cognitive battery [31], the Mini-Mental Status Examination (MMSE) [32], the clinical dementia rating scale (CDR) [33], the immediate and delayed story recall logical memory subtest of the revised Wechsler Memory Scale [34], and the Geriatric Depression Scale (GDS) [35]. Participants were excluded from the study if they fulfilled one of the following exclusion criteria: current major depressive episode; major psychiatric disorders (e.g., psychotic disorder, bipolar disorder, or substance abuse); neurodegenerative disorder other than AD; vascular dementia; or history of stroke with residual clinical symptoms. Further information is given in [30]. A detailed overview about relevant comorbidities and medication is provided in the Supplementary Material.
Groups were matched in respect to age and sex distribution. These data originated from an interim data set of the first 400 cases of the DELCODE study at baseline. From these 400 cases only 320 had rs-fMRI data available. From these 320 scans we excluded 9 cases due to neurologic conditions, 20 cases due to image quality issues, and 44 cases due to unbalanced age and sex distribution, leaving 247 scans originating from six sites of the DELCODE study. The demographic characteristic of the participants of the current analysis can be found in Table 1.
Demographic characteristics
MMSE, Mini Mental State Examination [32]; GDS, Geriatric Depression Scale [35]. 1not significantly different between groups, χ2 = 5.4, 3 df, p = 0.14. 2not significantly different between groups, F(3, 243) = 7.5, p = 0.25. 3significantly different between groups, Kruskal Wallis Test, p < 0.001. 4significantly different between groups, F(3, 243) = 6.0, p < 0.001. 5not significantly different between groups, F(3, 243) = 1.3, p = 0.26.
Written informed consent was provided by all participants, or their representatives. The study was approved by local ethics committees at each of the participating centers and has been conducted in accord with the Helsinki Declaration of 1975.
Of the 80 controls, 28 had Aβ42 and Aβ42/Aβ40 ratio measures available from CSF, with a normal Aβ42/Aβ40 ratio in 25 cases; of the 90 people with SCD 36 had CSF markers available with a normal Aβ42/Aβ40 ratio in 29 cases; of the 50 people with MCI 27 had CSF markers available, with a normal Aβ42/Aβ40 ratio in 14 cases; in AD dementia CSF markers were available in 14 cases with a normal Aβ42/Aβ40 ratio in one case. Lumbar puncture followed the MRI scanning within on average 19 days (ranging from 0 to 78 days).
Imaging data acquisition
Data were obtained from six Siemens 3.0 Tesla MRI scanners (4 Verio, one Skyra, one TimTrio) with unified scanning protocols and instructions. In all centers, the participants were instructed to keep their eyes closed, relax, but not to fall asleep. Initially, the field-of-view (FOV) was orientated to be in plane with the anterior– posterior commissure line covering the whole brain. Functional MRI was based on a T2*-weighted echo-planar imaging sequence using a 64×64 image matrix with 47 axial slices (thickness 3.5 mm, no gap) and interleaved acquisition. The FOV was 224×224×165 mm, isotropic voxel size of 3.5 mm, echo time 30 ms, repetition time 2,580 ms, flip angle 80°, and parallel imaging acceleration factor 2. The sequence took 7 min 54 s. High-resolution T1-weighted anatomical scans were obtained from all participants using the magnetization-prepared rapid gradient echo (MPRAGE) sequence during the same session. Image matrix was 256×256 with 192 sagittal slices, FOV 250×250×192 mm, isotropic voxel size of 1 mm, echo time 4.37 ms, repetition time 2,500 ms, flip angle 7°, and parallel imaging acceleration factor 2. The duration of the sequence was 5 min 8 s.
Biomaterial sampling
Biomaterial sampling included CSF in those participants, who consented. Trained study assistants performed the collection, processing and storage of the samples up to the shipment to the central biorepository of the DZNE according to SOP. After the centrifugation CSF was aliquoted and stored at – 80°C.
MR processing
The
Extraction of hippocampus volumes
A mask for the hippocampus was obtained by manual delineation of the hippocampus in the reference template following the harmonized protocol for hippocampus segmentation [48, 49]. Individual gray matter volumes of the hippocampus were extracted automatically from the warped gray matter segments by summing up the modulated gray matter voxel values within hippocampus ROI in the reference space and proportional scaling to total intracranial volume (TIV) to adjust for head size.
CSF AD biomarker assessment
CSF Aβ42 and Aβ40 levels were determined using commercially available kits according to vendor specifications (V-PLEX Aβ Peptide Panel 1 (6E10) Kit). Cut-offs for normal and abnormal concentrations of Aβ42 (<496 pg/ml), and of the ratio Aβ42/Aβ40 (<0.09) were derived from the literature, which applied the respective assays [50].
Statistical analysis
Demographics
We compared demographic characteristic between groups using parametric and non-parametric tests as required: Age and years of education were compared between groups using Student’s t-test, sex distribution using Chi-square test, MMSE and GDS scores using the Mann-Whitney-U- test.
Data quality
We determined the variability of the temporal signal to noise ratio (tSNR) across centers to assess the degree of between center variability. Additionally, we assessed the standardized DVARS, a measure of how much the intensity of a brain image changes in comparison to the previous time point [42]. Standardized DVARS is scaled by the temporal standard deviation and temporal autocorrelation so that it is approximately 1 if there are no artifacts in the functional data. This measure detects scan artifacts that are not necessarily related to head motion [42]. We had found both measures, tSNR and DVARS, highly sensitive to indicate insufficient image quality in a previous multicenter rs-fMRI study [22].
Diagnostic accuracy of resting state fMRI features
We determined group discrimination based on a penalized logistic regression model with an elastic net penalty, using the R package glmnet (available at http://cran.r-project.org/web/packages/glmnet/index.html). Elastic net regression extends the traditional linear regression model, which minimizes the residual sum of squares, such that two penalty terms are added [25]:
We used a support vector machine (SVM) as alternative classifier to assess if the outcome was sensitive to the employed classifier. Details of the SVM classifier are described in the Supplementary Material.
RESULTS
Demographics
Groups were matched in respect to age and sex, so that we did not find significant group differences in these parameters; in addition, groups were not significantly different in education (Table 1). As expected, healthy controls and people with SCD scored higher in the MMSE than the MCI and AD dementia cases, with the lowest performance in the AD dementia cases. GDS scores differed significantly between groups, i.e., healthy controls had significantly lower values than SCD, MCI and AD dementia cases; however, all participants scored within a clinically normal range.
Between-center variability
The temporal signal to noise ratio and the standardized DVARS across the six sites included in the analysis are shown in Fig. 1. Both indices showed wide overlap between centers and less variation in comparison to the corresponding values from the retrospectively collected psymri data (shown as boxplot on the left for both indices), suggesting a low between center variability in these key measures of scan quality.
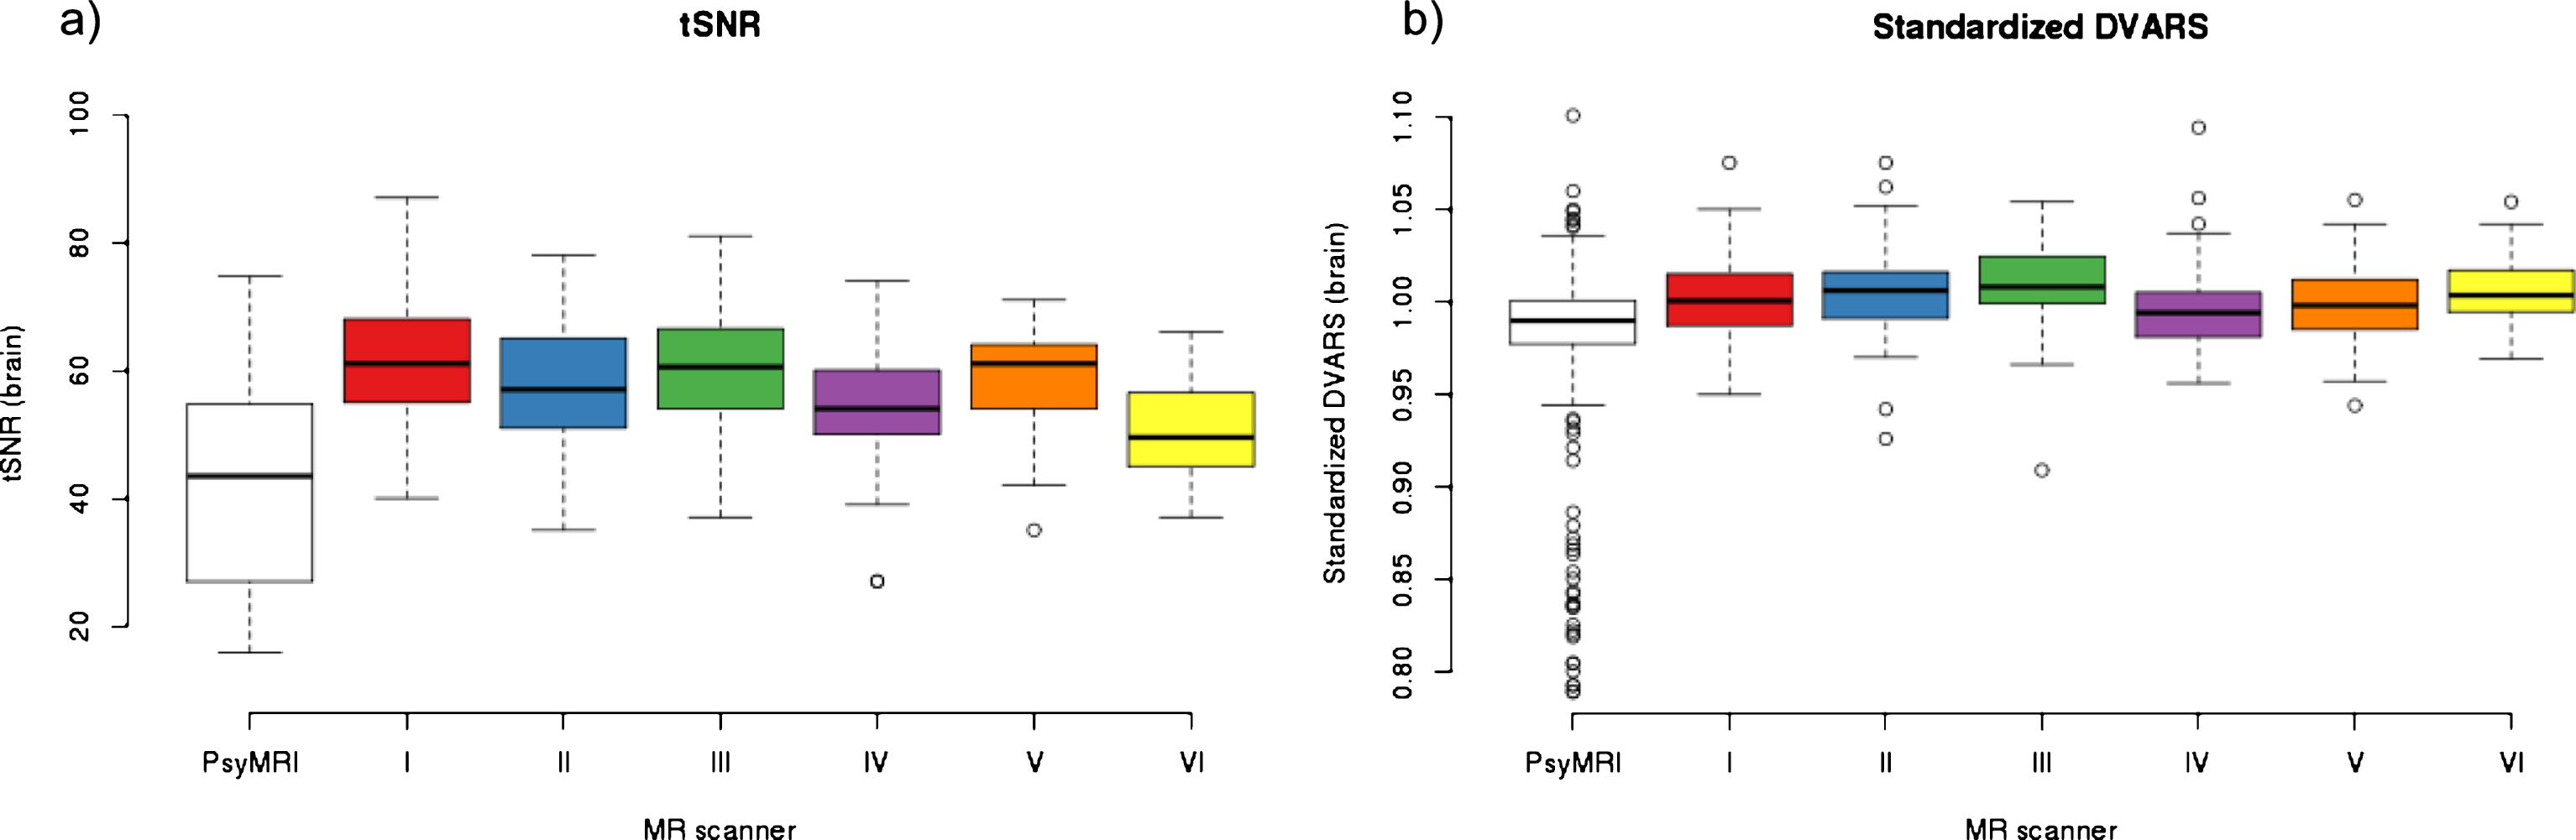
Multicenter data quality indices. a) Mean whole brain temporal Signal to Noise Ratio (tSNR). b) Standardized DVARS. Box plots for the quality indices with open circles indicating outlying values for the six centers (denoted center I to center VI). For comparison, the boxplots to the left indicate the corresponding values from the retrospectively collected fMRI data of the psymri cohort.
Group discrimination
As shown in Fig. 2, the cross-validated discrimination accuracy for ALFF and functional connectivity ranged between 56% and 81% in the people with AD dementia compared to healthy controls, was 57% in the MCI cases and ranged between 56% and 57% in the people with SCD. Using functional connectivity measures based on other atlases than the Greicius atlas [44] yielded essentially identical results with on average slightly lower AUC for the Craddock [45] (– 3%) and Schaefer-Yeo [46] (– 4%) atlases (Supplementary Figure 1). Notably, the Schaefer-Yeo atlas [46] performed substantially worse (– 15% AUC) for amyloid-positive AD dementia cases versus amyloid-negative controls, which might result from the missing subcortical regions in that specific atlas. With exception of the AD dementia cases, the bootstrapped 95% confidence intervals (CI) of the cross validated accuracy levels included the value of 50%, suggesting that the degree of diagnostic accuracy did not significantly exceed random guessing accuracy in all groups except the AD dementia cases. For comparison, the diagnostic accuracy based on the hippocampus volume was only 54% in people with SCD, but reached 75% in people with MCI and 88% in people with AD dementia. When we repeated the analysis with a dummy coded center covariate forced into the model, the diagnostic accuracy remained essentially unchanged.
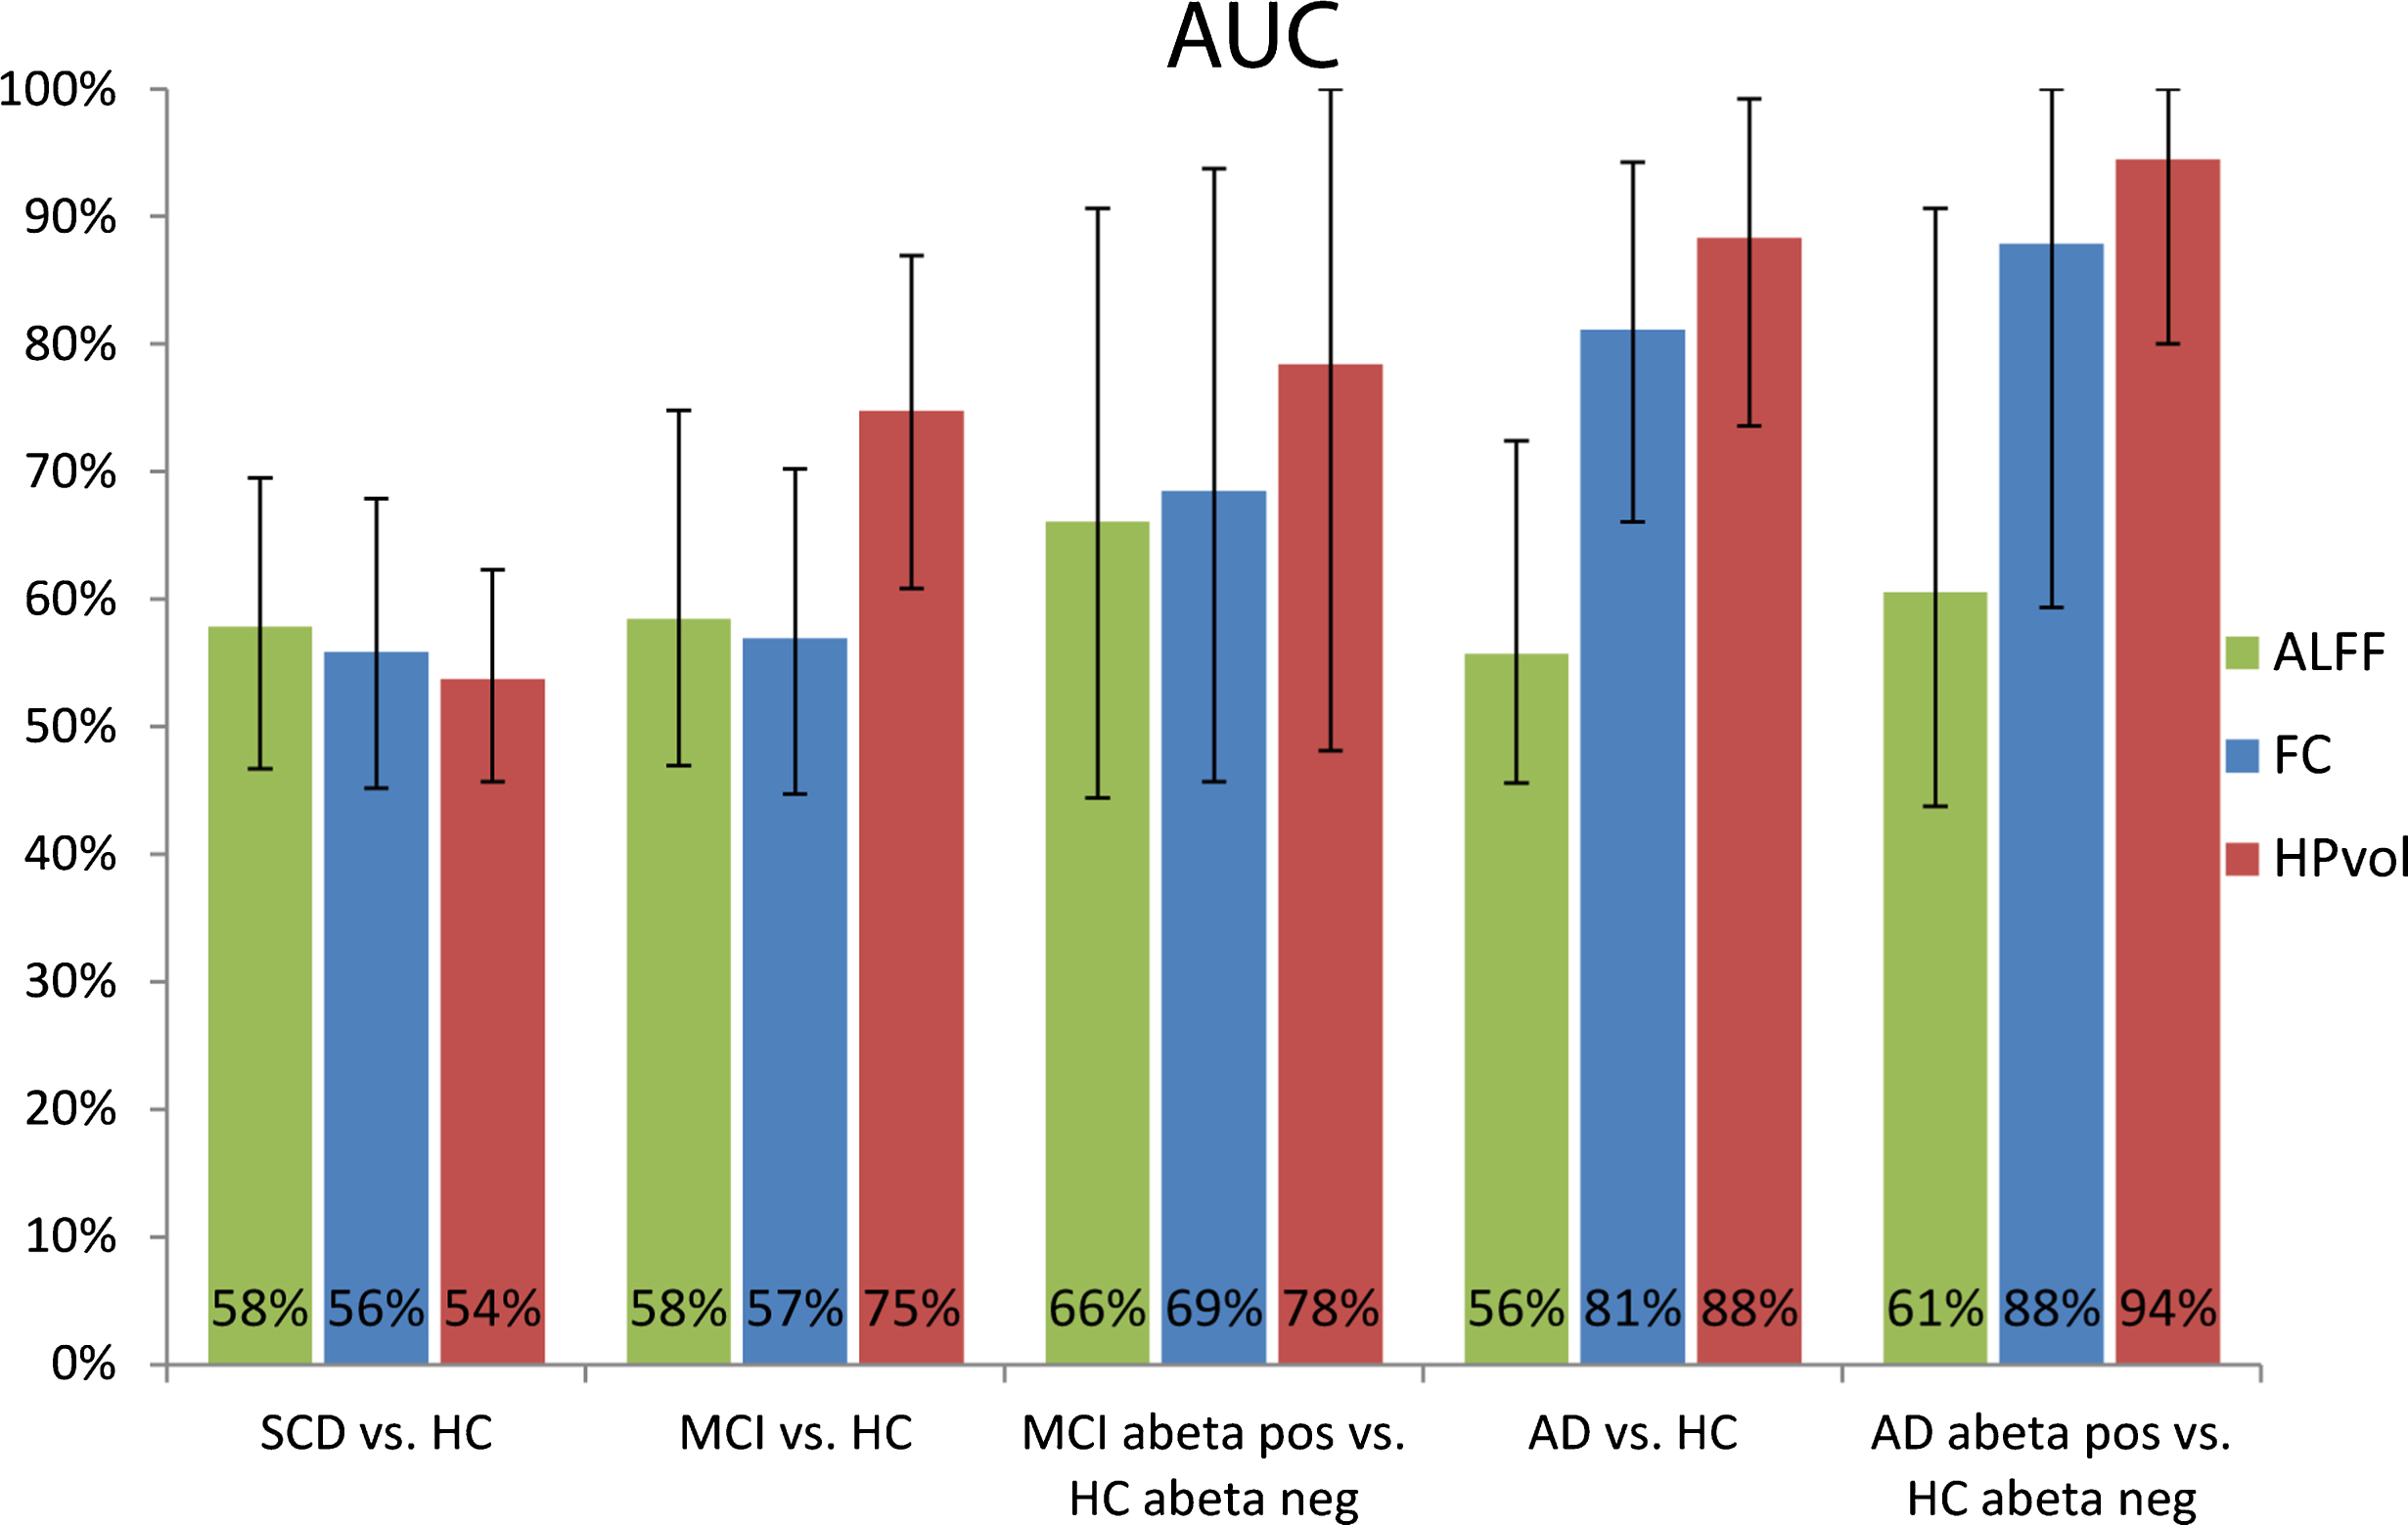
Cross-validated areas under the ROC curves. Bar diagrams for the group discrimination accuracy as measured by cross-validated AUC with 95% confidence intervals. SCD, subjective cognitive decline; HC, healthy controls; MCI, mild cognitive impairment; AD, Alzheimer’s disease; ALFF, amplitude of low-frequency fluctuation; FC, functional connectivity; HPvol, hippocampal volume.
When we assessed the diagnostic accuracy in the MCI subgroup of 13 cases with an abnormal Aβ42/Aβ40 ratio in CSF and the 25 healthy controls with a normal Aβ42/Aβ40 ratio, we found a cross-validated AUC for ALFF and functional connectivity between 69% and 73%, with the lower level of the 95% CI including 50%. For comparison in this subsample, hippocampus volume reached a cross-validated AUIC of 78%, where the 95% CI included 50% as well.
When we determined the 50% most frequently selected functional connectivity networks using elastic net regression for the AD dementia cases versus controls comparison, these networks involved functional connectivity between regions from the dorsal DMN, the anterior and posterior salience network, the language network, the left executive network, the visuo-spatial and the sensori-motor network (Table 2 and Fig. 3). Since the other comparisons did not significantly exceed random guessing accuracy, we did not assess the regional distribution of discriminatory features for these comparisons.

Resting state network components contributing to the discrimination between AD patients and controls. Resting state network components whose functional connectivity was contributing to the discrimination between AD patients and controls projected on a structural MRI scan in MNI space. Axial sections go through MNI z coordinates – 38, – 26, – 14, – 2, 10, 22, 34, and 46 mm. Colors code the sum of the beta weights for each region.
Functional connectivity on regional and network level discriminating AD patients from controls
r., right; l., left; ant., anterior; post., posterior; FC, functional connectivity; dDMN, dorsal default mode network; RECN, right executive network; LECN, left executive network.
When we used a support vector machine classifier, results were similar to the elastic net classification (see Supplementary Figure 2).
DISCUSSION
Compared with previous multicenter studies using retrospective data acquisition, in this prospective multicenter rs-fMRI analysis we found less pronounced variations of global scan quality parameters across sites, including measures of temporal signal to noise ratio that we had found to be particularly sensitive to between scanner variability in a previous study [22]. Despite the smaller inter-scanner variability, between group effects of resting state functional connectivity and ALFF reached only small effect size in prodromal and at risk stages of AD, such as SCD and MCI. Only in manifest stages of AD dementia, we found 80% accuracy of group discrimination, where the cross-validated level of accuracy was significantly above chance level. This level of accuracy is similar to the level of between group discrimination in previous monocenter studies comparing AD dementia and healthy controls using cross validated diagnostic accuracy. In contrast, the discrimination between MCI patients and controls and even between MCI patients with pronounced episodic memory impairment and controls did not significantly differ from chance level. The effect was even smaller for the people with SCD. These results were not sensitive to the atlas selection and were replicated using support vector machine as alternative classifier.
The level of accuracy found in our amnestic MCI cases is lower than the levels of accuracy found in previous mono-center studies when these did not consider the cross-validated accuracy [14, 15], and two studies using cross-validation [16, 17]. One recent study based on multicenter fMRI data from ADNI, found a level of 77% cross-validated accuracy for the discrimination between 54 MCI cases and 54 controls based on functional connectivity, without explicitly addressing the multicenter characteristics of the data [52]. Our findings agree with a previous multicenter study which was based on retrospective collected fMRI data sets, where we found cross validated accuracy of group discrimination between MCI patients and controls between 66% and 72% [22]. Together these data suggest that despite a reduction of multicenter variability through a prospectively harmonized acquisition protocol the usefulness of resting state functional connectivity for the discrimination between amnestic MCI cases and healthy controls is very limited. The level of accuracy was higher when comparing the subset of MCI cases who were amyloid positive with the controls who were amyloid negative. The level of accuracy here ranged between 66% and 69%; with the large confidence interval likely reflecting the small number of cases. One previous fMRI study showed steeper age related decline in DMN, posterior cingulate and frontoparietal resting state network connectivity in CSF amyloid positive versus amyloid negative cognitively healthy older people [53]. Consistently, previous rs-fMRI studies showed that resting state connectivity measures were related to CSF levels of amyloid across diagnostic groups, including cognitively healthy older people, people with MCI and AD dementia patients [54–58]. Taking these previous findings into account, our finding would indicate that rs-fMRI functional connectivity more closely reflects the underlying molecular pathology than the clinical phenotype of amnestic MCI; this is different to hippocampus volume that reached similar levels of accuracy both in amnestic MCI cases and the amyloid positive subgroup, suggesting that hippocampus volume reflects the amnestic phenotype of MCI, relatively independent from the underlying molecular pathology.
The number of previous monocenter studies in people with SCD is limited. One study used independent component analysis to decompose the rs-fMRI data of 13 healthy controls, 8 people with Alzheimer’s disease dementia, 21 with MCI and 16 with SCD into distinct functional connectivity networks and assessed the association of these networks with neuropsychological performance in different cognitive tests. Group differences in functional connectivity were not reported [59]. To our knowledge, the current study is the first multicenter study to report diagnostic accuracy of functional connectivity from rs-fMRI to discriminate people with SCD from healthy controls. Interestingly, two previous monocenter studies reported not only decreases, but also significant increases of functional connectivity measures in SCD people compared to controls, one study comprising 25 SCD cases and 60 controls [60] and the other study comprising 25 people with SCD and 29 controls [61].
The lack of a significant discrimination between SCD cases and controls in our study may be related to two factors: First, in the subset of SCD cases where CSF was available, the proportion of amyloid positive cases was low with only 19%, albeit comparable with previous studies in subjective memory complainers with a rate of 21% amyloid positive cases [62]. If we interpolate this proportion to the entire group of SCD cases this would indicate that the majority of the SCD cases was not in a preclinical state of AD so that the lack of discrimination may simply reflect the lack of underlying neuropathology. The few previous studies on resting state fMRI in SCD [59–61] did not control for amyloid status. Unfortunately, with only 7 amyloid positive SCD cases we were not able to determine a meaningful level of accuracy. Secondly, following the previous observation that SCD cases showed not only decreased, but also increased connectivity [60, 61], people with SCD may present with a mixture of increases and decreases of functional connectivity that together may lead to a poor diagnostic accuracy when searching for between group differences across the entire brain.
In addition, relevant for all comparisons multicenter acquisition may additionally reduce between group effects through sources of inter-scanner variance that remain even after prospective harmonization of acquisition protocols and strict image quality control. The negative finding in the SCD group is based on a relatively large sample of 90 cases compared to 80 controls with a strict matching in respect to age, sex distribution and MMSE score performance. These are the first data on the discriminatory power of rs-fMRI in SCD, however, due to the relatively high number of cases, the risk of a false negative finding is small.
When we assessed the networks and regions contributing to significant group discrimination in AD dementia, we found not only a strong involvement of default mode network (DMN) regions, including not only hippocampal and neocortical but also thalamic components of this network, but also language, executive, salience and visuo-spatial networks. This agrees with previous studies showing reduced within network connectivity in AD patients compared with controls in the DMN, ventral and dorsal salience network, executive network and a frontal-parietal network involving the precuneus [63] as well as altered between network connectivity involving the dDMN, executive, visuospatial, fronto-parietal and anterior and posterior salience networks [54, 65], including the thalamus. Indeed, we found a reduced strength of positive associations within the DMN or the DMN and the precuneus resting state network in AD patients compared with controls, and a reduced strength of negative associations between the DMN and the anterior salience network. Different to previous studies [54, 65], however, we did not a priori exclude resting state networks from the analyses. Using such a purely data driven approach, we found alterations also including networks that would be considered to be relatively spared by AD, such as the sensorimotor or auditory network. This does not imply decline of connectivity within these latter networks, but rather a change in coupling between relatively spared and more affected networks. So, for example, the negative association between sensorimotor and auditory network components became less strong in AD patients compared with controls or sensorimotor network and DMN components became more negatively associated in AD, suggesting a potential dysfunctional compensatory effect in people with AD.
A strength of our study is the large number of people with subjective cognitive decline. To our knowledge only the INSIGHT-preAD cohort [62] with 318 participants has a larger number of people with subjective cognitive decline and rs-fMRI, however, the INSIGHT-preAD cohort does not have a control group so that the analysis of the discriminatory accuracy of rs-fMRI has to await the longitudinal follow-up. A limitation of our study is that the number of available CSF samples was too small in the SCD group to allow for a meaningful comparison of the amyloid positive SCD cases with the amyloid negative controls. The DELCODE study is ongoing so that we will have access to a larger number of amyloid positive SCD cases to study the association of rs-fMRI with the presence or absence of biomarker-confirmed preclinical at risk stages of AD in the future.
A strength of the study in comparison to previous retrospective multicenter rs-fMRI studies is the strict harmonization of acquisition protocols as well as the strict implementation of scan quality controls throughout the study. Indeed, compared to our previous study based on retrospective data [22], key parameters of scan quality showed much less variability in the prospectively acquired data. Still, although the degree of variability between scanners was lower compared to the previous multicenter study, the achievable level of diagnostic accuracy was comparable to the previous study, suggesting that between scanner variability is not the main source of limited diagnostic accuracy from multicenter rs-fMRI data. Future follow-up data of this cohort will allow us to determine predictive accuracy of resting state functional connectivity for a clinically relevant functional outcome such as decline of cognitive function or conversion to dementia.
The prospective design of our study with a strict harmonization of acquisition protocols is a strength of the study when we interpret the findings in respect to future application of the technique in controlled multicenter trials. Since the outcome of our prospective study suggests a low diagnostic accuracy of rs-fMRI functional connectivity in a highly controlled setting, we expect the level of accuracy would even be lower in a less controlled routine care setting.
In summary, in a prospective multicenter resting state fMRI acquisition we found significant group discrimination between AD dementia patients and controls that was, however, inferior to the widely established measure of hippocampus volume. Functional connectivity or ALFF did not reach significant group discrimination above chance level neither in SCD nor in amnestic MCI cases. These findings suggest that measures of functional connectivity based on Pearson’s correlation or ALFF, independently of the selected atlas and the classifier, are not useful markers in prodromal stages of AD. Future multicenter studies should explore the diagnostic usefulness of alternative functional connectivity measures, such as partial correlation [66], regional homogeneity [67] or functional dynamics based on shorter time windows of the resting state scan [66] that are currently less widely used than ALFF and Pearson’s correlation metrics.
Footnotes
ACKNOWLEDGMENTS
SJT received support by a grant of the Federal Ministry of Research (BMBF) (AgeGain, 1GQ1425B).
DELCODE study group: J. Acosta-Cabronero, S. Altenstein, H. Amthauer, I. Apostolova, M. Barkhoff, D. Berron, M. Betts, M. Beuth, D. Bittner, F. Brosseron, K. Brüggen, K. Bürger, A. Cardenas-Blanco, C. Catak, Y. Cheng, L. Coloma Andrews, M. Dichgans, D. Diesing, L. Dobisch, A. Dörr, E. Düzel, M. Dyrba, M. Ehrlich, B. Ertl-Wagner, J. Faber, K. Fließbach, D. Frimmer, I. Frommann, M. Fuentes, W. Glanz, D. Grieger-Klose, D. Hartmann, D. Hauser, Ch. Heine, G. Hennes, G. Herrmann, B. Huber, A. Hufen, H. Janecek-Meyer, D. Janowitz, F. Jessen, Ch. Kainz, P. Kalbhen, J. Kalzendorf, E. Kasper, I. Kilimann, X. Kobeleva, B. Kofler, Ch. Korp, M. Kreißl, M. Kreuzer, A. Langenfurth, E. Lau, C. Lindlar, K. Lindner, A. Lohse, E. Markov, H. Megges, F. Menne, C. Metzger, E. Meyer, L. Miebach, K. Möhring, A. Müller, C. Müller, P. Nestor, K. Neumann, O. Peters, H. Pfaff, A. Polcher, J. Priller, H. Raum, A. Rominger, S. Röske, Ch. Ruß, P. Sabik, P. Sänger, J. Schmid, M. Schmidt, A. Schneider, Ch. Schneider, H. Schulz, F. Schulze, P. Schulze, H. Schütze, S. Schwarzenboeck, A. Seegerer, O. Speck, A. Spottke, E. Spruth, J. Stephan, A. Szagarus, S. Teipel, C. Tempelmann, F. van der Ven, I. Villar Munoz, I. Vogt, M. Wagner, M.-A. Weber, S. Weschke, Ch. Westerteicher, C. Widmann, I. Wienhöft, S. Wolfsgruber, R. Yakupov, S. Yilmaz, G. Ziegler, A. Zollver.