
Abstract
Background:
Subjective cognitive decline (SCD) may be an early manifestation of pre-clinical Alzheimer’s disease. Elevated amyloid-β (Aβ) is a correlate of SCD symptoms in some individuals. The underlying neural correlates of SCD symptoms and their association with Aβ is unknown. SCD is a heterogeneous condition, and cognitive reserve may explain individual differences in its neural correlates.
Objective:
We investigated the association between brain activation during memory encoding and SCD symptoms, as well as with Aβ, among older individuals. We also tested the moderating role of education (an index of cognitive reserve) on the associations.
Methods:
We measured brain activation during the “face-name” memory-encoding fMRI task and Aβ deposition with Pittsburgh Compound-B (PiB)-PET among cognitively normal older individuals (n = 63, mean age 73.1 ± 7.4 years). We tested associations between activation and SCD symptoms by self-report measures, Aβ, and interactions with education.
Results:
Activation was not directly associated with SCD symptoms or Aβ. However, education moderated the association between activation and SCD symptoms in the executive control network, salience network, and subcortical regions. Greater SCD symptoms were associated with greater activation in those with higher education, but with lower activation in those with lower education.
Conclusion:
SCD symptoms were associated with different patterns of brain activation in the extended memory system depending on level of cognitive reserve. Greater SCD symptoms may represent a saturation of neural compensation in individuals with greater cognitive reserve, while it may reflect diminishing neural resources in individuals with lower cognitive reserve.
Keywords
INTRODUCTION
Subjective cognitive decline (SCD) refers to self-experienced decline in cognitive function, despite normal objectively measured cognitive functioning. It has been suggested that SCD may represent an early transition state from normal aging to mild cognitive impairment (MCI) and eventually Alzheimer’s disease (AD) [1, 2]. SCD symptoms are associated with amyloid-β (Aβ) deposition [3–5]. However, the neural correlates of SCD and its associations with the risk of future progression are not well understood.
SCD is commonly characterized by subjective memory complaints or impairment [6]. Prior functional magnetic resonance imaging (fMRI) studies of SCD have largely focused on memory encoding [7–9] and have shown SCD-associated hippocampal hypoactivation [7] and dorsolateral prefrontal cortex (DLPFC) hyperactivation [7, 9]. In the context of successful memory encoding, SCD subjective symptoms were associated with activation in default mode network (DMN) [8]. These results are somewhat mixed regarding brain regions as well as hypo- versus hyper-activation, yet all studies suggested altered neural activation to maintain memory function in SCD. They all suggested that the altered neural activation may reflect neural compensation [10], occurring in response to early AD neuropathology (e.g., Aβ) [11]. However, the relationship between task-induced neural activation and AD neuropathology has not been directly investigated in SCD.
Another aspect that is not well understood in SCD is how heterogeneity or individual differences may manifest in terms of functional neural activation. Etiology and progression of disease in SCD is heterogenous across individuals [12]. To explain individual differences in resilience against risk of dementia, Stern [10, 13] postulated the cognitive reserve theory: individuals vary in the degree of effective maintenance of cognitive ability in the face of neural pathology. Cognitive reserve is approximated by proxy measures such as education, IQ, literacy, and occupational complexity. The role of education on risk for disease progression in SCD has inconsistent findings in the literature. Fewer years of education in SCD was associated with risk of progressing to MCI or AD in a research clinic setting [14]. However, in a large population based study [15], higher education in SCD was associated with greater risk of progression to AD, in contrast to the protective effect of education widely observed in other studies (see [16] for a review). The frontal cortex [17] and posterior cognitive control regions [18] have been suggested as functional hubs of cognitive reserve. Along with prefrontal regions, a systematic review suggested that the dorsal attention network (i.e., frontal eye field, intraparietal sulcus) may underlie cognitive reserve through compensatory activity in older adults and may be associated with AD pathology [19].
This study aimed to 1) characterize the neural correlates of SCD symptoms using fMRI during a memory encoding task; 2) examine the role of Aβ using positron emission tomography (PET) to better understand brain activation in association with AD pathology; and 3) explore how education, a proxy for cognitive reserve, may moderate the relationship between brain activation and indices of AD risk (SCD symptoms and Aβ). We selected the associative memory encoding (face-name) task because this well-validated task has been extensively used to characterize neural alterations in the AD spectrum (e.g., [20–22]). To aid in interpreting any identified neural alterations in SCD, we considered networks (e.g., salience network, executive control network) as a useful context to make inferences about system-wide neural bases [23].
METHODS
A detailed description of the methods used in this study can be found in the Supplementary Materials.
Study design and participants
We analyzed data from 63 cognitively normal older individuals (mean age = 73.1±7.4) with varying SCD symptoms (Table 1). Participants were analyzed from two study samples: self-referred patient volunteers at an academic memory clinic (n = 22) and community-based volunteers for a neuroimaging study (n = 41).
Demographic Information
Demographic variables: SUVR, standardized uptake value rate; Post-Scan Recognition, an accuracy of recognition memory for the post-scan task; RMS, root mean square; sd, standard deviation. aTukey’s HSD –only significant group differences (p < 0.05) were listed.
Participants from the memory clinic were approached and recruited after they self-referred for evaluation at the University of Pittsburgh Alzheimer Disease Research Center (ADRC). The inclusion criteria for memory clinic participants were: 1) age 50 and older; 2) clinically significant subjective concern about cognitive changes; 3) normal objective cognitive function; and 4) fluent in English. Normal cognitive function was defined as no more than two scores falling one standard deviation below age-adjusted norms on a neuropsychological battery, and adjudication of normal cognitive function in a diagnostic consensus conference.
Community-based volunteers were recruited through advertisements, and their inclusion criteria were: 1) age 65 and older; 2) normal objective cognitive function; and 3) fluent in English. All participants completed a multi-domain neuropsychological assessment and were reviewed by a diagnostic consensus conference that included at least two of the same investigators (authors BES and WEK) as the ADRC setting. Determination of normal cognitive function was comparable to that in the ADRC sett-ing. Exclusion criteria for all participants were: 1) diagnosis of MCI or dementia; 2) history of significant neurologic or major psychiatric conditions; 3) current medical condition or medications that may affect cognitive function; 4) current clinical depression (scored above the common clinical cutoff of 15 on Geriatric Depression Scale); and 5) contraindications for MRI or PET scans.
More detailed descriptions of inclusion/exclusion criteria have been reported previously [24]. We excluded one participant due to poor fMRI coverage in the inferior temporal region and three participants due to excessive motion (i.e., more than 20%of resting state data identified as head-jerks [25]) with a final sample of n = 63. All participants provided written informed consent according to protocols approved by the University of Pittsburgh Institutional Review Board.
Self-report, neuropsychological, and demographic assessments
Three measures of self-reported SCD symptoms were used: the Memory Functioning Questionnaire (MFQ) [26]; the Cognitive Failures Questionnaire (CFQ) [27]; and the Subjective Cognitive Complaint Scale (SCCS) [28]. Each scale was transformed into Z-scores using age-adjusted means from published studies [5, 30] and standard deviations (SD) from current participants’ responses. After inverting the MFQ (such that higher values indicate worse SCD symptoms), we computed a mean of Z-scores. We defined this composite score as “SCD symptoms” and included it in analyses as a continuous variable indicating the SCD symptom severity. This continuous measure approach was used in a previous fMRI study in SCD [8], and we employed the same approach here.
We employed the modified Rey-Osterrieth complex figure immediate and delayed recall scores [31] as an index of objective memory performance to complement our visual memory-encoding fMRI task. We transformed both scores to Z-scores using age-adjusted means from previously published studies [32] and SD from current participants’ responses. Then, we defined an objective memory score as a mean of Z-scores. Five participants were missing memory test scores due to a change in the neuropsychological test battery; these participants were excluded from corresponding analyses but included for the main fMRI analysis.
We also measured neuroticism with the NEO Five-Factor Inventory (FFI-3) [33] and included it as a covariate to account for the influence of previously reported high neuroticism in SCD [34] (details below).
Participants self-reported years of education. We summarized participant characteristics for each education group [high school (≤12 years, n = 15), some college (> 12 and ≤16 years, n = 24), and post college (> 16 years, n = 24)] and conducted ANOVA and Tukey’s HSD post-hoc procedure to assess group difference for each variable (Table 1).
Face-name association fMRI task
We employed the “face-name” association task, which elicits paired associative memory encoding [20–22] (Supplementary Figure 1). This task consists of three phases: a pre-scan session, an in-scanner fMRI session, and a post-fMRI scan test. During the pre-scan session, participants were shown two face-name pairs (a woman named Linda and a man named Richard, see Supplementary Figure 1A) to teach the task and to establish two familiar associations.
Then, in the MRI scanner, participants saw a face-name pair for 5 s and decided whether the name subjectively “fit” the face—which has no correct answer. Participants responded with their right/left index finger if the name fit or not, respectively. Participants were given the following instructions: “Try to remember these face-name combinations; you will be quizzed after the scan.” During encoding (i.e., experimental) blocks, participants were presented with eight novel face-name pairs. Recognition (i.e., control) blocks were identical to experimental blocks except with familiar face-name pairs learned during the pre-scan session (Supplementary Figure 1A). Faces were presented for 5 s each, and a white plus sign was presented for 1 s after each face. Blocks lasted 48 s each and were alternated with a 25 s fixation period. Each block repeated twice (5 min for 1 run). Participants repeated the task three times (i.e., three runs) and saw 50 face-name pairs: two familiar and 48 novel pairs.
During the post-fMRI scan test, participants saw a face with two names (Supplementary Figure 1B), one seen in the scanner and one new, and were asked to choose the name seen in the scanner. With this post-scan test, we assessed the accuracy of recognition memory (i.e., task performance—how accurately participants recognized the name which they encoded in the scanner) as a post-scan recognition score. Two participants were missing this score, and for the participants that did not complete all sessions, we ensured that their post-scan test used only the faces they saw in the scanner.
PET data acquisition
PET emission data were acquired on a Siemens ECAT HR+PET scanners as previously described [35]. Briefly, participants were positioned in the scanner approximately 35 min after [11C]PiB injection (15 mCi). A 10 min transmission scan was acquired using rotating 68Ge/68Ga rod sources to correct for photon attenuation, followed by a 20 min emission scan (4×5 min frames) beginning 50 min after [11C]PiB injection. PET emission data were reconstructed using filtered back-projection (Direct Inverse Fourier Transform) into a 128×128×63 matrix with voxel sizes of 2.06×2.06×2.43 mm3. Images were filtered with a 3 mm Hann window.
MRI data acquisition
MRI data were collected using a 3T Siemens Trio TIM scanner with a 12-channel head coil. The whole brain structural sequences were collected: sagittal 3D MPRAGE, axial 2D FLAIR, axial 3D T2-weighted sequence (see Supplementary Methods for parameters). An axial EPI BOLD (blood oxygen-level dependent) sequence during the face-name association task was collected with echo time = 32 ms, repetition time = 2000 ms, flip angle = 90°, field-of-view = 128×128, 2×2×4 mm resolution with no gap, and GRAPPA (GeneRalized Autocalibrating Partial Parallel Acquisition) factor of two. Due to poor coverage and placement, scans covered above the cerebellum up to the motor cortex. The most superior part of the motor cortex (approximately 12 mm) and orbitofrontal cortex (approximately 18 mm from the most inferior part) were out of coverage.
PET data analysis
PET images were corrected for interframe motion using the automated image registration (AIR) algorithm (parameters optimized for PET-to-PET registration) and summed over 50–70 min post-injection. MRI images were manually skull-stripped and reoriented with axial image planes parallel to the anterior-posterior commissure line. [11C]PiB images were registered to skull-stripped MRIs using rigid body registration in AIR v3.0 [36]. MR images data were resliced using the inverse spatial transformation to match PET image space (128×128×63, voxel size = 2.06×2.06×2.43 mm). Six ROIs were manually traced on the co-registered MR image for PET image sampling as previously described [37, 38]. Regional radioactivity concentrations from ROIs were transformed into units of standardized uptake value (SUV) using the injected dose of PIB and the participant’s body mass. The SUV was normalized to non-specific uptake (cerebellum as reference), yielding an SUV ratio (SUVR) measure that compares favorably to fully quantitative measures of specific radiotracer retention [39]. SUVRs were partial volume-corrected using a previously validated met-hod that corrects for dilutional effects of PET signals due to limited spatial resolution [40–43]. We defined “Aβ deposition” as a global SUVR computed as the average of six regional SUVRs (anterior cingulate, frontal cortex, lateral temporal cortex, parietal cortex, precuneus, and anteroventral striatum), resulting in a continuous variable. Four participants were missing PiB-PET data, and these participants were excluded from the corresponding analyses only (i.e., correlation between SCD symptoms and Aβ deposition, voxel-wise regression analysis for the association between activation and Aβ deposition).
MRI data analysis
Preprocessing
MR data underwent standard preprocessing using Statistical Parametric Mapping (SPM12) toolbox in MATLAB2016b (MathWorks). Structural sequences were coregistered to the MPRAGE, bias-corrected, segmented into multiple tissue classes that generated a deformation field to normalize images to MNI (Montreal Neurological Institute) space. An automatic intracranial volume mask was generated using a threshold of 0.1 on gray/white/CSF (cerebrospinal fluid) followed by image filling and closing in MATLAB and applied to the MPRAGE to remove the skull.
Functional data was motion-corrected, coregistered to the skull-stripped MPRAGE, normalized (2 mm isotropic resolution), and smoothed using a Gaussian kernel with FWHM of 8 mm. We computed five summary measures of motion using the ArtRepair toolbox (http://cibsr.stanford.edu/tools/human-brain-project/artrepair-software.html).
We computed the mean volume of the left and right hippocampus using FIRST in FSL (FMRIB Software Library) on the skull-stripped MPRAGE. FIRST uses a model-based approach to segment subcortical structures using Bayesian shape and appearance models.
Modeling task effect (voxel-wise one-sample t-test)
We modeled encoding (i.e., experimental condition: novel face-name pairs) and recognition (i.e., control condition: familiar face-name pairs) tasks (convolved with the canonical hemodynamic resp-onse function; all runs input into a single model) as well as the mean of the signal and six motion parameters from the alignment (independently modeled for each session). The model included a high-pass filter (1/128 Hz to account for drift, using a series of cosines) as well as an autoregressive filter to account for serial correlations due to aliased biorhythms/unmodeled activity. We computed the contrast encoding minus recognition. We then conducted a voxel-wise one-sample t-test (n = 63) on the parameter estimates in the statistical non-parametric mapping toolbox (SnPM13), which computes non-parametric p-values using permutation testing (5,000 permutations) and corrected for multiple comparisons by controlling the false discovery rate (FDR) rate < 0.05. We generated a mask based on this contrast, which was used in subsequent statistical analyses to limit the number of statistical tests computed to only regions that were activated by the task.
Voxel-wise regression analyses
We also used SnPM13 to conduct all voxel-wise regression analyses, which computes non-parametric p-values using permutation testing (5,000 permutations) and controlled the FDR at α< 0.05. For all these (voxel-wise regression) analyses, we controlled for age (mean-centered) and recruitment methods (i.e., community volunteers and memory clinic patients).
We tested voxel-wise associations between brain activation during memory encoding (outcome variable) and both SCD symptoms (n = 63) and Aβ deposition (n = 59) (predictor variables) separately. As an additional analysis to assess the effect of task-performance, we tested the voxel-wise association between brain activation during memory encoding (outcome variable) and post-scan recognition scores (predictor variables) (n = 61).
We also examined whether education moderated the relationship between brain activation during memory encoding and either SCD symptoms or Aβ deposition, respectively. We tested (voxel-wise) interactions between SCD symptoms and education (mean-centered scores) (n = 63) and between Aβ deposition and education (n = 59). Note that we investigated each hypothesis individually; since we make no claims about the hypotheses as a group (e.g., that “at least one” null could be rejected), we did not apply a multiple hypothesis correction.
Post-hoc adjustment of nuisance variables
We extracted activation from any significant regions associated with factors described above (in the “voxel-wise regression analyses” section) and conducted post-hoc adjustment for nuisance variab-les. To test the robustness of each extracted activation to nuisance variables (age, objective mem-ory scores, neuroticism, sex, post-scan recognition scores, hippocampal volume, recruitment methods, and five in-scanner motion measures), we conducted regression analyses (in R, https://www.r-project.org) with extracted mean activation (enco-ding-recognition contrast) from significant regions with an interaction (outcome variable). We first evaluated the variance inflation factor (VIF) to control multicollinearity and ensured that VIF < 5 [44]. One of the motion parameters (i.e., max range) was also highly co-linear with another motion parameter and was excluded from this adjustment. Recruitment methods displayed a VIF of ∼5 that was slightly higher than the threshold. Since this is a critical nuisance variable to control, we included this variable in the sensitivity analysis (see below). To test an omnibus effect, we first conducted the regression analysis without all nuisance variables except motion measures and recruitment methods, then we conducted the sensitivity analysis by repeating the regression including all nuisance variables. In these analyses (n = 56), participants who had missing data in any of these variables were excluded from the robustness testing. To check the normality assumption required for the linear regression, we ran the Shapiro-Wilk test (n = 56) on the regression residuals, finding them to be compatible with normality (W = 0.98, p = 0.52). We also evaluated potential outliers for each analysis by evaluating Cook’s distance of regression residuals.
Behavioral data analysis
Association between Aβ deposition and SCD symptoms
To understand the role of Aβ in SCD symptoms and memory encoding, we computed the Pearson’s correlations to assess the association of Aβ deposition with SCD symptoms (n = 59), as well as with objective memory (n = 57) (and within the two recruitment method groups, Supplementary Material).
Post-scan recognition scores (task performance)
We examined the factors that account for variance of post-scan recognition scores, fitting a linear regression on SCD symptoms, Aβ deposition, education, age, objective memory scores, neuroticism, sex, hippocampal volume, and recruitment methods (n = 55). We repeated the same analysis replacing the outcome measure with our objective memory score (based on Rey-Osterrieth complex figure test) to investigate how these factors account for variance of another objective measure of memory function (n = 55).
RESULTS
Participants
The details of participant characteristics per education group are shown in Table 1. Participants with post-college education were younger than those with some college and high school. There were no significant education group differences in SCD symptoms, task performance (post-scan recognition score), and in-scanner head motion parameters. In terms of AD biomarkers, Aβ deposition did not differ across education groups, but participants with post-college education showed greater hippocampal volume and higher objective memory scores than those with some college and high school. Mean objective memory task performance was comparable to published external norms of the modified Rey-Osterrieth test [32].
We also summarized participants’ characteristics per recruitment methods in Supplementary Table 1. Both recruitment groups did not differ in AD biomarkers, including global Aβ deposition, and hippocampal volume. Memory clinic participants showed higher SCD symptoms, were younger, had higher education, and higher neuroticism [15, 45]. Objectively measured memory scores were also higher in the memory clinic participants. Greater in-scanner head motion was observed in community volunteers.
Neural activation during memory encoding (task effect)
We observed greater activation during encoding compared to recognition (p < 0.05, voxel-wise FDR-corrected) in the expected bilateral hippocampus, visual processing areas, bilateral parietal cortex, and several frontal regions (Table 2 and Supplementary Figure 2).
Regions Showing Significant Activation during Memory Encoding
Regions that showed the significant main effect of the memory-encoding task (encoding > recognition) (p < 0.05, voxel-wise FDR-corrected, minimum cluster size = 20). *Note: Out of 4366 voxels, 36 voxels belonged to the left hippocampus and 44 voxels to the right hippocampus.
Moderation by Education on the Association between Memory Encoding Activation and SCD Symptoms
Regions that showed significant moderation effect by education on the association between SCD symptoms and brain activation during memory-encoding (p < 0.05, voxel-wise FDR-corrected, minimum cluster size = 10).
No main effects of indices of AD risk (SCD symptoms, Aβ deposition)
We found no significant direct associations between activation and either SCD symptoms or Aβ deposition (p < 0.05, voxel-wise FDR-corrected). There was no association between activation and post-scan recognition scores.
Moderating role of education on activation and SCD symptoms
The moderating effect of education on the association between brain activation and SCD symptoms (p < 0.05, voxel-wise FDR-corrected) was found in the executive control network (ECN), salience network (SN), and subcortical regions (Table 2, Fig. 1 left). For the ECN, we observed activations in right DLPFC extending to inferior frontal gyrus (IFG) and left inferior parietal lobule (IPL) extending to angular gyrus. For the SN, we observed activations in the right insula and dorsal anterior cingulate cortex (dACC). Subcortical regions included the midbrain, caudate/pallidum, thalamus, and putamen.
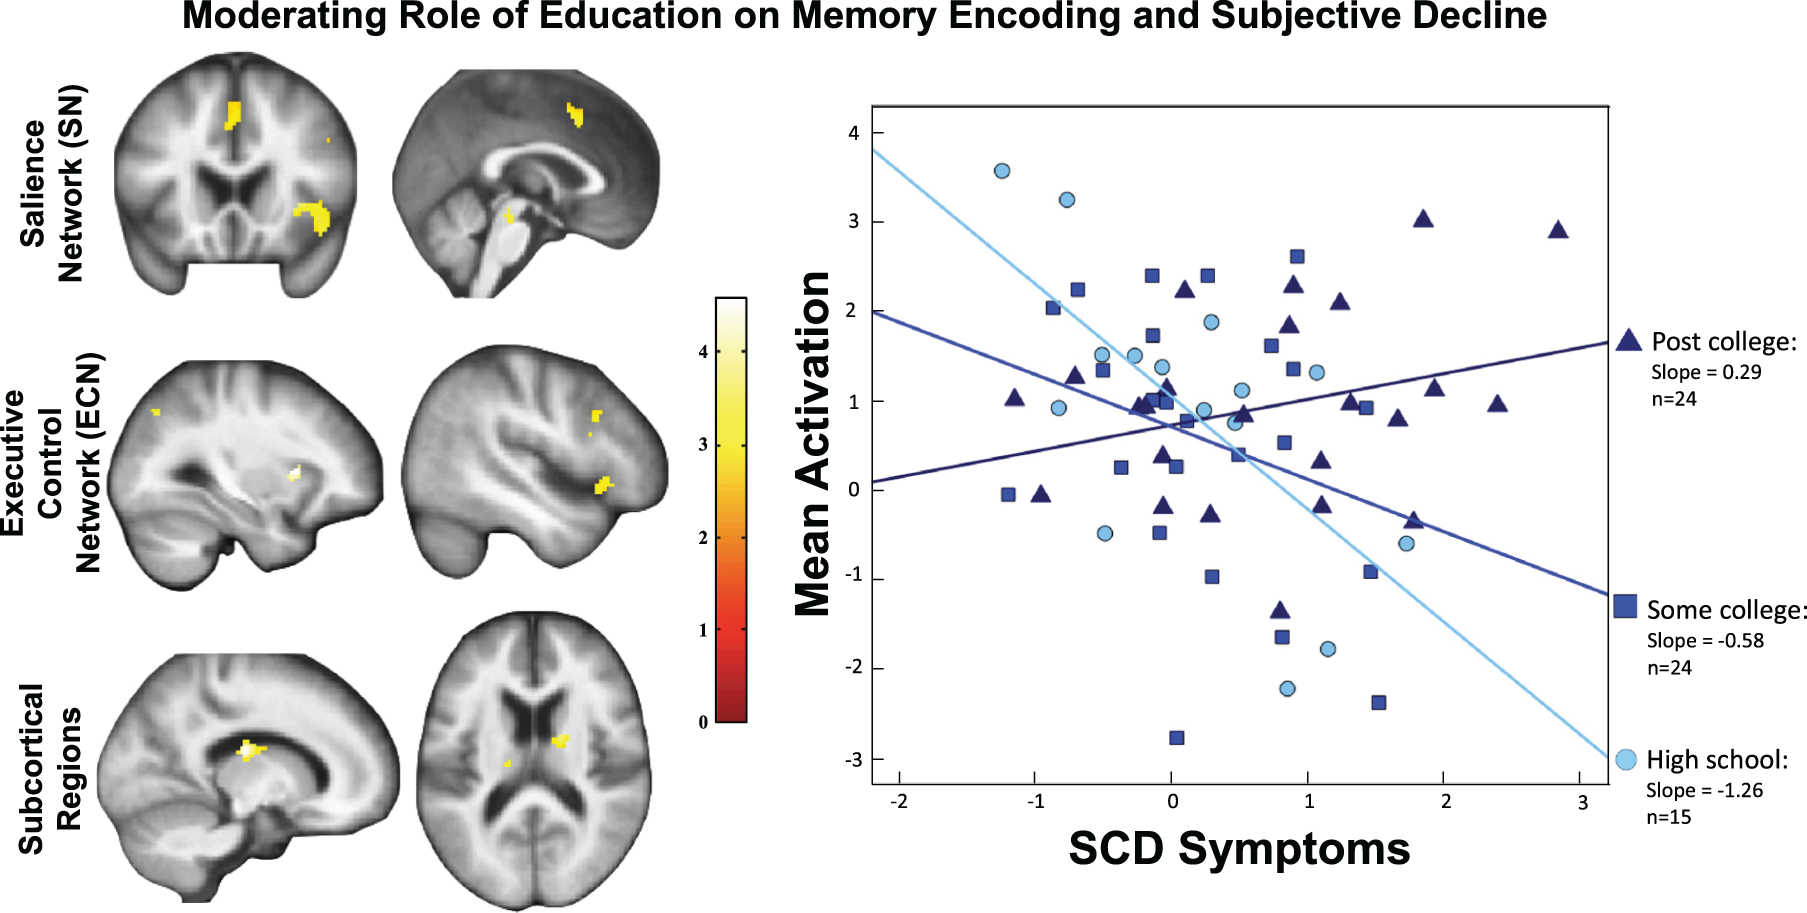
Left: The significant moderation effect by education on the association between SCD symptoms and brain activation was found in the salience network, executive control network, a set of subcortical regions (threshold: p < 0.05, voxel-wise FDR). Right: To visualize the moderation effect by education, we plotted the results by categorizing education levels (“High School” ≤12, 12 < “Some College” ≤16, and 16 < “Post College”). The regression slope was positive for the highest education group, and negative for the lowest education group.
Figure 1 (right) plots the associations between activation and SCD symptoms for each education group. The highest education group (post-college) had the highest slope, the lowest education group (high school only) had the most negative slope. This moderation effect (SCD symptoms by education) remained significant (β= 0.25, p = 0.001) when controlling for nuisance variables [with a moderately significant result of the omnibus test: R2 = 0.35, F(9,46) = 1.99, p = 0.06]. The moderation effect also remained significant (β= 0.23, p = 0.009) in the sensitivity analysis (Table 4). It also remained significant after eliminating one potential outlier identified by regression diagnostics (Cook’s D = 0.066).
Regression Analysis Summary for a Post-hoc Adjustment for Nuisance Variables: An Evaluation of the Robustness of the Interaction between SCD Symptoms and Education
Standardized β-values are reported.
Association between Aβ deposition with SCD symptoms
Aβ deposition was positively associated with SCD symptoms [r(57) = 0.26, p = 0.05] but not objective memory [r(55) = 0.03, p = 0.85] (Supplementary Figure 3) (similar results per recruitment method group; Results in Supplementary Material).
Explanatory factors for post-scan recognition
Lower post-scan recognition scores were asso-ciated with greater SCD symptoms, older age, and lower objective memory scores [R2 = 0.37, F(9,45) = 2.93, p = 0.008, Table 5 (Top)]. Lower obje-ctive memory scores were associated with lower post-scan recognition scores [Table 5 (Bottom)]. However, none of other predictor variables (SCD symptoms, Aβ deposition, education, age, neuroticism, sex, hippocampus volume, and recruitment methods) showed a significant association [R2 = 0.26, F(9,45) = 1.78, p = 0.09, Table 5 (Bottom)].
Regression Analysis Summary: An Evaluation of Explanatory Factors for Post-Scan Recognition Scores and Objective Memory Scores
Standardized β-values are reported.
DISCUSSION
We examined brain activation during memory encoding and its association with SCD symptoms and Aβ, as well as the role of education, a proxy for cognitive reserve. In participants with higher reserve (education), greater SCD symptoms were associated with greater activation in the executive control network (ECN), salience network (SN), and subcortical regions; however, in participants with lower reserve (education), greater SCD symptoms were associated with lower activation in the same regions. Aβ was not associated with activation during memory encoding. Similar to previous findings [3, 5], greater Aβ deposition was associated with greater SCD symptoms but not with objective memory. These findings suggest that individuals with higher cognitive reserve may recruit an extended neural network in the context of emerging signs of AD risk (i.e., SCD symptoms and Aβ) [46]. The observed different activation patterns reflecting cognitive reserve also delineated the heterogeneity of SCD in terms of neural function, as well as the distinct types of AD risk based on the level of cognitive reserve (i.e., high reserve—SCD is an index of saturation of neural compensation, low reserve—SCD is an index of diminishing neural resources).
Cognitive reserve in extended neural networks
Previous fMRI studies using this memory-encoding task have observed engagement of extended networks along with hippocampus [21, 22]. While the hippocampus plays a central role in encoding [20], we found an extended neural network that may coordinate other aspects of information processing during encoding. The ECN is involved in attention, inhibition, and shifting [47]. The SN selectively transmits subjectively relevant sensory information to higher-order cognitive regions [48], facilitating flexible executive functioning. Regarding subcortical regions, the thalamus may belong to an extended memory system by connecting frontal cortex and hippocampus [49] while basal ganglia (e.g., caudate) are a core structure for reward learning [50]. The combinations of these regions may constitute the conflict monitoring network by integrating incoming sensory information and providing feedback control based on outcomes in order to produce successful adaptive goal-directed behaviors [51]. In SCD, the subjective experience of cognitive decline in daily cognitive activities may reflect higher cognitive load of continuously adjusting predictions for errors (i.e., conflict) between one’s prediction and outcomes [52]. Lastly, our cognitive reserve findings were specifically linked to memory encoding function rather than indicating the general neural network underlies resilience against aging pathologies. Although our approach targeted to identify the neural substrate of cognitive reserve associated with the core AD symptom (i.e., memory), future studies should expand investigation of neural substrates for cognitive reserve not only in task-based fMRI signals with other cognitive tasks but also in intrinsic neural activities (i.e., task-general/free MRI measures) in SCD.
Moderating role of education and possible neural compensation
We investigated the neural correlates of SCD symptoms, focusing on the cognitive reserve theory to understand individual differences. Greater activation was observed among participants with greater SCD symptoms and higher education (Fig. 1). This heightened neural recruitment during memory encoding may suggest a compensatory process in response to emerging pathological changes of the brain [7, 9], manifested as SCD symptoms that were positively correlated with Aβ deposition in this study. It may be that lower education (lower cognitive reserve) is associated with lower capacity to mount a compensatory response. Greater cognitive reserve has been reported to be associated with slower cognitive decline among Aβ positive older adults with normal cognitive function and MCI but faster decline with AD [46]. The present study may provide evidence of an early compensatory process among cognitively normal individuals with high AD risk (i.e., elevated SCD symptoms which may in part reflect levels of Aβ deposition).
Previous SCD studies [7, 9] described increased activation as neural “compensation” because performance was positively associated with brain activation, suggesting that greater activation facilitated memory task performance. Our study did not find an association between task performance and activation. However, due to the cross-sectional nature of these studies (including this study), it is unclear whether individuals with greater SCD symptoms would have had better performance or higher baseline activation prior to onset of SCD symptoms. Thus, we cannot distinguish whether greater activation represents neural compensation, disrupted over–activation known as dedifferentiation [53] or excitotoxic neuronal damage [54]. Nonetheless, our study is the first to our knowledge to report an indirect relationship between brain activation and SCD.
As stated above, task performance (i.e., an index of successful encoding) was not associated with brain activation. In our cognitively normal participants sample, older participants performed worse. Interestingly, participants with greater SCD symptoms performed worse as well, consistent with face-name associative memory deficits in SCD reported previously [55]. These results suggest that this task may serve as a useful sensitive objective measure for subtle memory decline.
Lastly, Aβ deposition was not associated with brain activation during memory encoding. Previously reported altered neural activation during memory tasks in SCD was suggested to be a response to accumulating AD pathology although any AD pathological factors including Aβ were not measured in these studies [8, 9]. In cognitively normal older adults, medial temporal hyperactivation during the face-name memory encoding task was associated with greater Aβ deposition [21, 57]. This includes a previous report of our own with some overlapping participants [21]. A salient difference between these prior studies and the present one is the whole brain voxel-wise analysis approach to test the effect of Aβ deposition. Inconsistent findings may suggest that Aβ deposition might not play a robust role as a biomarker with direct functional impact; alternatively, other important and unmeasured factors may moderate the relationship between Aβ deposition and neural function during memory encoding. It is also important to note that no association between Aβ deposition and brain activation in this study could be accounted for by low variability in global Aβ among our participants. Future and larger studies should investigate 3-way interaction effects among Aβ deposition, SCD symptoms, and cognitive reserve markers (e.g., education) to better understand cognitive reserve as a moderator of biomarker-behavior associations. As reported previously, we observed a positive association between Aβ deposition and SCD symptoms [3, 5]. Aβ deposition predicts clinical progression in cognitively normal individuals [58], as do elevated SCD symptoms [59]. SCD symptoms likely represent different degrees and patterns of AD risk in terms of underlying neural processes across individuals, depending on cognitive reserve and other moderating factors [60].
Limitations
In this study, education was the sole index of cognitive reserve, which may limit the generalizability of our results. Education is commonly used as a proxy for cognitive reserve [61, 62]; however, other estimates of cognitive reserve (e.g., literacy [63], cognitively-engaging leisure activities [10]) should be investigated. Furthermore, most participants in our ‘lower’ education group were high school graduates. Therefore, our results should be confirmed with larger samples with a broader range of education levels and other measures of cognitive reserve.
Combining participants from two recruitment methods (memory clinic and community study settings) ignores any qualitative differences in meaning and significance of SCD symptoms between the two samples [6, 64]. Given our current sample size, power was limited to test the interaction between education and SCD symptoms separately for each recruitment method. Future studies should address factors underlying medical help-seeking behavior as an index of AD risk [24, 65].
CONCLUSION
The current study investigated the neural correlates of SCD symptom and Aβ deposition effects on memory encoding, observing that brain activation depended neither on SCD symptoms nor Aβ directly. Rather, level of education moderated the association between brain activation and SCD symptoms. Individuals with higher education and greater SCD symptoms displayed greater activation, whereas those with lower education and greater SCD symptoms displayed lower activation. Greater SCD symptoms may reflect a saturation of neural compensation in individuals with greater cognitive reserve, while it may reflect diminishing neural resources in individuals with lower cognitive reserve.
Footnotes
ACKNOWLEDGMENTS
This study was supported by grants T32 MH019986, T32 AG021885, P50 AG005133, P01 AG025204, and R37 AG025516 from the National Institute of Health.
GE Healthcare holds a license agreement with the University of Pittsburgh and may potentially benefit from the results of this study. Given that Drs. Klunk and Mathis are co-inventors of PiB, they have a financial interest in this license agreement. GE Healthcare did not provide grant support for this study nor charge for our use of PiB.