
Abstract
Background:
Biomarkers of neurodegeneration play a major role in the diagnosis of Alzheimer’s disease (AD). Information on both amyloid-β accumulation, e.g., from amyloid positron emission tomography (PET), and downstream neuronal injury, e.g., from 18F-fluorodeoxyglucose (FDG) PET, would ideally be obtained in a single procedure.
Objective:
On the basis that the parallelism between brain perfusion and glucose metabolism is well documented, the objective of this work is to evaluate whether brain perfusion estimated in a dual-point protocol of 18F-florbetaben (FBB) PET can be a surrogate of FDG PET in appropriate use criteria (AUC) for amyloid PET.
Methods:
This study included 47 patients fulfilling international AUC for amyloid PET. FDG PET, early FBB (pFBB) PET (0–10 min post injection), and standard FBB (sFBB) PET (90–110 min post injection) scans were acquired. Results of clinical subjective reports and of quantitative region of interest (ROI)-based analyses were compared between procedures using statistical techniques such as Pearson’s correlation coefficients and t-tests.
Results:
pFBB and FDG visual reports on the 47 patients showed good agreement (k > 0.74); ROI quantitative analysis indicated that both data modalities are highly correlated; and the t-test analysis does not reject the null hypothesis that data from pFBB and FDG examinations comes from independent random samples from normal distributions with equal means and variances.
Conclusions:
A good agreement was found between pFBB and FDG data as obtained by subjective visual and quantitative analyses. Dual-point FBB PET scans could offer complementary information (similar to that from FDG PET and FBB PET) in a single procedure, considering pFBB as a surrogate of FDG.
Keywords
INTRODUCTION
The most important advance in the diagnosis of Alzheimer’s disease (AD) over recent years has been the development and validation of biomarkers of the neurodegeneration process. These have had a direct impact on clinical practice [1] and investigation [2] and have proven critical in the early stages of disease [3]. According to the amyloid cascade hypothesis [4], biomarkers are divided between diagnostic or pathophysiological, e.g., amyloid positron emission tomography (PET), and prognostic or topographical indicators of the progression of AD, e.g., 18F-fluorodeoxyglucose (FDG) PET [5]. The ideal approach would be to obtain information on amyloid-β (Aβ) accumulation and downstream neuronal injury in a single procedure, and various dual-phase or dual-point protocols have been proposed for amyloid PET scans, comprising: a first perfusion (p) or early acquisition within the first few minutes after radiotracer injection; and a second, standardized (s) acquisition according to the kinetics of the radiopharmaceutical [6–12].
The majority of amyloid PET radiopharmaceuticals are lipophilic agents, which are the usual tracers for single photon emission computed tomography studies of regional cerebral blood flow (rCBF), and their early acquisition could be considered a surrogate of cerebral perfusion and closely related to the regional cerebral metabolic rate of glucose (rCMRglc). This parallelism between rCBF and rCMRglc metabolism has been demonstrated both in healthy individuals and in patients with AD [6]. The use of early amyloid PET to estimate cerebral glucose metabolism has been reported in double-tracer kinetic models using FDG with Pittsburgh Compound B (PiB) [7] and Florbetapir [8]. However, there have been few studies on its utilization with 18F-Florbetaben (FBB), a stilbene derivative used as tracer for Aβ plaque and chemically similar to PiB and Florbetapir [9–13].
Studies of FBB indicated its potential value as a tracer for CBF and cerebral glucose metabolism, avoiding the classical approach based on arterial blood sampling [9]. The regional tracer delivery rate constant (K1) is relatively high (
MATERIALS AND METHODS
Participants
This prospective case series included patients from two level-three hospitals (A: 1.75×10⁶ inhabitants; B: 1.5×10⁶ inhabitants) who fulfilled clinical AUC for amyloid PET scan according to international [17] and local [18, 19] consensuses (inclusion criteria details are given in Supplementary Material 1). A total of 47 patients were recruited consecutively without randomization between January 2014 and December 2015. They were evaluated by experienced neurologists by means of medical interviews and physical and neurologic examinations that examined the domains of orientation, attention, memory, executive function, language, visual and constructive functions, and behavior (please see the Supplementary Material 2 for further details). The evaluation included FDG PET and FBB PET examinations, with mean interval between FDG and FBB scans of 5.08 weeks (standard deviation: 2.76 weeks; range: 1–12 weeks). Specific details about the imaging protocol are given in Table 1. All participants gave their written informed consent to participation in the study, which complied with the principles of the Helsinki Declaration and was approved by the hospital Ethics and Investigation Committee.
Preprocessing of the data
After the acquisition and proper reconstruction [22], neuroimaging data of three modalities were preprocessed in order to make the data from different subjects comparable. This procedure was divided into two steps: spatial registration and intensity normalization. The former was carried out using the template matching approach implemented in Statistical Parametric Mapping (SPM) version 12 [23], which ensures that any given voxel in different images corresponds to the same anatomical position. This procedure is based on the SPM unified segmentation algorithm [24] and involves an affine transformation that maximizes the mutual information between a given image and a tissue probability map. The probability maps provided by SPM were used, obtaining neuroimages with 2×2×2 mm. voxels in Montreal Neurological Institute (MNI) space. The normalization of the voxel intensity performed after the spatial registration was intended to remove differences due to the use of different acquisition protocols/equipment and to differences in the amount of radiopharmaceutical injected to each subject [25]. To this end, the intensity of the voxels of a given neuroimage was divided by a value I cer obtained as the mean intensity of cerebellar voxels. This region is known to be not affected by AD, thus its mean voxel intensity should be similar for all subjects. Indeed, the cerebellum has been recently suggested as the optimal reference region to measure amyloid changes in FBB data [26]. Finally, the voxels of each neuroimage were scaled to be in the interval [0,1]. This enhances the intensity normalization and should not affect the information contained in the images (after normalizing to the cerebellum, same maximum intensity is expected for all subjects). The preprocessing of the data was performed by a non-clinical researcher blinded to any information on the patient, including examination type and center of origin.
Subjective evaluation and final diagnosis
Once the imaging datasets were preprocessed, they were randomized and delivered to the clinical researchers for retrospective evaluation and a clinical report. Both centers followed a similar standardized protocol, recording visual subjective evaluations of FDG and sFBB scans in accordance with international recommendations [21, 27] and producing a primary report. Note that the pFBB is not reported in the routine clinical protocol. For the purpose of standardization, pFBB and FDG reports adopted the following classification system: 0) normal, with no relevant findings (NF); 1) compatible with well-known AD pattern [28], hypometabolism in one or more of the following: posterior cingulate cortex, precuneus, posterior temporoparietal cortex, and medial temporal lobe; 2) non-normal/non-AD (NoN/NoAD); and 3) hypofrontalism, added post-hoc as a category during the analysis. The sFBB was reported blinded to the clinical information as positive (loss of grey-white matter contrast), negative (good grey-white matter contrast), or inconclusive for amyloid plaque presence. This visual evaluation was performed using the MRICRON software with grey scale (white for background, black for brain). In discrepant cases, third consensual reports for pFBB and FDG were obtained, maintaining the blinding conditions and only using the results in the data analysis.
The final diagnosis was established after a period of clinical follow-up (mean: 25.1 months; standard deviation: 7.25 months; range: 12–43 months) and was based on the results of cognitive-behavioral tests and diagnostic procedures and on the clinical course. It classifies the patients as: a) AD; b) non-AD primary cognitive impairment: frontotemporal dementia, vascular dementia, and mixed dementia; c) psychiatric pathology, and d) other type of cognitive impairment of unknown origin (non-AD dementia/Non-filiated). The final diagnosis for each patient is shown in Supplementary Table 2.
Quantitative analysis
Several statistical tests were performed to compare pFBB and FDG uptake patterns. To this end, preprocessed data (in MNI space) were parceled by means of the automated anatomical labeling (AAL) atlas [29]. The mean intensity of each AAL-region was statistically analyzed to compare pFBB and FDG data. Experiments based on Pearson’s correlation and t-test were performed.
Pearson’s correlation coefficient
The Pearson’s correlation coefficient, ρ, of two variables A and B, is defined as the covariance of A and B divided by the product of their standard deviations:
A confidence interval for ρ (A, B) can be estimated using the Fishers z-transformation (a direct estimation is complicated due to ρ is not normally distributed). The Fishers z-distribution is approximately normally distributed and has a standard error of:
t-test
pFBB PET and FDG PET uptake patterns were compared using a t-test to evaluate the null hypothesis that regions in the two neuroimaging modalities have same mean intensity values:
RESULTS
Concordance between clinical reports and agreement with final diagnosis
Subjective reports for pFBB and FDG images are shown in Table 2. As it is shown, all clinical researchers agreed on the pFBB report except for one case (patient #19, shown in Fig. 1, row d), which was finally considered by consensus as inconclusive. pFBB and FDG reports coincided in 38 cases: 19 with posterior AD pattern; 14 with normal pattern, 3 with hypofrontalism, and 2 with non-normal/non-AD pattern. A final consensus report was necessary in 9 patients. The kappa index for the agreement between pFBB and FDG scan reports from each examiner was ranged between 0.79 and 0.86 (kappa weighted: 0.75 – 0.78; p < 0.0001). Blinding for the type of examination (FDG or pFBB) was initially considered but finally not imposed because of the ease with which they could be differentiated based on the much higher uptake of pFBB versus FDG in subcortical regions (basal ganglia, thalamus and posterior fossa) (Fig. 1).

Illustrative cases from study group (# number of patient in Table 2). Row a (#16): AD posterior hypometabolism pattern in pFBB and FDG; sFBB (+). Row b (#14): NoN/NoAD because of asymmetric hypometabolism in anterior left temporal on pFBB and FDG; sFBB (+). Row c (#15): pFBB and FDG considered as NoN/NoAD because of hypometabolism in both periinsular regions and temporal operculum; sFBB (+). Row d (#19): pFBB and FDG considered NoN/NoAD due diffuse hypometabolism in right hemisphere, lower in right temporal lobe; sFBB was considered inconclusive due to asymmetry in frontal lobe with no definitive uptake in grey matter in left hemisphere. Row e (#3): sFBB and FDG were positive and pFBB was considered as normal. Row f (4): sFBB (+); pFBB and FDG were normal. Row g (#37): FDG showed discrete frontal hypometabolism suggesting depressive pseudodementia; pFBB was considered normal and sFBB (–). Rows h and h (#26): sFBB (–) in a patient finally considered as early AD by cerebrospinal fluid biomarkers and clinical follow-up. FDG (May 14), sFBB (Mar 14) and pFBB (Nov 15) were considered normal. Row i (#41): sFBB was normal, while pFBB and FDG showed diffuse posterior hypometabolism relative anterior pole. Color Bar: To enhance findings FDG column is showed at 0.95/0.15; pFBB: 0.90/0.20 and sFBB: 0.95/0.10. Relevant findings are shown with arrows.
Reports for pFBB and FDG scans. Possible values were: 0) No Findings; 1) AD pattern; 2) Non-normal/non-AD pattern; and 3) Hypofrontalism. Cohens kappa coefficient, K, and K-weighted, K w , are shown in last rows
Regarding the agreement between the image reports and the final diagnosis of the patients, the following results were obtained: In the subgroup of 26 patients with a final diagnosis compatible with AD, sFBB was positive in 25 (true positive [TP]), FDG was positive in 20, and pFBB was positive for AD in 18. In the subgroup of 21 patients without a final diagnosis compatible with AD, sFBB was negative in all patients (true negative [TN]), FDG scan was normal in 11 of these patients, showing an AD pattern in four, hypofrontalism in five, and non-AD/non-normal pattern in one. The pFBB scan was normal in 16 of these 21 patients and showed an AD pattern in one, hypofrontalism in three, and non-AD/non-normal pattern in one. In general, a higher proportion of scans were normal with pFBB than with FDG (6 versus 0 in discrepant patients and 20 versus 13, respectively, in the global population; Mc Nemar-test; p = 0.051).
Quantitative analysis
First, the existence of confounding effects due to the acquisition center was discarded by means of a voxel-wise statistical analysis [30]. Specifically, we performed a 2×2 factor analysis on SPM to evaluate the presence of significant center×modality interactions. To this end, general linear model at each voxel was fit with center and modality as fixed factors and age as nuisance covariate [31]. As a result, no important clusters were found as main effect of center or modality (Fig. 2). In both cases, statistical outcomes were corrected for multiple comparisons using the widely used family-wise error (FWE) rate of 0.05.
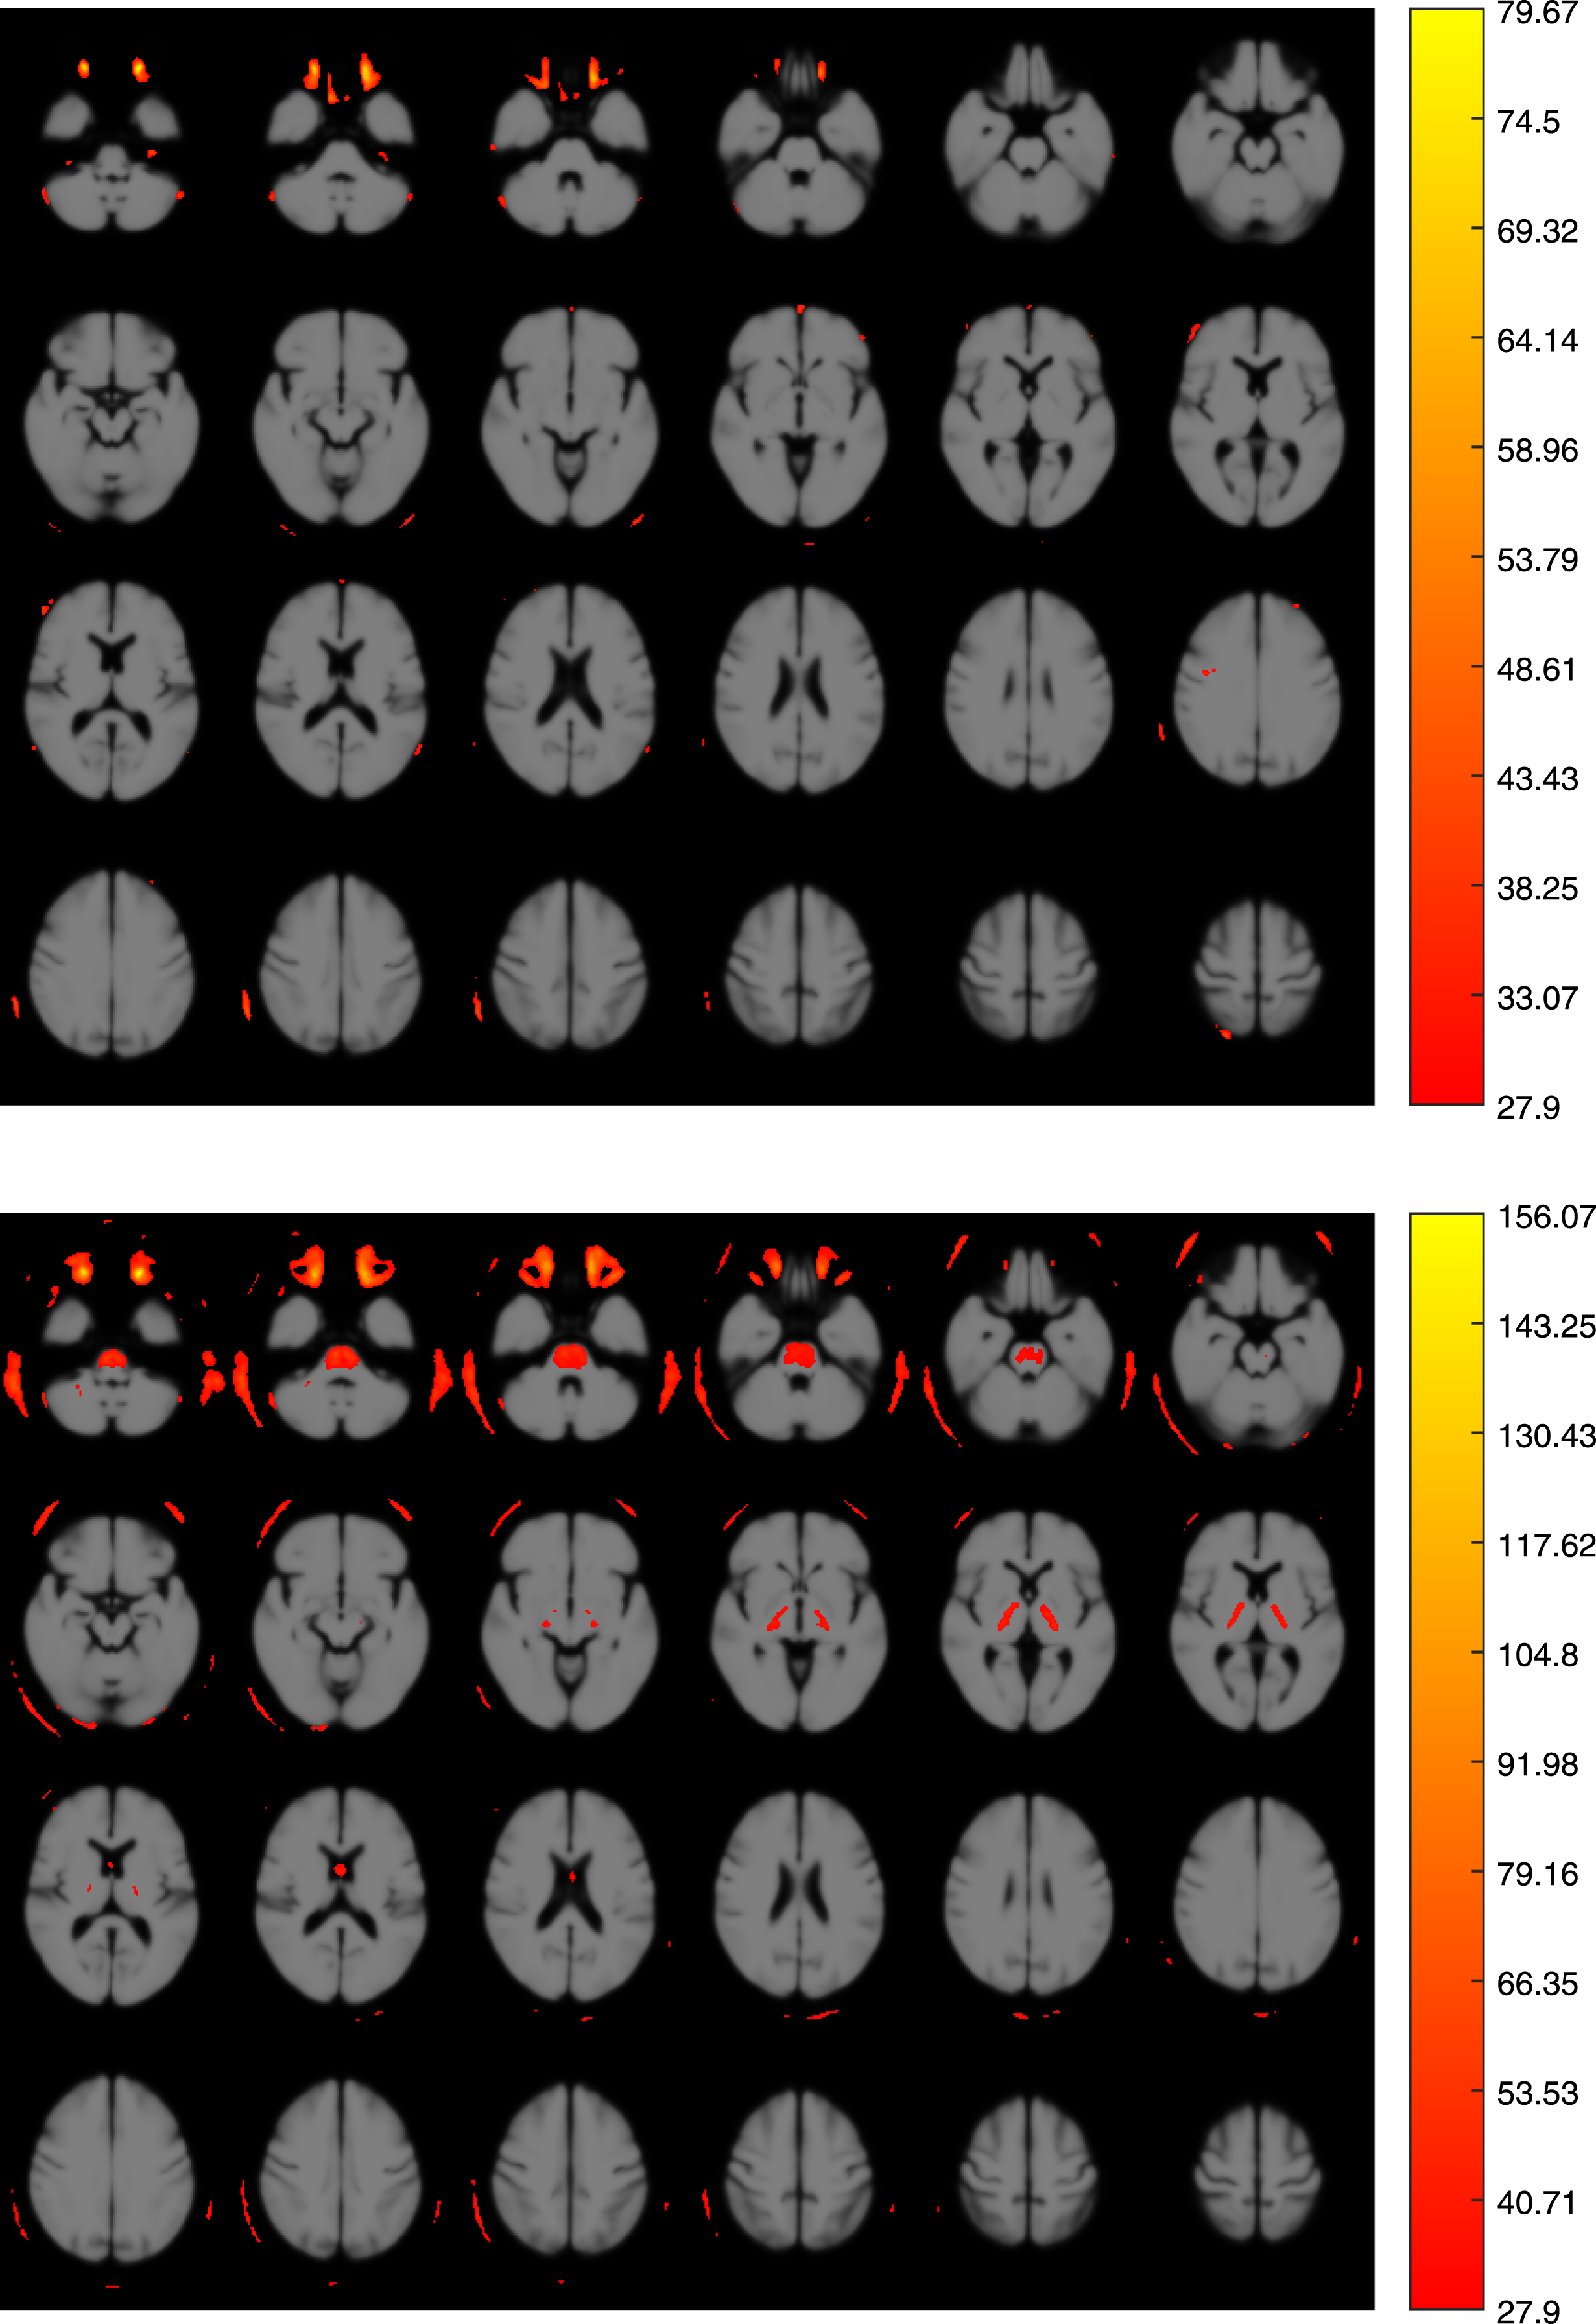
Voxel-wise factor analysis evaluating the presence of significant center×modality interactions (p < 0.05, FWE). Top: Main effect of center. Bottom: Main effect of modality. In both cases the subjects’ age was used as nuisance covariate. The color scale represents the F-values.
Subsequently, the intensity profile of pFBB and FDG data was analyzed, obtaining a high level of similarity. Figure 3 shows the mean intensity per region in pFBB and FDG data. This was computed from the normalized voxel intensities and using the AAL atlas to parcel the brain regions. This atlas divides the brain volume into 116 regions of interests (ROIs).

Comparison of the mean intensity per AAL region in pFBB and FDG data. The regions are grouped according to the brain structure to which they belong (SGN stands for subcortical gray nuclei).
The relation between the intensities of pFBB and FDG data was also analyzed in terms of the Pearson’s correlation coefficient. The result is shown in Fig. 4. Confidence intervals of correlation coefficients for regions with largest correlation are shown in Fig. 5.

Brain map containing the Pearson’s correlation coefficient between pFBB and FDG data. The coefficient was calculated for each of the 116 regions in which the brain volume was divided. Axial slices at position – 28, – 26, – 23,..., 56 mm from the anterior commissure are shown.

Pearson’s correlation coefficients between pFBB and FDG data for the 20 brain regions with largest correlation.
The similarity between pFBB and FDG examinations was also analyzed through Bland-Altman plots [32], a graphical method widely used in medical statistics. For this analysis, original AAL ROIs were grouped in 10 meta-ROIs [33]: frontal (superior, middle and inferior frontal gyri), medial temporal (hippocampus, parahippocampus, lingual, and fusiform gyri), lateral temporal (superior, middle, and inferior temporal gyri), posterior cingulate, anterior cingulate, parietal (upper and lower lateral remainders), occipital (lateral remainder and cuneus), striatum, talami, and precuneus. A Bland-Altman plot was built for the mean intensity of each meta-ROI. In particular, the differences between the values from pFBB and FDG examinations were represented against the averages of the two scans. The result is shown in Fig. 6.

Bland-Altman plots for the mean intensity of 10 AD target metaROIs [33]. Limits of agreement were defined as±1.96×SD and represented with a dotted line. AD and non-AD patients are respectively represented by red squares and blue circles.
Finally, we carried out a t-test analysis for the null hypothesis that data from pFBB and FDG examinations come from independent random samples from normal distributions with equal means and variances. As in previous experiments, this analysis was performed per region, thus the result was an estimation about whether data of a region from pFBB or FDG can be considered to come from same underlying distribution (null hypothesis could not be rejected) or not (null hypothesis was rejected). At the 5% significance level, the null hypothesis was rejected for 66 regions, therefore we can assume that pFBB and FDG examinations provide similar data for the 50 remaining regions. Figure 7 shows those 50 regions over an MRI template.

Regions in which the t-test analysis does not reject the null hypothesis consisting on data from pFBB and FDG examinations come from independent random samples from normal distributions with equal means and variances. The color scale codifies the p-value associated with each region.
DISCUSSION
This study was designed to assist clinicians in the management of patients with symptoms of cognitive impairment. The main objective was to assess whether pFBB can be used as a surrogate of FDG for AD diagnosis. Additionally, we evaluated the influence of FBB images (including both, early and standard acquisitions) in the diagnosis of this disorder. The use of a dual-point protocol could add obvious advantages since it allows obtaining information from two biomarkers in a single procedure, including reduced cost, lower radiation exposure, and greater convenience for patients and caregivers [34].
Equivalence between pFBB and FDG data
The equivalence between pFBB and FDG images can be analyzed using multiple ROIs (whole brain) at once (high sample demand), using specific diagnostic target ROIs [12, 35] or using the overall observed pattern, which is the usual clinical procedure. This work intends to cover all these three scenarios. On the one hand, the evaluation and comparison of clinical reports allows us to analyze the similarity between pFBB and FDG examinations using global patterns that are visually detectable. On the other hand, the quantitative analysis evaluated the between-procedure agreement in standard ROIs than can be grouped to form disease-specific ROIs (as in Bland-Almant plots shown in Fig. 6). Both analyses corroborated our assumption of similarity between pFBB and FDG scan findings. Table 2 and, in particular, Cohens kappa coefficients reported in last rows suggest that pFBB and FDG provide clinical information (and contain global patterns) that lead to very similar diagnostic results.
At the ROI level, we found a high between-procedure similarity that can be clearly seen in Fig. 3. Despite the differences in regions 11–15 (located in the inferior frontal gyrus), most of the regions have similar mean intensity in pFBB and FDG scans. Nevertheless, it should be noted that pFBB and FDG images can be visually distinguished after a short period of visual training, due to the higher uptake in basal ganglia, thalamus and posterior fossa in pFBB scans [8], which could be explained by their greater perfusion with respect to their rCMRglc [36, 37]. These differences were reported by other authors in midbrain and thalamus using a similar approach [12].
Similarities between pFBB and FDG data were corroborated by a correlation test. The map presented in Fig. 4 contains large brain areas with a moderate amount of correlation and two regions clearly highlighted: caudate nucleus and Heschl gyrus. Moderate values and the not small confidence intervals shown in Fig. 5 can be explained by the reduced sample size (n = 47 measures), which limits the significance of the results. This issue is also noticeable in the p-values obtained in the t-test. Regardless of this, the t-test did not reject the null hypothesis for a large number of regions (shown in Fig. 7), including medial temporal, lateral temporal, and frontal which are usually related to AD and to the differential diagnosis of several types of dementia. This is consistent with the results of the correlation analysis and suggests that pFBB and FDG has similar values in those regions.
In addition, Bland-Altman plots shown in Fig. 6 also indicate a reasonable level of agreement between pFBB and FDG examinations. In this analysis, we did not use the AAL ROIs but AD specific target ROIs (or meta-ROIs as each of them is composed by several AAL ROIs). For the 10 examined meta-ROIs, all but two measures (one of them is clearly an outlier) are within the limits of agreement of the model, which were defined as±1.96×SD, following widely-accepted criterion. As can be seem, the between-procedure differences are equally distributed along the abscissa axis, indicating they do not depend on the region mean. Bland-Altman plots also suggest that there are no important discrepancies between AD and non-AD patients in terms of differences between pFBB and FDG scans. However, AD patients appear to have smaller pFBB and FDG mean in parietal, occipital, and precuneus. This fact can be explained by a further neural degeneration in these regions which is reflected in both scans.
Limitations of this work
All in all, our findings suggest that the perfusion phase of FBB PET provides information on the CBF, which is closely correlated with glucose metabolism, although we agree with Garibotto et al. that caution should be taken in extrapolating these results to routine clinical practice [16]. In addition, our study has two limitations that should be considered. First, our working hypothesis of a similarity between pFBB and FDG was not supported by specific kinetics reports or by estimations of the rCBF using other procedures, e.g., H2O, arterial spin label MR, or SPECT-PCR [6, 38]. We based our assumption on previously published data [10, 33]. Thus, the theoretical model suggests that tracers with high lipophilicity have a high first-pass influx rate (K1), and early imaging provides information on K1 related to CBF coupled with glucose metabolism [8, 39]. A recent kinetic study confirms these preliminary assumptions [13]. The second limitation regards our assessment of the diagnostic performance of the procedures. We have avoided the term diagnostic accuracy because of the following biases: 1) the imperfect nature of the gold standard used (with no pathological confirmation) and inclusion of the results of tested procedures in the final clinical diagnosis; 2) the shortcomings of clinical assessment, even using highly restricted criteria; and 3) the absence of a group of healthy controls or of patients with other known diseases or in different stages of AD.
Comparison with previous works
In general terms, our results agree with those of previous works using dual-point acquisitions of FBB PET [10, 12]. However, the comparison with those previous studies should consider differences in the patient inclusion criteria. For example, the retrospective series studied by Tiepolt et al. [12] (n = 22) included patients fulfilling criteria of probable (n = 6) and possible (n = 2) AD, dementia of unknown origin (n = 4), MCI (n = 2), and patients to rule out AD (n = 8). Similarly, the prospective series analyzed by Daerr et al. [10] (n = 33) includes patients with a clinical stage of dementia (n = 22, of which 11 were diagnosed as likely AD, 4 as likely frontotemporal lobar degeneration, 5 ambiguous, 1 case of primary progressive aphasia and 1 case of corticobasal degeneration) and MCI (n = 11). As the authors admitted, the populations of these works suffer from neurodegeneration at advanced stages and, strictly, they cannot be considered as AUC cases. Our work, instead, includes a larger population (n = 47) with a relevant proportion of atypical early-onset variants (53.2% of total), probably in early stages (non-demented) and therefore corresponding to AUC cases. This fact could explain the moderate correlation rates obtained in our experiments. Nevertheless, our results agree with the conclusion of previous works and support that pFBB could be considered a surrogate of FDG.
In our study population, a pattern compatible with AD was identified on both pFBB and FDG scans from one patient in the non-AD subgroup (Fig. 1; row i:#41), while an AD pattern was not observed on the pFBB scan of four patients with a final diagnosis of AD. There was a higher proportion of “normal” reports for pFBB than for FDG scans, suggesting that pFBB may be a less sensitive procedure. A lesser sensitivity than FDG has also been reported for PiB [35, 42] and Florbetapir [8], although comparisons among studies are hampered by differences in kinetic methodology, radiopharmaceuticals, and populations, among other variables. We agree with the proposal by Fosberg et al. [35] that rCMRglc reflects not only the blood flow but also the cerebral metabolism impairment due to loss of synaptic activity, whereas rCBF reflects the impairment due to decreased neuronal activity and a neuronal loss. It should be borne in mind that our study population was younger in comparison to previous reports and were probably in earlier stages of the disease. Furthermore, changes in rCBF are later than in rCMRglc in the cascade of biomarkers [5, 38].
Given the aforementioned limitations of our study (inadequate gold standard and the predominance of sFBB data in final diagnosis), we are unable to verify the report by Fu et al. [42] that higher diagnostic accuracy is provided by the combination of FDG+sFBB than by pFBB+sFBB. However, our findings suggest a higher specificity (capacity to correct non-AD classification) and lower sensitivity (capacity to correct AD classification) for pFBB than for FDG, which may therefore assist in the diagnosis of patients with an inconclusive sFBB scan.
Our quantitative analysis found a good correlation between pFBB and FDG, as also reported between FDG and PiB [6], florbetapir [8], or FBB [10, 12]. However, we observed a difference in final reports between the procedures. Reports on the pattern of changes were similar, but pFBB reports appeared more likely to be normal, as already noted. However, interpretation of this difference is unclear, given that brain amyloid accumulation, atrophy, and CBF changes have been detected by 15OH2O PET in cognitively healthy controls [43]. Interestingly, Matsson et al. found no difference in CBF (by MRI-arterial spin labeling) between cognitively healthy controls and patients with early or late MCI when the Aβ load was not considered, whereas there was an association between MCI and CBF reduction when this was considered, regardless of cognitive status [44].
The impact of pFBB in the final diagnosis differs in positive and negative sFBB scenarios. When positive sFBB, a pFBB examination could help to estimate the impairment severity. Although we did not specifically examine the role of pFBB (or FDG) data as a progression biomarker, its usefulness is supported by the correlation between neuropsychology scores and the severity of regional hypometabolism (and perfusion) in target ROIs, which is consistent with previous reports [12, 34] but not explored by others [10]. We agree with Daerr et al. [10] that pFBB is added value, especially in cases with negative sFBB, because obtaining a pattern of cognitive impairment could be of clinical relevance if amyloidosis (and AD) was discarded. In our study group, these findings mainly concern to changes in the frontal lobe for both frontotemporal dementia and depressive pseudodementia cases.
CONCLUSION
We have evaluated the usefulness of dual-point amyloid PET scans to diagnose AD. FDG PET examinations of patients fulfilling appropriate use criteria for amyloid PET were compared with early acquisitions of FBB PET data. The comparison was performed in terms of both clinical reports and statistical differences in the quantitative analysis of the images. The reported results suggest that the early acquisitions of FBB PET data can be used as surrogates of FDG PET examinations. This would involve important advantages in the clinical practice since using a dual-point protocol for FBB PET we can obtain information about amyloid deposits and brain injury in a single procedure.