
Abstract
Alzheimer’s disease (AD) is a chronic neurodegenerative disorder contributing to nearly 70% of dementia cases. However, no diagnostic protein biomarkers are available in urine. In this study, we combined computational and experimental methods to identify urinary biomarkers for AD. First, by analyzing brain tissue-based gene expression data of AD, 2,754 differentially expressed genes were identified, 559 of which were predicted to encode urine-excretory proteins that might act as candidate protein biomarkers of AD. GO enrichment analyses implied that they were mainly involved in microtubule-based process, myelin sheath, and calcium ion binding, suggesting that they might be associated with AD pathogenesis. In order to verify these proteins in urine, an iTRAQ experiment was carried out to analyze urine samples from AD patients and healthy controls, and 15 proteins were detected. Based on the expression changes of these proteins, 4 proteins were chosen for further validation by ELISA experiment, and SPP1, GSN, and IGFBP7 were found to be differentially expressed in the urine of AD patients. After a literature survey, we found that they were involved in AD pathophysiology and might serve as new urine biomarkers for AD. To our knowledge, this is the first time that urine biomarkers for AD were identified by combining computational and experimental methods. Furthermore, this is the first time SPP1, GSN, and IGFBP7 have been reported as potential urine protein biomarkers for AD. Therefore, our findings might provide significant guidance for finding early biomarkers of AD in urine.
INTRODUCTION
Alzheimer’s disease (AD) is a chronic neurodegenerative disorder contributing to approximately 70% of dementia cases [1]. In 2015, there were 46.8 million people worldwide living with dementia, and this number was estimated to reach 131.5 million in 2050 [2]. AD is characterized by the formation of extracellular amyloid plaques and intracellular neurofibrillary tangles, which lead to neuronal signaling disruption and neuron cell death [3–5]. The pathogenesis of AD is still unclear, and there is no effective treatment for AD. Therefore, early diagnosis provides an important opportunity for the therapeutic intervention for AD. Current strategies for diagnosis of AD are usually based on criteria proposed by National Institute of Neurological and Communicative Disorders and Stroke and the Alzheimer’s Disease and Related Disorders Association (NINCDS-ADRDA) involving medical history, clinical assessment, and neuropsychological tests, which limit diagnostic accuracy [6]. Even though magnetic resonance imaging and positron emission tomography have been used for AD diagnosis, these technologies are complex and costly, and cannot be used widely in clinical practice.
Biomarkers, which reflect the physiological or pathological changes of disease, have been applied in disease diagnosis such as cancer [7–9]. Recently, efforts have also been made in the investigation of AD biomarkers. Since cerebrospinal fluid (CSF) has a close relationship with brain function, it was speculated to contain biomarkers for brain disease. Some researchers have observed that the reduced level of amyloid-β (Aβ) protein peptide 42 (Aβ42) and elevated levels of total tau (T-tau) and phosphorylated tau (P-tau) could be used as biomarkers for AD early diagnosis [10–15]. Neurofilament light chain (NFL) in CSF was also found to be strongly associated with AD, thus the core CSF biomarkers of neurodegeneration (T-tau, P-tau, and Aβ42) and NFL might be used in research and clinical practice [13]. However, the lumbar puncture required to collect CSF samples is considered too invasive to be clinically acceptable for front-line screening. Compared with CSF, blood analysis, which is less invasive, has advantages for population-based screening for many diseases including AD. Mehta and colleagues found that the level of Aβ42 or ratio of Aβ42 to Aβ protein peptide 40 (Aβ40) declined in the plasma of AD patients [16], but other groups did not find the same significantly changes [17–20]. Olsson et al. found that plasma T-tau had association with AD, whereas Aβ42 and Aβ40 were not [13]. Ray and colleagues identified an 18-panel biomarker from 120 signaling proteins, which could distinguish AD patients from controls [21], but others failed to detect the difference in these proteins [22]. O’Bryant and colleagues described a panel of 30 biomarkers to detect AD [23, 24]. James et al. and Hu et al. found series of biomarkers for AD by using two large clinical cohorts [25, 26]. Although blood-based examination is more convenient, there are many highly abundant proteins in blood, such as albumin, immunoglobulin (Ig) A (IgA), and IgG, etc., which make it hard to identify disease-associated proteins. Furthermore, blood has a relatively steady and compensatory status because its circulation could interact with different organs throughout the human body. Therefore, it is often difficult to detect early protein biomarkers in blood for disease [27]. On the other hand, urine provides an alternative to blood as a potential source for disease biomarkers as it is not subject to homeostatic mechanisms and accumulates numerous changes in blood [28]. Currently, urine biomarkers for brain diseases have been mostly ignored due to the long distance between brain and urine, leading to few urinary biomarker studies in AD. For example, de la Monte and his colleagues reported that AD-associated neuronal thread protein (AD7c-NTP) had an increased concentration in urine of AD patients and its level is correlated with severity of dementia [29]. Kyung Mee Kim et al. found that urinary F2–isoprostanes had an increased level in AD patients, and might serve as a potential AD biomarker [30]. Sang Hee Lee et al. found that the levels of oxidized nucleosides were elevated in the urine of patients with mild-to-moderate AD [31]. But up to now, there are still no available urine biomarkers for AD diagnosis in clinical.
In this study, we combined computational and experimental methods to identify potential protein biomarkers for AD in urine. First, we predicted AD-related urine-excretory proteins by analyzing brain tissue-based gene expression data of AD. Second, we examined these predicted proteins in urine samples from AD patients and healthy subjects using the isobaric tags for relative and absolute quantification (iTRAQ) experiment. Third, we validated the potential protein biomarkers of AD in urine samples through an enzyme-linked immunosorbent assay (ELISA) experiment. This work provides an effective and specific way to discover urinary biomarkers of AD, which may contribute toward the early diagnosis and intervention of this disease.
MATERIALS AND METHODS
Workflow of this study
The workflow of this study was given below as Fig. 1.

The workflow diagram of this study.
Collection of brain tissue-based gene expression data of AD
Brain tissue-based gene expression data of AD were collected from Gene Expression Omnibus (GEO) database [32]. Two datasets, GSE48350 and GSE5281, were chosen for analysis according to the following criterion: first, they were derived from the same platform Affymetrix Human Genome U133 Plus 2.0 Array, including 43285 probes corresponding to 21246 genes, which covered almost all known human genes; second, each dataset contained a significant number of AD samples and healthy controls. There were 253 (80 ADs and 173 controls) and 161 (87 ADs and 74 controls) samples in GSE48350 and GSE5281 datasets, respectively. Robust Multi-array Averaging method was applied for the normalization of each dataset [33]. Detailed sample information can be obtained from GEO database.
Identification of differentially expressed genes
In order to determine differentially expressed genes for AD in brain tissues, the following procedure was used. The Kolmogorov– Smirnov test [34] was firstly applied to investigate whether the data fit the normal distribution. Our results suggested that values of many examined genes did not come from normal distribution. Thus, Wilcoxon rank sum test [35] was used to identify differentially expressed genes (p < 0.05). Additionally, false discovery rate (FDR) was applied to control the quality of differentially expressed genes with q-value less than 0.05 as cutoff. Fold change (FC, ADs versus controls) was also used to determine up- and downregulated genes. We selected genes with q-value <0.05, and FC >1.2 or FC <1/1.2 as up- or downregulated genes, respectively. The genes with consistent change trends among these two datasets were chosen for further analysis.
Prediction of AD-related urine-excretory proteins based on differentially expressed genes
Generally, if genes are differentially expressed, their protein products are also speculated to be differentially expressed. Hence, the proteins that were encoded by up- and downregulated genes in AD-related brain tissues were analyzed for the possibility whether they could be excreted in urine through a program developed by Hong et al. [36]. The main idea of the program is described below. Human proteins known to be urine-excretory or not were selected from published data to form positive and negative training data, respectively. In addition, features of proteins including sequences, structures, and physical and chemical properties were investigated, and then a list of distinguishing features was identified between proteins found in urine and those deemed not. Based on these features, a support vector machine-based classifier was trained to predict urine-excretory proteins.
Examination of the predicted urine-excretory proteins in urine samples of AD and controls by iTRAQ experiment
Urine samples
In this study, an iTRAQ experiment was carried out twice to examine predicted urine-excretory proteins in urine samples of AD and controls. The research approval was obtained from the Human Research Ethics Committee of Shenzhen University. A total of 40 participants were recruited for the experiment, including 20 AD patients and age- and gender-matched healthy controls enrolled from the China-Japan Union Hospital. Informed consents were obtained from all participants. All AD patients were diagnosed by psychiatrists according to the Diagnosis and Statistical Manual of Mental Disorders (Fourth Edition) criteria. The ages of the participants ranged from 65–85 years. The male to female ratio was 1:1. Early-morning midstream urine sample of ∼30 ml was collected from each subject by sterile 50 ml plastic centrifuge tubes containing 0.05% sodium azide. The collected samples were temporarily refrigerated on the ice until all sample collections were finished. Further, all the urine samples were divided into 4 ml aliquots using 5 ml polypropylene tubes, stored at – 80°C, and then analyzed using iTRAQ within two weeks. Since about 70% of urinary proteins were from the blood, and 30% of the proteins were from the urine secretory pathway such as glomerular renal tubules, one of the criteria for sample selection is no nephropathy.
Samples preparation
Given that iTRAQ could only detect 8 different samples at each time, we pooled equal amount of urine from 20 AD patients and 20 healthy controls, respectively. The pooled urine samples (5 mL) were taken to centrifuge at 12000 r for 10 min at 4°C, and then the supernatants were obtained. 400μL supernatant was added to column of 10 KD ultrafiltration tube and centrifuged at 11000 r for 20 min (3-4 times repeat). 200μL 50 mM Tris-Hcl was used to wash proteins on the column, then centrifuged at 11000 r for 20 min (2 times repeat). In the end, 200μL 50 mM Tris-Hcl was used to dissolve the proteins and BCA protein assay kit (Beyotime, China) was used to determine the concentration of proteins.
iTRAQ labeling
Urine proteins (100μg) were reduced by 10 mM dithiothreitol (DTT, 37°C, 1.5 h), and alkylated with 50 mM iodoacetamide (IAA) in the dark (room temperature, 15 min) for blocking the cysteine residues. The samples were then buffer-changed two times with 150μL 6 M urea solution and desalted four times with 150μL 0.25 M triethylammonium bicarbonate (TEAB, AB Sciex, Foster City, CA, USA) by Amicon® Ultra Centrifugal Filters (10 kDa cut-off, PALL). Subsequently, the trypsin at a ratio of 1:40 was used to digest the proteins (37°C, 16 h). Further, the peptides were eluted two times by 150μL 0.25 M TEAB and lyophilized. The resulting peptides were labeled with the iTRAQ reagents (AB Sciex) following the manufacturer’s protocol. In experiment 1, the samples of AD and controls were labeled with tags 117 and 119, and in experiment 2 they were labeled with tags 118 and 121, respectively. After labeling, the samples were incubated (room temperature, 2 h), mixed and lyophilized. The dried samples were reconstituted with 100μL ammonium formate (20 mM, pH 10, labeled mobile phase A) and injected into the Agilent HPLC. The mobile phases B comprised 20 mM ammonium formate (pH 10) in 80% acetonitrile (CAN). Separation was performed using a linear binary gradient of 0–80% mobile phases B with samples at a flow rate of 0.4 mL/min for 65 min. Fractions were collected at every 3 min. In total, 20 fractions were collected, combined into ten pooled fractions and lyophilized. The ten pooled fractions were reconstituted (20μL, 2% ACN and 0.1% formic acid) before LC-MS/MS analysis, and then centrifuged (12,000× g, 10 min). Each fraction (8μL) was used for NanoLC-MS/MS analysis.
NanoLC-MS/MS analysis
Analytical separation of peptides was carried out with an Ultra 2D Plus nanoflow HPLC (Eksigent Inc., USA) and a Triple TOF 5600 system (AB Sciex). ChromXP C18 was employed in trapping and desalting and utilized for analytical separation. The RP mobile phase A and B were mixture of water/acetonitrile/formic acid (A, 98/2/0.1%; B, 2/98/0.1%). Labeled peptides were loaded and trapping and desalting were performed using mobile phase A (2μL/min, 15 min). Analytical separation was built at 300 nL/min flow rate. The scan scope (m/z) for TOF-MS was 350–1500 and for MS/MS was 400–1250.
Proteins identification, quantification, and statistical analysis
The identification and quantification of the proteins were carried out through ProteinPilotTM 4.5 software searching against complete human proteins of Uniprot database. Protein identification was required to have at least one unique peptide detected for each protein, while quantification was needed to determine by two quantified peptides. Unused core of 1.0 is equivalent to 95% confidence in the searching result. Based on confidence level 95%, p-values <0.05 were used as cutoff to recognize the differentially expressed proteins in AD patients.
Validation of the potential protein biomarkers of AD by ELISA experiment
The levels of ceruloplasmin (CP), osteopontin (SPP1), gelsolin (GSN), and insulin-like growth factor-binding protein 7 (IGFBP7) were further determined in urine samples from AD patients and healthy individuals by ELISA experiment. A total of 40 AD patients and age- and gender-matched healthy controls were also enrolled from the China-Japan Union Hospital. Likewise, informed consents were obtained from all participants and all AD patients were diagnosed by psychiatrists on the basis of the Diagnosis and Statistical Manual of Mental Disorders (Fourth Edition) criteria. The age of the subjects ranged from 65–85 years. The male to female ratio was 3:1. Urine sample collection and pretreatment were the same as those described in the iTRAQ experiment. For ELISA, commercial ELISA kits were bought from USCN Life Science Inc. (Wuhan, China), and the protein concentrations were measured in accordance with the manufacturer’s instructions. Each ELISA result was normalized with total protein concentration, which was determined by BCA protein assay kit (Beyotime, Jiangsu, China). G test was used to remove the outliers of the data. Software Prism 5 was used to visualize the protein concentrations of samples detected in ELISA and make statistical analyses by t-test with cutoff as 0.05.
RESULTS
Identification of differentially expressed genes in AD brain tissues
Gene expression data of brain tissues from AD patients and healthy controls were retrieved from the GEO database [32]. Two datasets, GSE48350 and GSE5281, were chosen to make differentially expression analyses. In GSE48350, 5,481 probes were identified to be differentially expressed in AD samples versus controls, including 2,511 upregulated and 2,970 downregulated probes. Likewise, 12,115 probes were found differentially expressed in GSE5281 (4,675 upregulated and 7,440 downregulated probes). Detailed information was shown in Fig. 2. Comparative analysis revealed that there were 1,545 probes corresponding to 1,186 genes and 1,981 probes corresponding to 1,568 genes were consistently upregulated and downregulated across these two datasets, respectively.

The numbers of differentially expressed probes (genes) in datasets of GSE48350 and GSE5281. A) Upregulated probes in datasets GSE48350 and GSE5281, and their consistently upregulated probes and genes. B) Downregulated probes in datasets GSE48350 and GSE5281, and their consistently downregulated probes and genes.
To examine whether the differentially expressed genes were AD pathology associated, functional analyses were carried out on these up- and downregulated genes via hypergeometric test against 1,329 pathways collected from canonical pathways in Msigdb [37]. Sixty-one pathways were significantly enriched by upregulated genes (p < 0.05). The top 15 enriched pathways are shown in Table 1 (A complete list of enriched pathways is provided in Supplementary Table 1). It should be noted that focal adhesion, transforming growth factor-β (TGF-β) signaling pathway and mitogen-activated protein kinase (MAPK) signaling pathways are all related to AD pathology. With regard to downregulated genes, 92 pathways were found to be significantly enriched, including neuronal system, synaptic transmission, calcium signaling, energy metabolism, and oxidative phosphorylation. Fifteen enriched pathways are listed in Table 2, while the whole set of the enriched pathways is given in Supplementary Table 2. These results are generally consistent with our knowledge that occurrence of AD may be related to synaptic dysfunction, neuronal damage and apoptosis, neuro inflammation, oxidative stress, aberrant metabolism and mitochondrial dysfunction. Therefore, differentially expressed genes identified here might be involved in AD pathogenesis.
The top fifteen most significantly enriched pathways by upregulated genes
In the table, gene count indicates the number of upregulated genes observed in each pathway; the size of gene set presents the total number of genes in each pathway; the p-value is the significance of each pathway’s enrichment computed by hypergeometric test.
The fifteen significantly enriched pathways by downregulated genes
Here, the gene count denotes the number of enriched downregulated genes in each pathway; the size of gene set is the total number of genes in each pathway; the p-value is the significance level of enrichment calculated using a hypergeometric test.
Prediction of AD-related urine-excretory proteins in urine
It has been reported that the blood-brain barrier could be damaged to some extent in AD patients [38, 39], which suggests that some AD-related proteins might be released from brain into blood, and then excreted into urine to become potential urinary biomarkers of AD. From above analyses, we found that 1186 and 1568 genes were up- and downregulated in the brain tissues of AD patients. Furthermore, we predicted their protein products which could be excreted into urine using a predictor developed by Hong and colleagues [36]. A total of 559 proteins encoded by 258 upregulated and 301 downregulated genes were predicted to be urine-excretory. Details of these proteins are provided in Supplementary Table 3.
Gene Ontology (GO) enrichment analyses were further conducted by using the Database for Annotation, Visualization and Integrated Discovery (DAVID) [40]. Figure 3 shows the enriched GO terms including biological processes, cellular components, and molecular functions. The complete enrichment results were given in Supplementary Table 4. These proteins were mainly involved in biological processes of cell adhesion, small GTPase mediated signal transduction and microtubule-based process, cellular components of extracellular exosome, myelin sheath, and plasma membrane, and molecular functions of GTP binding, calcium ion binding and structural constituent of cytoskeleton. These processes are known to be related with AD development.
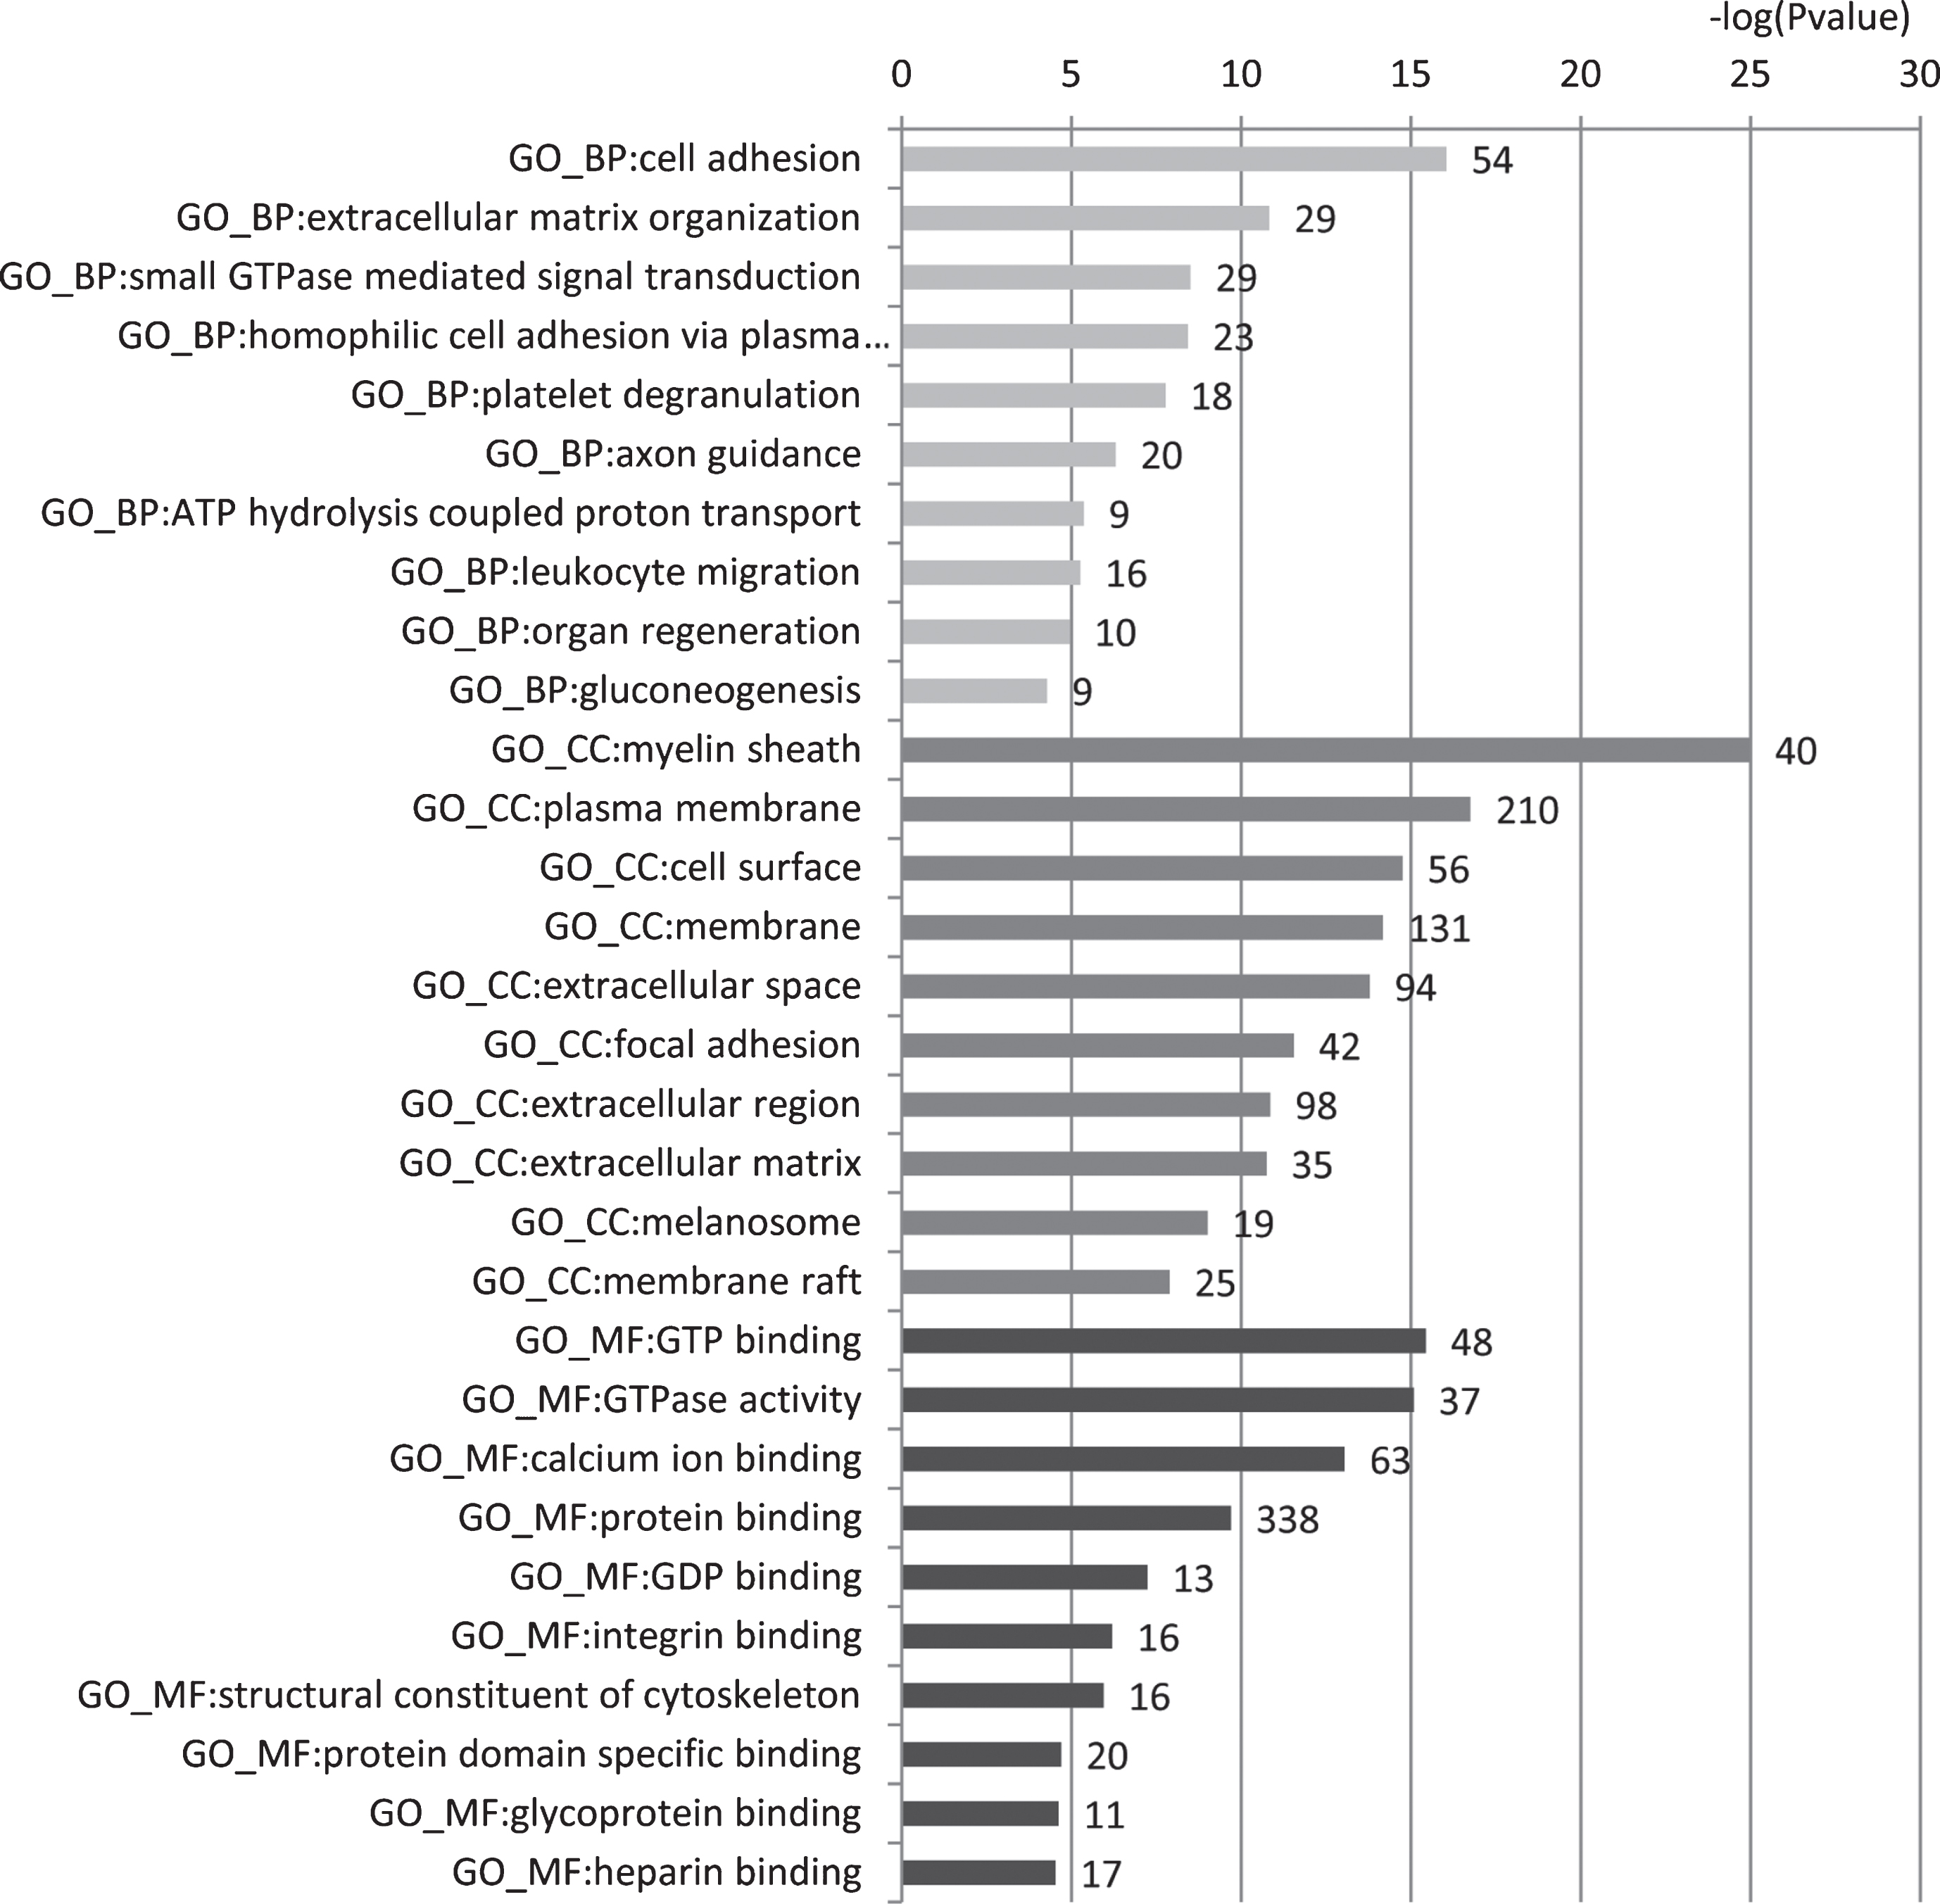
GO enrichment analysis of 559 predicted urine-excretory proteins. Blue bars denote the enriched biological processes, red bars are enriched cellular components, and green bars are enriched molecular functions. Protein numbers enriched in each category are presented with the bars.
Examination of the predicted urine-excretory proteins using iTRAQ
To experimentally verify the presence of these predicted urine-excretory proteins in urine of AD patients, both AD patients’ and healthy controls’ urine samples were collected for iTRAQ analysis. A total of 192 proteins were identified, including 15 proteins predicted above (Supplementary Table 5).
In order to investigate the relationship between the 15 proteins and AD, protein-protein interaction network analysis was carried out by using the web tool of Enrichment and Network Studies of human proteins (LEN) [41]. Figure 4 shows the network, which was generated by 15 proteins input as candidates and four well-known AD-related proteins amyloid precursor protein (APP), apolipoprotein E (APOE), presenilin-1 (PSEN1), and presenilin-2 (PSEN2) as targets. We found that all proteins are present in this network. It was worth noting that APP was located in the center of the network, which is in agreement with our knowledge that APP plays an important role in AD pathogenesis.
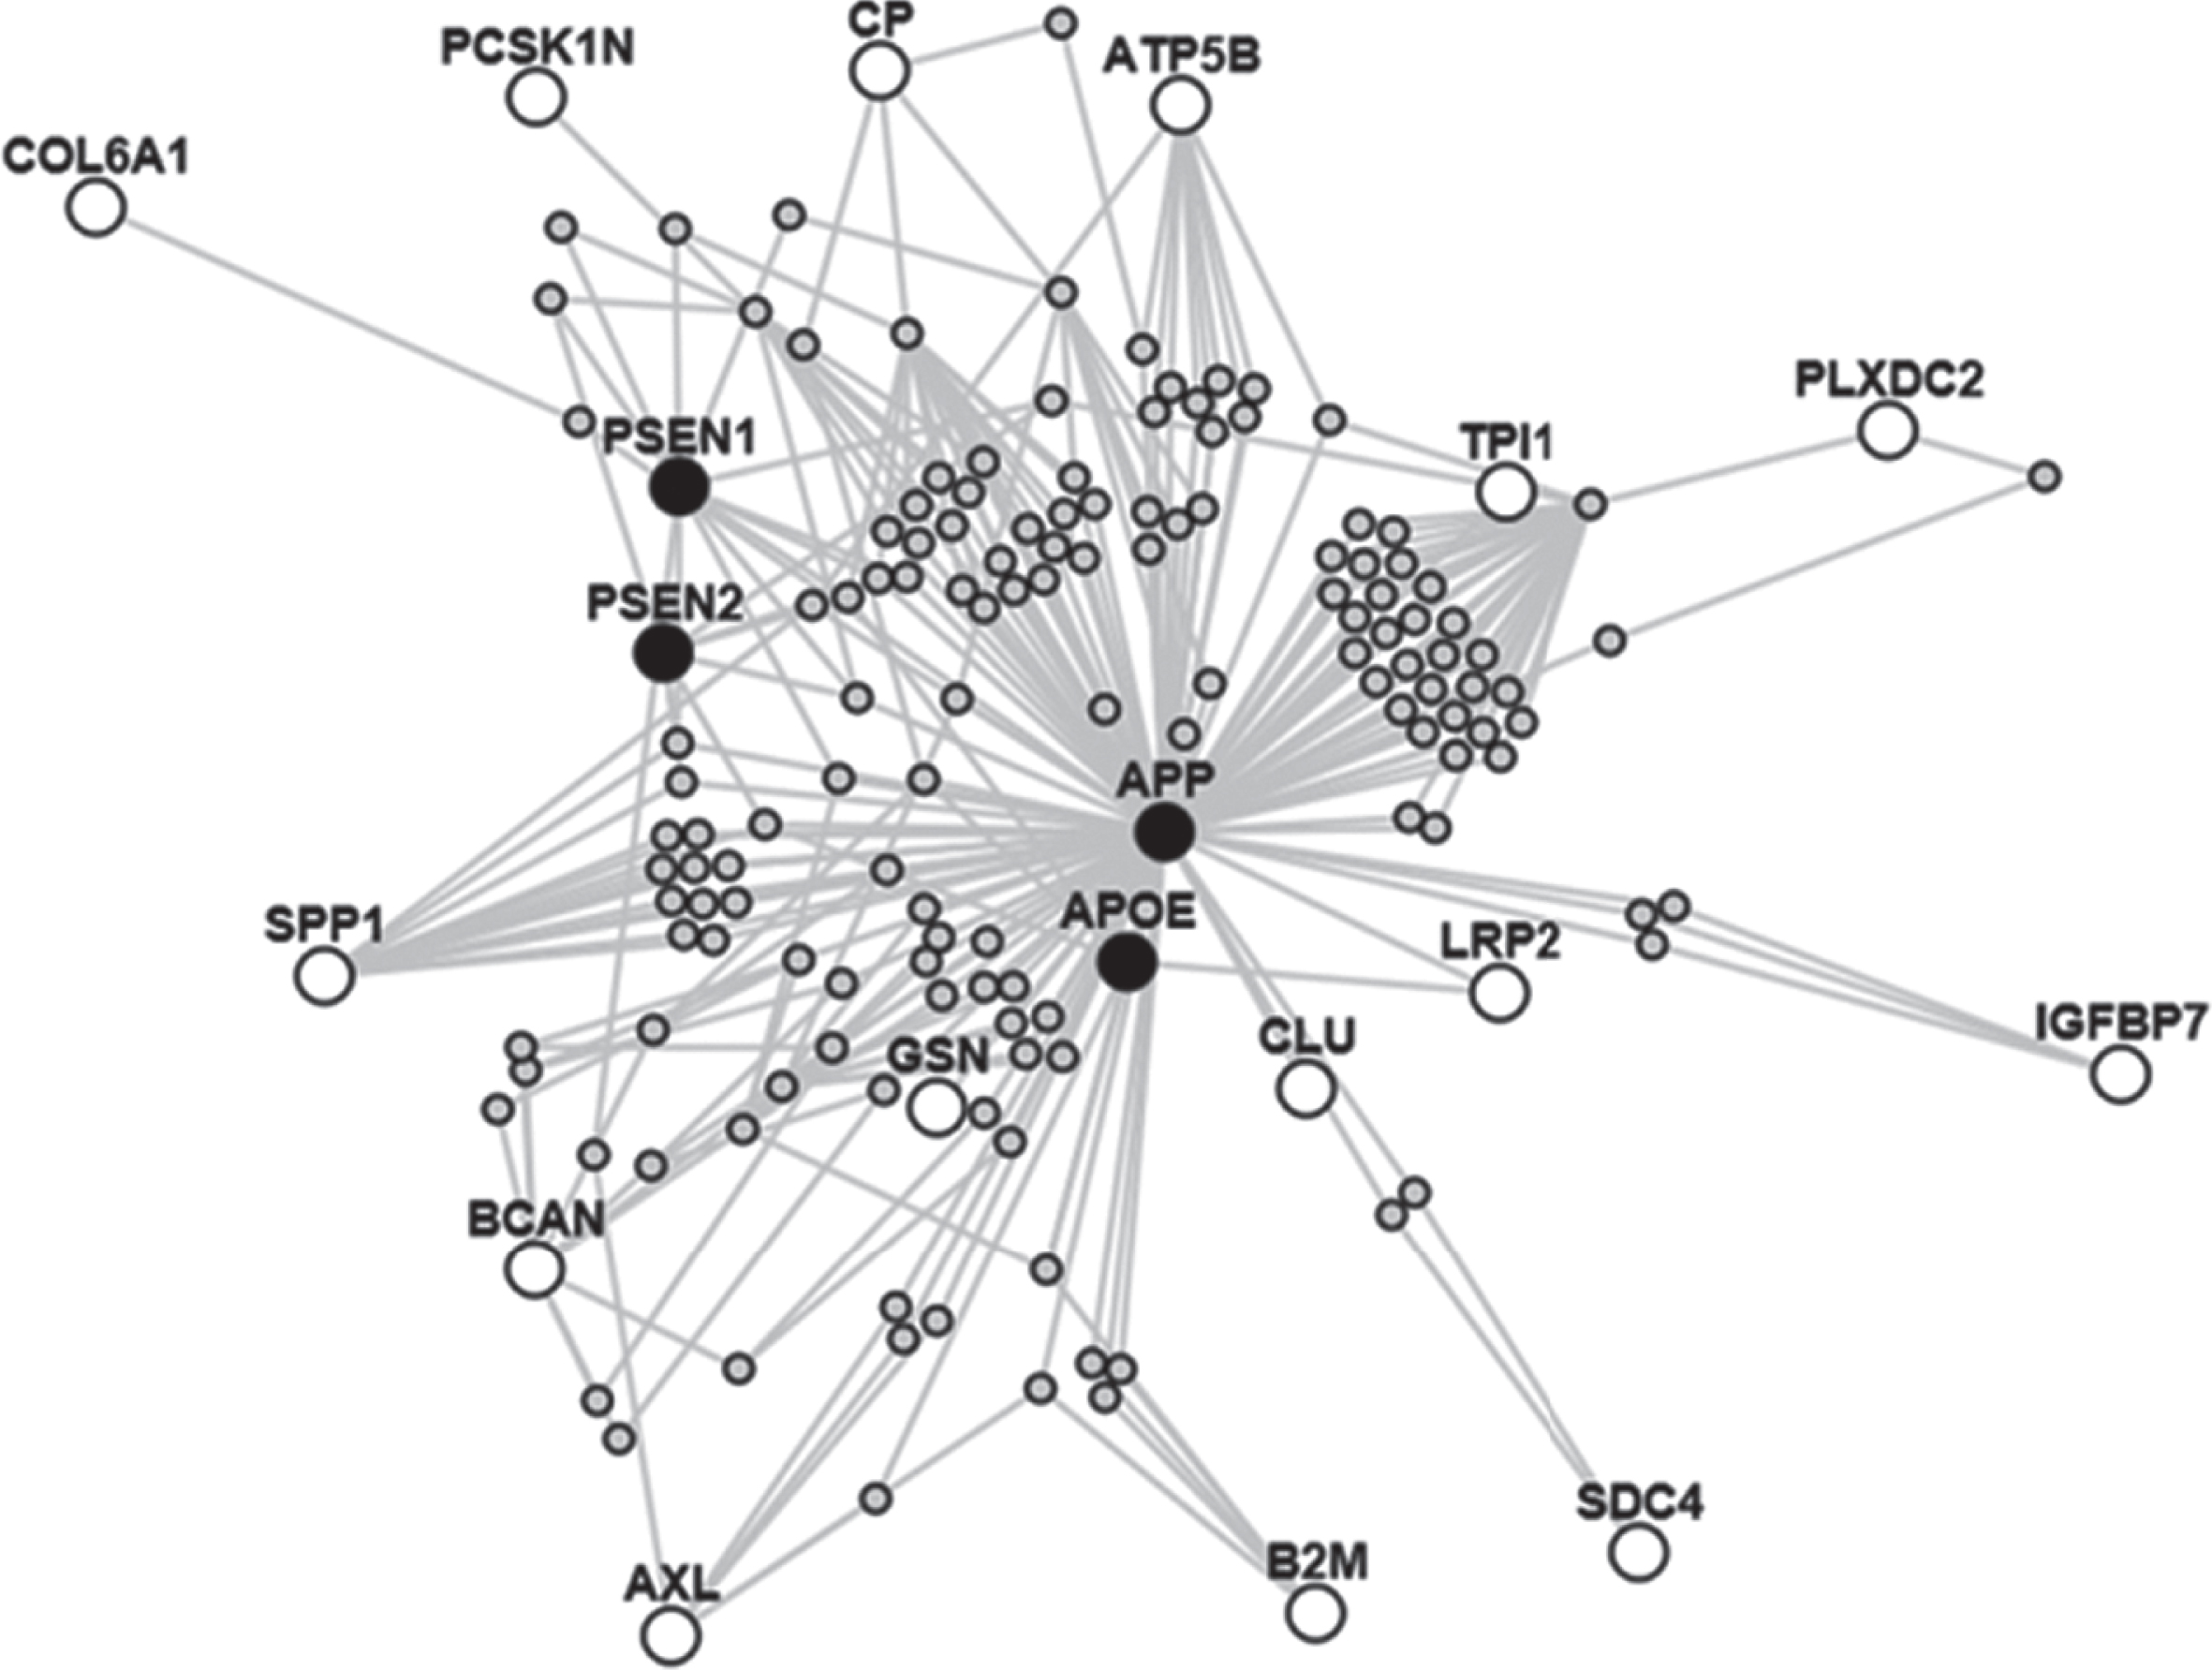
Interaction network of 15 proteins and 4 AD pathology-related proteins. Red nodes represent the 15 candidate proteins and blue nodes are target AD pathology-related protiens.
Validation of the potential protein biomarkers of AD by ELISA experiment
By analyzing the expression levels of these 15 proteins in urine samples from AD patients and healthy controls, 4 proteins (SPP1, CP, GSN and IGFBP7) were found to be differentially expressed with p-value <0.05 or FC >2 and might act as potential biomarkers of AD. Therefore, we collected additional urine samples of AD patients and heathy controls to further examine the expression levels of these 4 proteins by ELISA experiment. As shown in Fig. 5, SPP1 was downregulated, while GSN and IGFBP7 were upregulated in AD patients, which is in concordance with the results obtained from iTRAQ analysis. Even though CP appeared not to be significantly upregulated in AD patients, its average level in AD samples was elevated when compared with that in controls.

Validation of the potential protein biomarkers of AD by ELISA. a. osteopontin (SPP1), b. ceruloplasmin (CP), c. gelsolin (GSN), and d. insulin-like growth factor-binding protein 7 (IGFBP7).
DISCUSSION
AD is the most common form of dementia. The pathogenesis of AD is not clear and there is no effective treatment for AD. Early diagnosis would provide an important opportunity for the therapeutic intervention of AD. However, there are no available diagnostic urinary biomarkers at present. In this study, we combined computational and experimental methods to identify urinary biomarkers for AD, which might provide a more effective and specific way of biomarker discovery compared with traditional methods.
First, 559 candidate urinary protein biomarkers of AD were predicted based on computational analysis of transcriptome data of AD. GO enrichment analysis of these proteins revealed that they were significantly enriched in microtubule-based process, myelin sheath and calcium ion binding, which are associated with AD of pathophysiology [42–48]. Out of these proteins, 15 proteins were detected in the urine samples of AD by iTRAQ experiment. Protein-protein interaction network analysis of these 15 proteins demonstrated that they were tightly associated with AD pathology. Based on the expression changes of these proteins and their functions, 4 proteins were speculated to be potential urinary biomarkers of AD and chosen to validate their expression levels by ELISA experiment. Finally, SPP1, GSN, and IGFBP7 were found to be differentially expressed in the urine of AD versus controls, suggesting that they might serve as novel AD biomarkers in urine.
SPP1 is known to regulate immune cell migration, communication, and response to brain injury. It has been reported to play an essential role in modulating macrophage immunological profile and have the ability of resisting pathogenic forms of Aβ [49]. GSN is an actin binding protein that involves in several pathological processes of AD [50]. It could bind to Aβ protein, inhibit its fibrillization, solubilize existed Aβ fibrils, and help its clearance in brain [51]. IGFBP7 was found to play as a critical regulator of memory consolidation and might be used as a biomarker for AD [52].
It should be noted that SPP1 was predicted to be upregulated in urine of AD but was actually downregulated by experimental verification. Some possible reasons for the contradictory results include: 1) only a small amount of SPP1 protein could be excreted from blood into urine; 2) the protein might be suffering from degradation in urine; 3) the level of this protein might be dynamically changed at different stages of AD progression. Interestingly, SPP1 was reported to be upregulated in serum of AD and could be used as a potential blood biomarker of AD [26], which might be related to its decreased level in the urine of AD patients. Likewise, GSN was reported to be decreased dramatically in plasma of AD [53], which was found to be upregulated in the urine of AD patients through both computational prediction and experimental detection. Therefore, our results revealed opposite trends of the levels of several AD biomarkers between blood and urine.
To our knowledge, this is the first effort to identify urinary protein biomarkers of AD via a combination of both computational and experimental methods. Such a strategy may provide a more effective and specific way to find urinary biomarkers of AD, which could also be applied to find urine biomarkers for other diseases. Considering that expression levels of proteins may change with AD progression, larger scale AD samples with different pathological stages is needed to confirm these findings.
In conclusion, 559 AD-related urinary proteins were predicted by analyzing gene expression data of AD using a computational method, out of which 15 proteins were detected in urine samples of AD by iTRAQ. Among these 15 proteins, SPP1, GSN, and IGFBP7 were validated to be differentially expressed in urine samples of AD by ELISA, suggesting that they might serve as new potential urine biomarkers for AD.
Footnotes
ACKNOWLEDGMENTS
This work was supported by the National Natural Science Foundation of China (Grant No. 31470804), the Key Programs of Shenzhen (Grant No. JSGG20140703163838793), the Shenzhen Bureau of Science, Technology and Information (Grant No. JCYJ20170818102400688, JCYJ20160422110629751, JCYJ20170818142154551), and the Science-Technology Development Project from Jilin Province (No. 20170520063JH, 20180101050JC). Additionally, we would thank Dr. Qiong Liu for some advices on data analyses.