
Abstract
The identification of healthy individuals harboring amyloid pathology represents one important challenge for secondary prevention clinical trials in Alzheimer’s disease (AD). Consequently, noninvasive and cost-efficient techniques to detect preclinical AD constitute an unmet need of critical importance. In this manuscript, we apply machine learning to structural MRI (T1 and DTI) of 96 cognitively normal subjects to identify amyloid-positive ones. Models were trained on public ADNI data and validated on an independent local cohort. Used for subject classification in a simulated clinical trial setting, the proposed method is able to save 60% of unnecessary CSF/PET tests and to reduce 47% of the cost of recruitment. This recruitment strategy capitalizes on available MR scans to reduce the overall amount of invasive PET/CSF tests in prevention trials, demonstrating a potential value as a tool for preclinical AD screening. This protocol could foster the development of secondary prevention strategies for AD.
Keywords
INTRODUCTION
Alzheimer’s disease (AD) is a neurodegenerative disease characterized by a progressive loss of cognitive abilities and specific neuropathological alterations, namely plaques of amyloid-β (Aβ) and tangles of tau proteins. The last decade has seen a paradigm shift by which AD is now perceived as a biological continuum that ranges all the way from normal cognition to dementia [1]. This new concept of AD recognizes the presence of a preclinical stage of AD (PreAD) that precedes the symptomatic phases of mild cognitive impairment due to AD (MCI-AD) and dementia due to AD (AD). PreAD is characterized by cognition within normal ranges and abnormal amyloid biomarkers as measured in cerebrospinal fluid (CSF) or by positron emission tomography (PET). Studies show that amyloid biomarkers in cognitively healthy individuals can be altered decades before the clinical diagnosis of the disease and, therefore, the PreAD stage constitutes a window of opportunity for prevention therapies [2].
At present, disease-modifying therapies have failed to show adequate efficacy in clinical trials and there is a growing consensus that trials should focus on earlier stages of the disease, prompting treatment options before irreversible neuronal loss. For example, the A4 (Anti-Amyloid Treatment in Asymptomatic Alzheimer’s disease) stands as the first secondary prevention trial aimed at preventing clinical symptom in cognitively healthy individuals with AD pathophysiology. However, prevention trials in the PreAD stage face crucial ethical and logistic challenges. Among other considerations, the slow buildup of amyloid accumulation requires long follow-up periods, and large amounts of individuals that should be screened in order to achieve adequate statistical power due to the small effect sizes. Critical to the success of AD prevention strategies, efficient, noninvasive and cost-effective methods of screening asymptomatic at-risk subjects for preventive trials need to be developed.
Magnetic resonance imaging (MRI) has proven to be instrumental at characterizing impending dementia and cognitive decline due to AD both for research and in the clinic. Structural changes in AD-vulnerable structures such as the entorhinal cortex, hippocampus and temporal lobe constitute diagnostic markers of cognitive impairment and stand as valid marker for AD progression [3]. Moreover, other MRI modalities (magnetic resonance spectroscopy [4], diffusion-weighted imaging, and diffusion-tensor imaging (DTI) [5–8]) and functional magnetic resonance imaging [9] offer further complementary information and have unveiled specific AD alterations at different stages of the AD spectrum. On the other hand, to which extent MRI can resolve structural and connectivity changes at the preclinical asymptomatic stage of AD is still an area open for exploration [10, 11].
The machine learning field has contributed a battery of tools for the automated classification of images from MRI. These tools have been applied to publicly available data resources dedicated to AD biomarker discovery. For example, the Alzheimer Disease Neuroimaging Initiative (ADNI) [12] has the primary goal of testing whether serial MRI, PET, and other biological markers, can be combined with clinical and neuropsychological assessments to measure the progression of MCI and early AD. While most studies are limited to structural T1 data, some recent efforts also cover other imaging modalities (e.g., arterial spin labeling [13]). To our knowledge, all machine learning efforts have been focused on diagnostic categories (MCI and AD) and the prediction of impending cognitive decline. For recent reviews see [14]. Whether machine learning can resolve the signature of preclinical AD remains to be investigated. Furthermore, no studies have analyzed the practical utility of MRI-based screening for the recruitment of cognitively normal volunteers in AD preventiontrials.
In this work, we propose an MRI-driven machine learning protocol for the identification of cognitively normal individuals bearing abnormal amyloid levels to be implemented in clinical trial recruitment. Our proposed protocol, uses an MRI-based machine learning model to identify those subjects that are more likely to report abnormal amyloid biomarkers (Fig. 1). While it does not replace the gold-standard measures, our method gains further knowledge from already acquired MRIs, minimizing the amount of PET or CSF tests, in exchange for non-invasive and cost-effective MRIs.
We assessed the utility of our system for PreAD screening based on MRI. To this end, our model was trained on features based on brain morphometry and structural connectivity using a subset of the ADNI cohort. Then, in a local cohort we validated the capacity of our model to prospectively detect amyloid-positive individuals. Finally, we determined the benefits of utilizing this classifier in the recruitment of subjects for secondary prevention trials. Taken as a whole, our results show that MRI modalities combined with machine learning can be used as a practical and cost-effective screening tool for AD prevention trials.
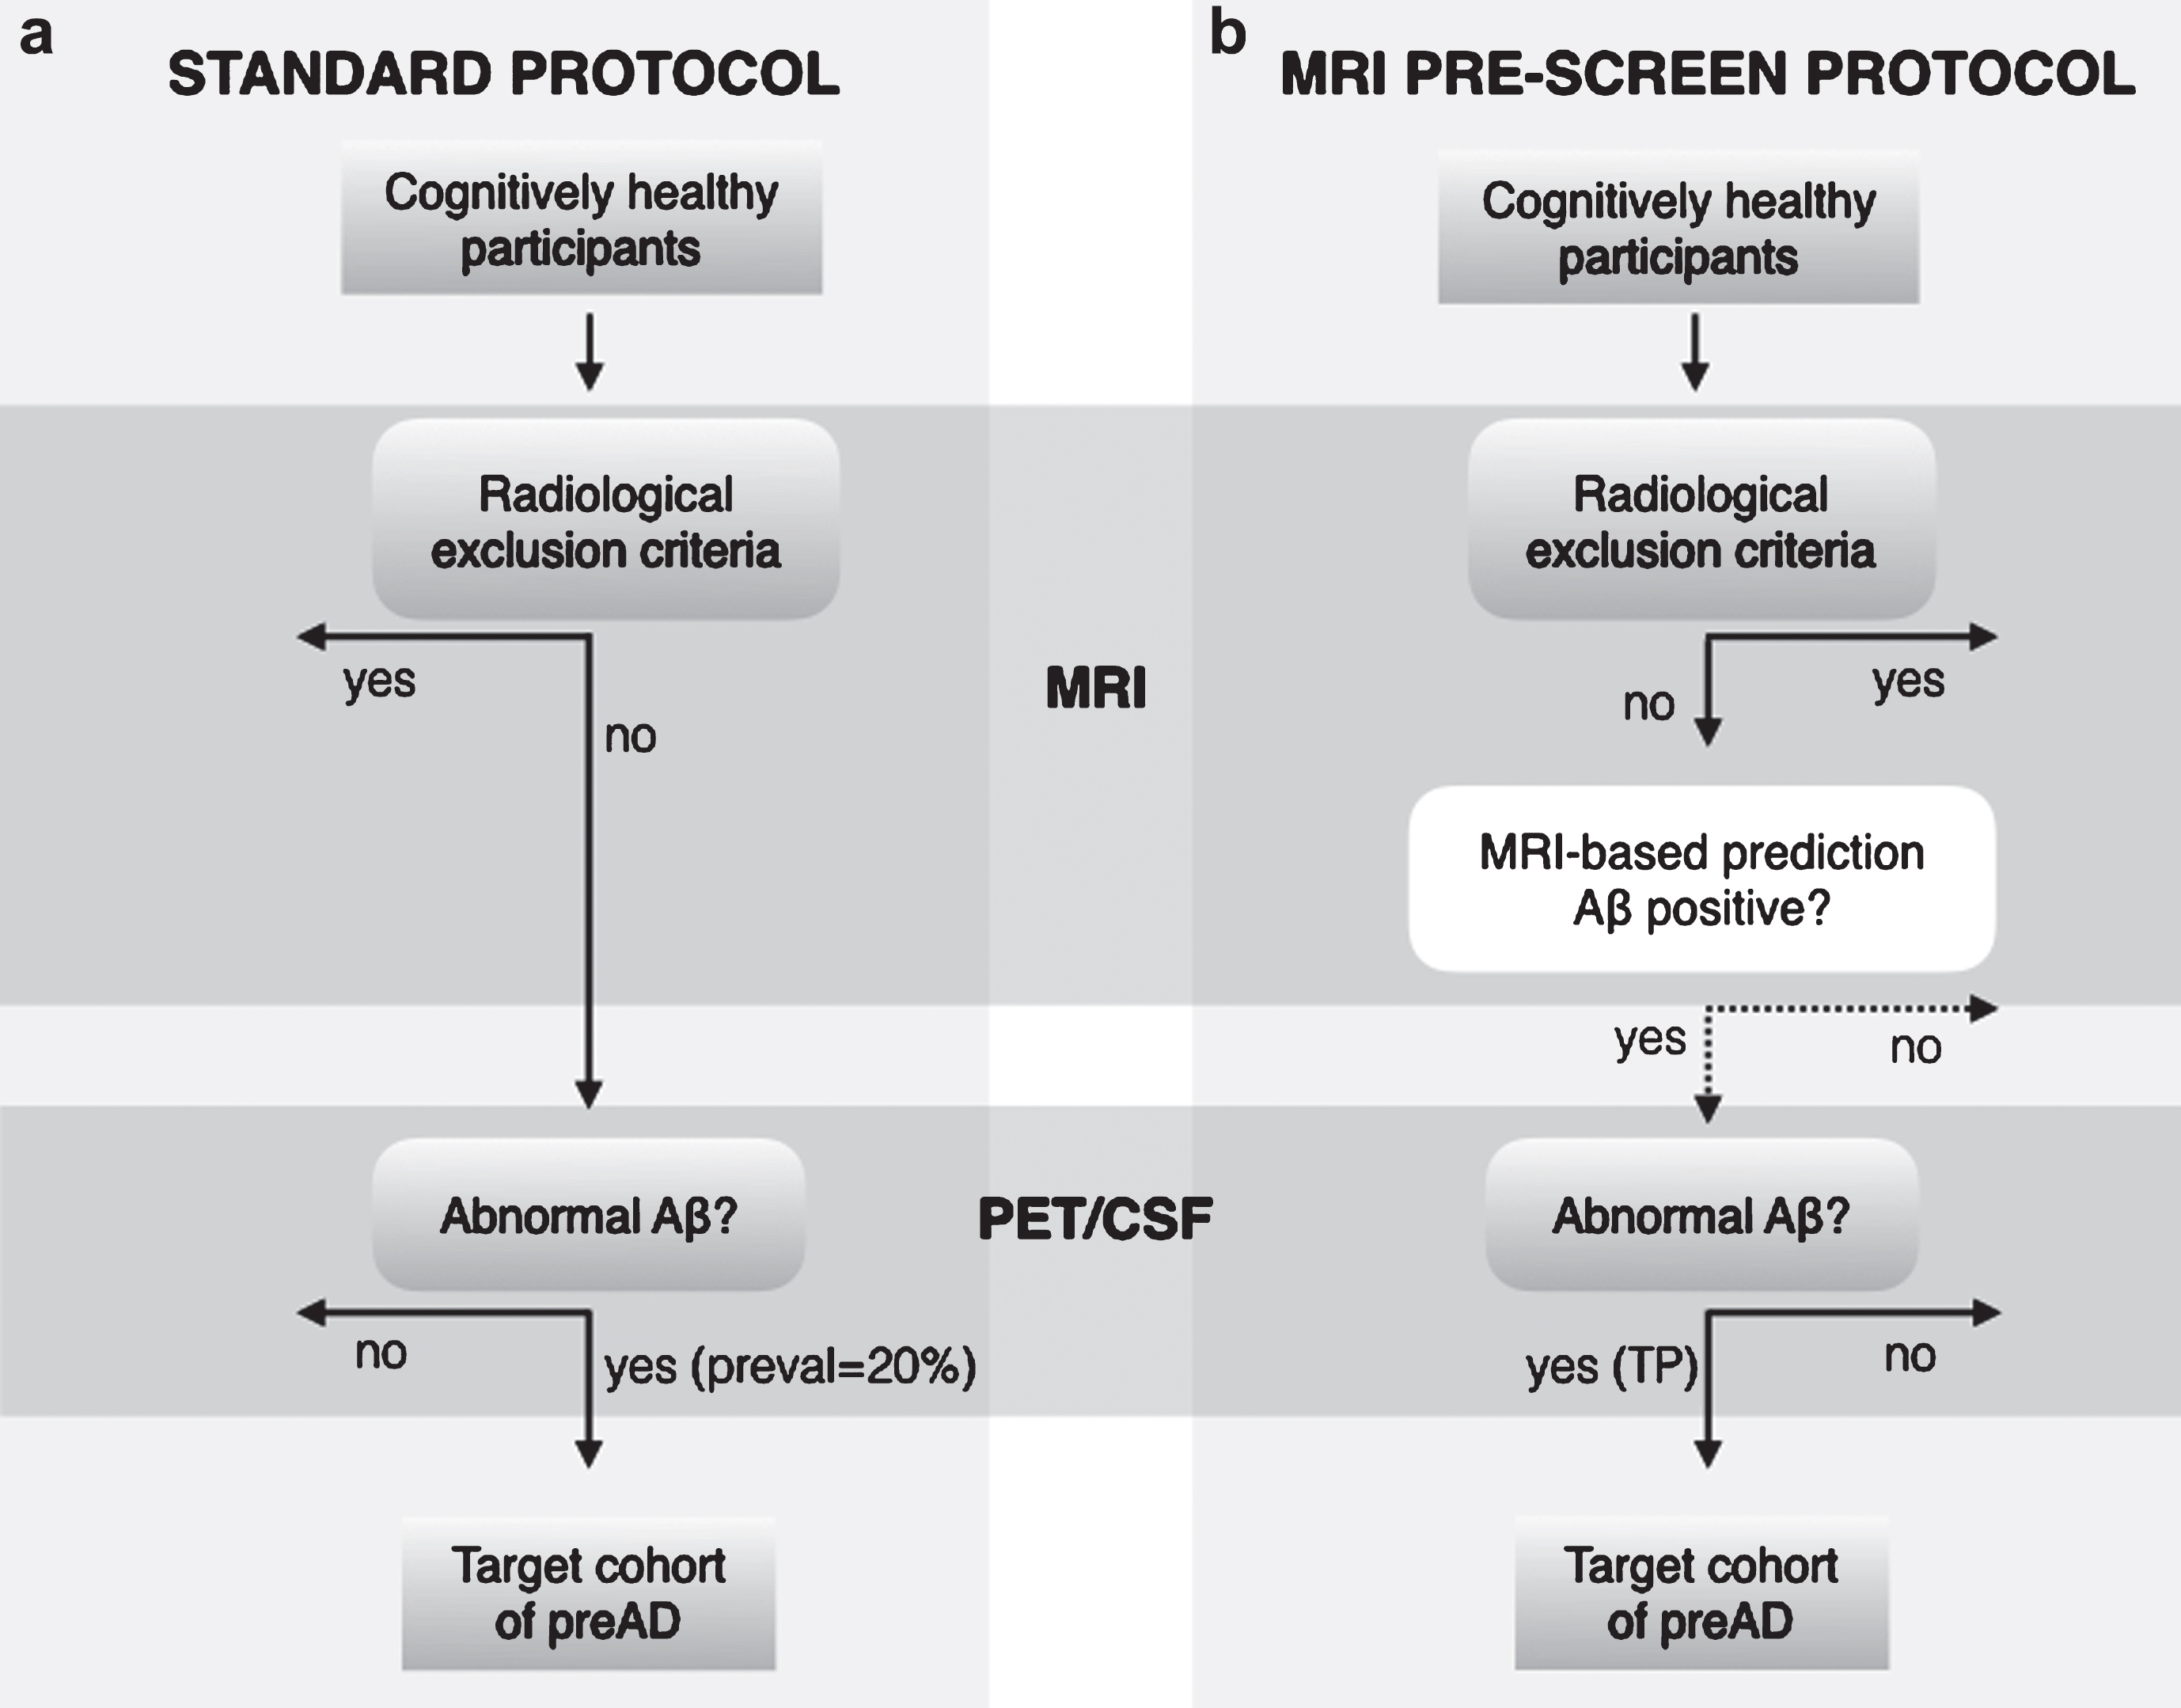
Outline of clinical recruitment protocol of subjects with PreAD pathophysiology. (a) Standard recruitment protocol used in clinical trials. (b) Our proposed protocol with MRI-based machine learning. In the standard protocol, cognitively healthy participants undergo an MRI scan to identify radiological exclusion criteria (e.g., cerebrovascular disease). All cognitively healthy subjects with no brain injuries then participate in a PET/CSF test, and the fraction of Aβ positives is determined only by the disease prevalence. The proposed protocol adds an exclusion layer in which automated MRI-based classification predicts a subset of PreAD subjects that are later subjected to PET/CSF acquisition. In this case, the target cohort is defined by the true positive rate (TP% ) of the classification algorithm. The initial participant pool needs to be larger for the proposed protocol due to classifier false negatives that may be excluded.
MATERIALS AND METHODS
Subjects
Data used in the preparation of this article were obtained from the ADNI database (http://adni.loni.usc.edu). The ADNI was launched in 2003 as a public-private partnership, led by Principal Investigator Michael W. Weiner, MD. The primary goal of ADNI has been to test whether serial MRI, PET, other biological markers, and clinical and neuropsychological assessment can be combined to measure the progression of MCI and early AD. For up-to-date information, see http://www.adni-info.org.
CSF as well as T1 and DTI imaging data from 96 subjects of the ADNI cohort [12] was downloaded. This subset of ADNI was selected to collect T1 and DTI images acquired on the same 3T scanner. In this sample, cognitively normal subjects were classified as PreAD if they had Aβ42 CSF concentration below 192 pg/mL and as normal control (NC) if else. This threshold for Aβ positivity (Aβ+) was selected based as it optimally discriminates between controls and AD patients on the ADNI-independent autopsy-based AD CSF samples analyzed with the multiplex xMAP Lumnex platform [15], MCI and AD classification criteria applied in the ADNI project have been reported elsewhere [16] and were further refined by exclusively considering Aβ+ individuals. This classification criteria resulted in 28 normal controls (NC), 16 PreAD, 23 MCI due to AD [MCI], 29 AD.
Equivalent CSF, T1 and DTI imaging data was also acquired from our single-site cohort at the AD Unit Hospital Clinic of Barcelona (HCB) including 87 subjects (40 NC, 12 Pre-AD, 21 MCI due to AD [MCI], 14 AD). Subjects were classified as PreAD if they were cognitively normal and Aβ+, defined according to recommended reference values with the INNOTEST ELISA (CSF Aβ42 < 500 pg/mL) [10, 17]. Criteria for MCI and AD have been previously reported [17] and, of note, only included Aβ+ patients. The local ethics committee approved the study and all participants gave written informed consent.
Image acquisition and processing
HCB participants underwent MRI in the same 3T Siemens TrioTIM scanner providing 3D T1- weighted images with the following parameters: Repetition Time (TR) = 2300 ms, Echo Time (TE) = 2.98 ms, Inversion Time (TI) = 900 ms, Flip Angle = 9, voxel resolution of 1×1×1 mm3 on 240 sagittal slices; and two diffusion-weighted sequences: TR = 7600 ms, TE = 89 ms, Flip Angle = 90, 30 non-collinear directions (b = 1000 s/mm2) and 1 non-gradient volume (b = 0), voxel size of 2.05×2.05×2 mm3 on 60 axial slices.
ADNI participants were scanned on the same 3T GE MRI model, on 13 different sites, comprising 3D T1-weighted images: TR = 7.256 ms, TE = 2.988 ms, TI = 400 ms, Flip Angle = 11, voxels resolution of 1.02×1.02×1.2 mm3 on 196 sagittal slices; and a diffusion-weighted sequence: TR = 13000 ms, TE = 69.1 ms, Flip Angle = 90, 41 non-collinear directions (b = 1000 s/mm2) and 5 non-gradient images, voxel resolution 1.3672×1.3672×2.7 mm3 on 59 axial slices.
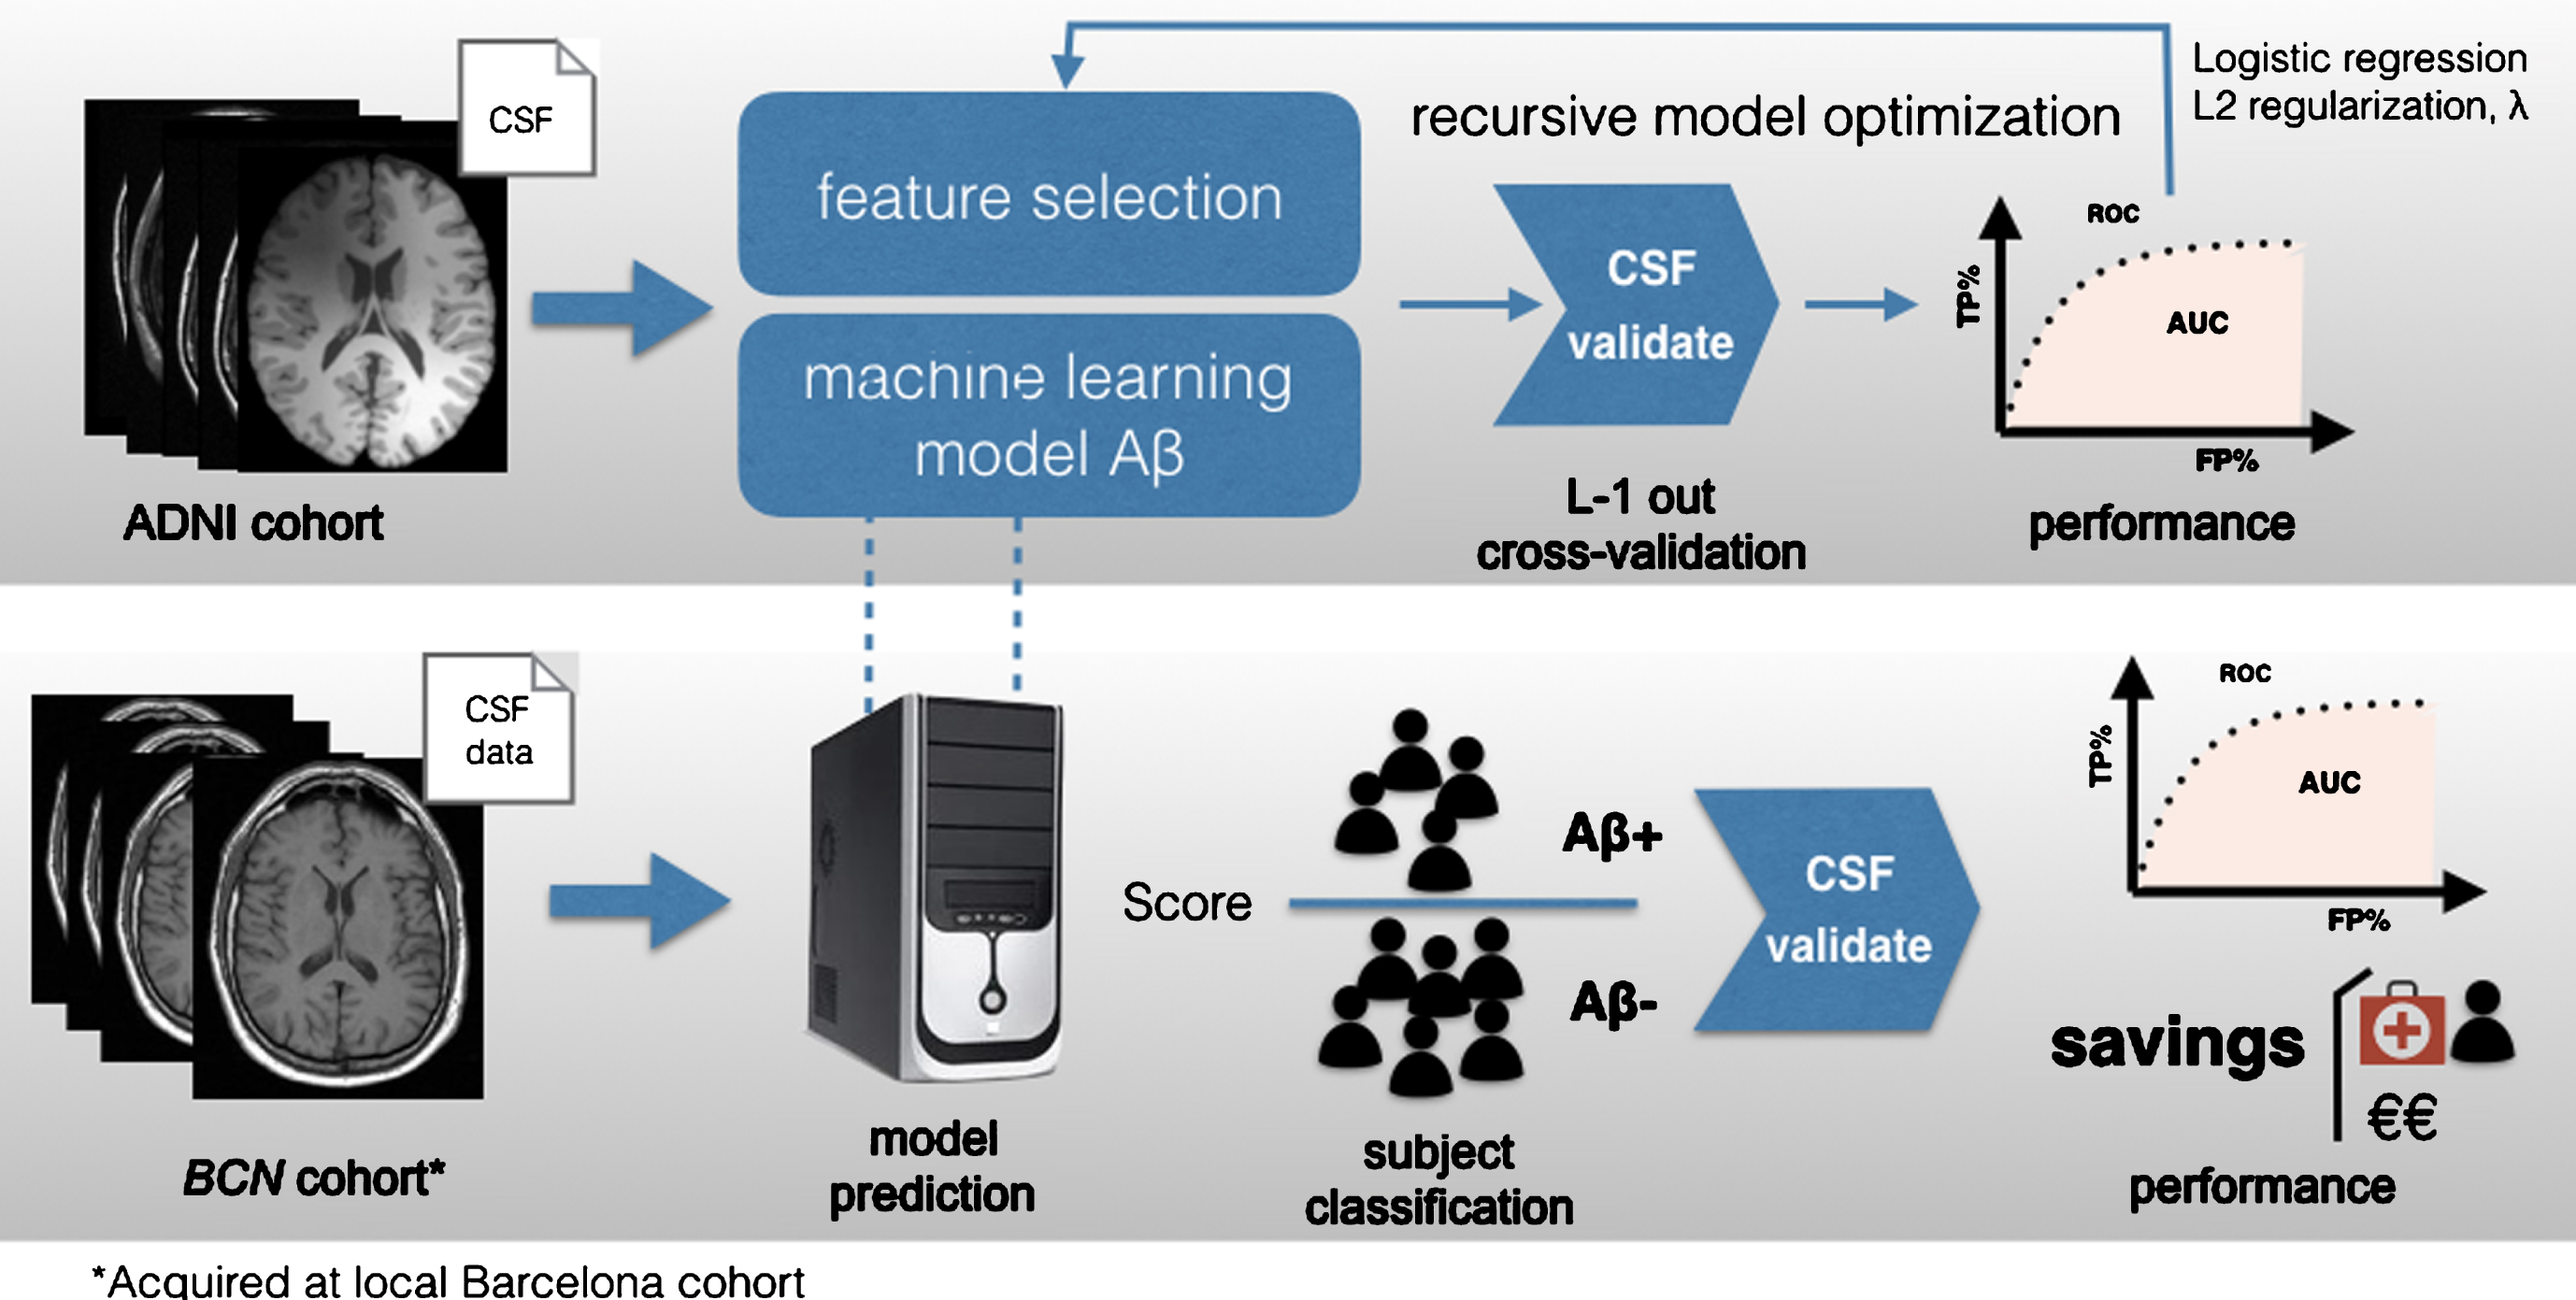
Core model training and validation for automated MRI-based classification of Aβ-positive (Aβ+) subjects using logistic regression. The ADNI dataset is used for model training. Feature extraction from GMVs of ROIs is followed by feature selection for dimensionality reduction. The parameters of the model are optimized iteratively based on the training data to maximize performance measured in terms of area under the receiver-operating characteristic curve (ROC). The final model is tested on the HBC dataset to predict Aβ+ subjects and validated using CSF biomarkers as ground truth. Model predictivity and performance are assessed in terms of area under the ROC and the overall savings produced in the alternative recruitment scenario that includes MRI-based classification.
T1-weighted images were segmented with the Statistical Parametric Mapping (SPM) VBM8 toolbox [18] to obtain CSF, gray matter (GM), and white matter (WM) probabilistic map. Then, a binary GM mask was formed by those voxels whose probability of belonging to GM was bigger than the probability of belonging to any other tissue. The AAL atlas [19] in the Montreal Neurological Institute (MNI) standard space was warped to each subject’s T1 native space by mean of ANTS (UPENN, UVA and UIowa, USA; http://stnava.github.io/ANTs/) and using the DARTEL template obtained from the segmentation step. AAL maps were resliced to the T1 resolution using nearest neighbor interpolation and intersected with the GM mask. Volumes of all AAL regions were computed for every subject and normalized by total intracranial volume, calculated as the sum of the CSF, WM, and GM masks.
Structural connectivity matrices (SCM) were also computed. To this end, AAL regions were superimposed to the DTI data using a similar protocol as the one described above. For tractography, to create a seed mask insensitive to grey matter volume changes, the interface between grey and white matter was dilated by one voxel. Then, probabilistic tractography was performed between pairs of AAL regions using FSL’s ProbtrackX [20] (see further details in [8]).
Overview of machine-learning methods
Our core machine learning pipeline was trained using the ADNI cohort dataset and tested with our local dataset from HCB (Fig. 2). The performance of the overall system was validated using CSF/PET biomarkers as gold standard.
Feature extraction and selection
Feature selection techniques were used to retrieve a reduced set of informative features from high dimensional medical images. From each T1-weighted image, we extracted a 90-dimensional vector corresponding to the grey matter volume (GMV) of each of the 90 regions of interest (ROIs) described in the AAL atlas. From each DTI image, we extracted a 90×90 SCM for atlas ROIs. The upper triangular determines a 4005-feature vector.
The different acquisition protocols across medical centers introduce biases that are reflected in considerable variability in the distribution of imaging feature vectors. Thus, imaging features were normalized using z-scores computed independently for each cohort to make data comparable and ensure standardized feature weights.
Different filter feature selection methods have been compared for performance. We focused on balancing the relevance and the redundancy of the subset of features and three methods were evaluated for this purpose: F-test, mRMR-FCD and mRMR-FCQ [21]. The first two provided optimal performance in the selection of T1 and DTI imaging features respectively and were used throughout this study. We discard the use of wrapper and embedded feature selection methods since they are sensible to small sample sizes and result in high generalization error indicating severe overfitting of the training set.
Classification
Cognitively normal individuals (NC and PreAD) in the two cohorts were used to train and test a classifier to predict dichotomous Aβ status (either positive or negative). The ADNI cohort was used for training the classifier and the HCB data for testing. In addition, two different classifiers were built, one based on T1 data alone and, another one, based on a combination of T1 and diffusion-weighted imaging data.
Different classification schemes were tested out, including logistic regression (LR), support vector machine (SVM) with linear and Gaussian kernels, random forests and k-nearest neighbors, being linear methods (logistic regression and linear-SVM) the most successful, giving similar results in practice. Finally, due to slightly better performance and easier interpretation of the model, a binary LR classifier was used with L2 regularization and a penalty term λ, optimized by a cross-validation strategy in the ADNI cohort. The LR classifier outputs a score for each subject that can be interpreted as the probability of being Aβ+ or Aβ– , as validated by the CSF biomarker readout.
The optimized model was tested for performance in terms of the savings in cost of clinical trial recruitment. To this end, precision (fraction of positive prediction correctly classified), recall (also known as sensitivity, i.e., fraction of positive instances correctly classified) and specificity (fraction of negative instances correctly classified) were calculated using the dichotomized CSF Aβ as gold-standard. Precision-recall (PR) and receiver-operating curves (ROC) were also computed to evaluate method performance. See formulae in Supplementary Material A.
For a target normal population of mean age 65, the prevalence of amyloid pathology was estimated to be 20% [2]. We employed a bootstrapping approach to simulate the required disease prevalence and iteratively repeated the classification protocol, yielding different splits of the test set at each run.
As a secondary analysis and for the sake of comparability with previously reported AD/MCI classifiers, an ‘optimized diagnostic’ classifier was derived with an identical pipeline and using NC and MCI and AD subjects in the two cohorts to discriminate between NC-MCI and NC-AD (for further details, see Supplementary Material B). Finally, we also assessed the performance of the classifier optimized to discriminate PreAD from NC to classify between NC versus the diagnostic categories (MCI and AD).
Savings
Savings in clinical trial recruitment were calculated as the percentage difference in resources between the standard recruitment protocol and our proposed protocol with the MRI-based classifier (Fig. 1) to obtain a desired number of PreAD subjects for the clinical study. Savings were assessed in terms of economic cost (Equation [1]) or participant burden (Equation [2]), i.e., the amount of unnecessary PET/CSF tests spared through MRI-screening.
RESULTS
First, we report our standardization protocol to make data actionable across training and testing cohorts. Then, we evaluate the performance of a classifier based on GMV from T1-weighted images only and an extended classifier based on a combination of T1 and DTI features. Demographic characteristics of the studied samples are shown in Table 1.
Demographics and biomarkers, HCB and ADNI separately, and for HCB and ADNI merged together
*Significantly different versus Control group (p < 0.05). †Significantly different versus Preclinical group (p < 0.05). ‡Significantly different versus same group in HCB population (p < 0.05). Groups: NC, normal controls; Pre, preclinicals; MCI, mild cognitive impairment due to AD; AD, Alzheimer’s disease patients.
Data normalization
Following normalization of the raw imaging features from the training cohort (ADNI) and test cohort (HCB), the resulting distributions of z-score features were confirmed as matching distributions under the Kolmogorov-Smirnov (KS) test (p≤0.05) (Fig. 3).
Classification of PreAD subjects using T1-weighted images

Examples of distributions of T1 features for three GMV ROIs (a) before and (b) after the Z-score normalization. The ADNI and HBC cohort distributions are shown in red and blue respectively.
F-test selection provides the most discriminative features in the classification NC versus PreAD based on ADNI data (Fig. 4, Supplementary Material D). The classification algorithm provides a ranking and a weight for these features (Fig. 4) based on their relevance. Maximal area under the ROC curve (AUC) and maximal clinical recruitment savings can be achieved for 20 T1 features (Table 2).

(a) ROI Features selected for the best performing method (F-test, 20 features). (b) Ranked list of most informative features according to the weights provided by the LR decision function (ADNI cohort). (c) ROC analysis of the method performance for 10, 20, and 30 top ranking features based on the validation cohort (HCB). (d) SavingsCOST as a function of precision-recall calculated based on the optimal number of features (n = 20) applied to the HCB cohort. Color scale and dashed contour lines indicate savings. In particular, a contour line with savings = 0.001 demarks the boundary of area of the precision-recall curve above which savings > 0. Optimal PR threshold provides the highest savings (p = 0.54, R = 0.83, Savings = 47% ). Horizontal dotted line at p = 0.2 denotes savings of a random classifier, note that this precision value is equal to the prevalence of the PreAD population.
Classification of Pre AD subjects using multimodal feature vectors
Multimodal classification was performed combining imaging features from T1 and DTI. Z-score transformed features concatenated from both modalities yield 4095-dimensional feature vectors. The optimal PR threshold that yields the highest savings highly depends on the number of features used in the classifier (Table 3, Fig. 5). Feature selection with the mRm-FCD [21] method resulted in a 45-dimensional feature vector (features listed in Supplementary Material D). Notably, only 2 out of these 45 most informative features were T1 features (feature 18: Olfactory (L), feature 23: Pallidum), while 43 were DTI feature-pairs. This result suggests that DTI features may be more informative than T1 features for identifying preclinical subjects. Figure 5 shows the most DTI-connected regions, given by the weighted sum of the DTI-feature pairs and reflects their relevance in the identification of PreAD. For example, the Pallidum is highlighted as a ROI with multiple connections as well as by itself as a GMV feature.
Remarkably, almost same performance (AUC) and cost savings are obtained for both T1 and the multimodal classifiers but precision is higher (p = 0.85) in the multimodal model than in the T1 case (p = 0.54) resulting in larger savings with regards to participant burden (76.5% ). The description of the association between CSF Aβ42 levels and tractography falls beyond the interest of this work as it has been described elsewhere [8].
Classification of NC versus MCI/AD subjects
The T1-only classifier optimized to discriminate between NC and MCI/AD patients yielded AUCs comparable with state-of-the-art methods (AUC > 0.89). Addition of the DTI data marginally improved the classification capacity (AUC > 0.91). Again, these performance metrics were achieved in the HCB cohort after training the classifiers on the ADNI dataset. On the other hand, the classifier optimized to discriminate between NC and PreAD subjects yielded an AUC <0.20 to discriminate among NC and the diagnostic categories (i.e., MCI, AD). For further details see Supplementary Material C.
DISCUSSION
Our work investigates the automated screening of PreAD individuals using machine learning methods on features derived from structural MRI. We present the potential integration of such a technology as a screening tool for the recruitment of subjects in secondary prevention trials and present a framework to quantify the benefits of such approach in economic and participant burden terms. Noteworthy, it is not proposed to replace the gold-standard PET/CSF tests, but to provide a prediction of amyloid positivity in order to avoid unnecessary PET/CSF tests and, thus, reduce participant burden and economic costs.
Validation across cohorts
We utilized public MRI and CSF data available from ADNI for feature selection and model training. Our independent HCB cohort served for model testing, simulating a real trial recruitment scenario. The data normalization scheme enabled validation overcoming the differences between data acquisition protocols and scanners in both institutions. Thus, the relevance of our models can be generalized to other population samples, with different age and education ranges. Of note, performance of the algorithm was stable when reversing the training and test datasets. Therefore, we foresee that the performance of our PreAD classification will hold when prospectively applied to independent cohorts with practical utility for PreAD screening purposes.
Performance of the PreAD classification model according to the number of features selected (10, 20, 30, 40, 50). In the classification NC versus PreAD, optimal performance (AUC = 0.76) is achieved with 20 features and the optimal P-R threshold that produces the highest savings is highlighted
Performance of classification according to the number of features selected (10, 20, 30, 40, 45, 50). Optimal performance (AUC = 0.69) is provided by 45 features. The optimal PR threshold that produces the highest savings is listed (SavingsCOST = 49% , SavingsCSF/PET = 76.5% )
Feature selection
By design, our data-driven approach was agnostic to previously reported anatomical changes due to AD. This allowed us to validate the selected features given their role in preclinical and prodromal stages of AD according to the literature. As expected, most of the features found informative in PreAD classification relate to the established AD signature. In the case of T1, characteristic AD affected regions include atlas ROIs such as the hippocampus and amygdala, temporal and parietal areas as well as the cingulum, thalamus, rectus, and fusiform giri (Fig. 4) [22]. Regions such as olfactory bulb pertain to well documented alterations of the olfactory system in the pathogenesis of AD and other dementias [23]. Other regions showing a high discriminative power such as the caudates, have been found altered in cognitively normal individuals at high genetic risk of developing AD [24, 25]. Finally, the role of other regions such the globus pallidus is not as clear in PreAD (Fig. 5). One explanation would be that this atlas ROI includes the nucleus basalis of Meynert, which is an adjacent region not explicitly identified in the AAL parcellation. In a previous voxelwise analysis of the HCB cohort, the nucleus basalis showed alterations in PreAD [17] and, moreover, this region has been consistently reported to degenerate in early AD stages [26]. Interestingly, the features that classify between NC and PreAD yielded an AUC <0.2 to discriminate among NC and the diagnostic categories (i.e., MCI, AD). An AUC significantly departing from 0.5 is classifying de facto. However, being well below 0.5 suggests that some features that characterize PreAD from NC appear in the opposite direction as some of the features that classify NC versus AD. This interpretation is further reinforced by the fact that classification models built using an identical pipeline but trained specifically to recognize diagnostic categories perform accordingly to what has been reported in the literature (AUC = 0.95 for 20 T1 features, p = 1.0, R = 0.76), and are based mainly on hippocampal and temporal lobe volumes (Supplementary Material B). Future work should improve the identification of discriminant brain regions using voxelwise approaches to fully characterize the preclinical AD signature using MRI and to identify overlaps with the established AD signature [22].
Overall, our results show that feature selection has prioritized DTI features over T1 features in a multimodal imaging vector. Thus, DTI feature-pairs may be more robust than T1 features, compensating for the lower image quality (resolution, noise, blur) and artifacts given by surrogate measures of brain anatomical connectivity in DTI. Also, DTI conveys complementary information from white matter connectivity. Our data raises the question of whether changes in connectivity may be more evident in early AD than volumetric changes [8]. Nevertheless, the relevance of DTI over T1 features observed in this study should be further confirmed in other datasets. Despite its similar performance, the multimodal model is more precise than the T1-based model, which translates into less false positives and therefore less unnecessary PET/CSF tests in exchange for more MRI scans given the low recall of the model.
Range of application and PreAD prevalence
In this proof-of-concept study, our MRI-based classifier thresholds are optimized to maximize the cost savings. The model can be tuned for other applications such as minimizing participant burden (Equation 2).
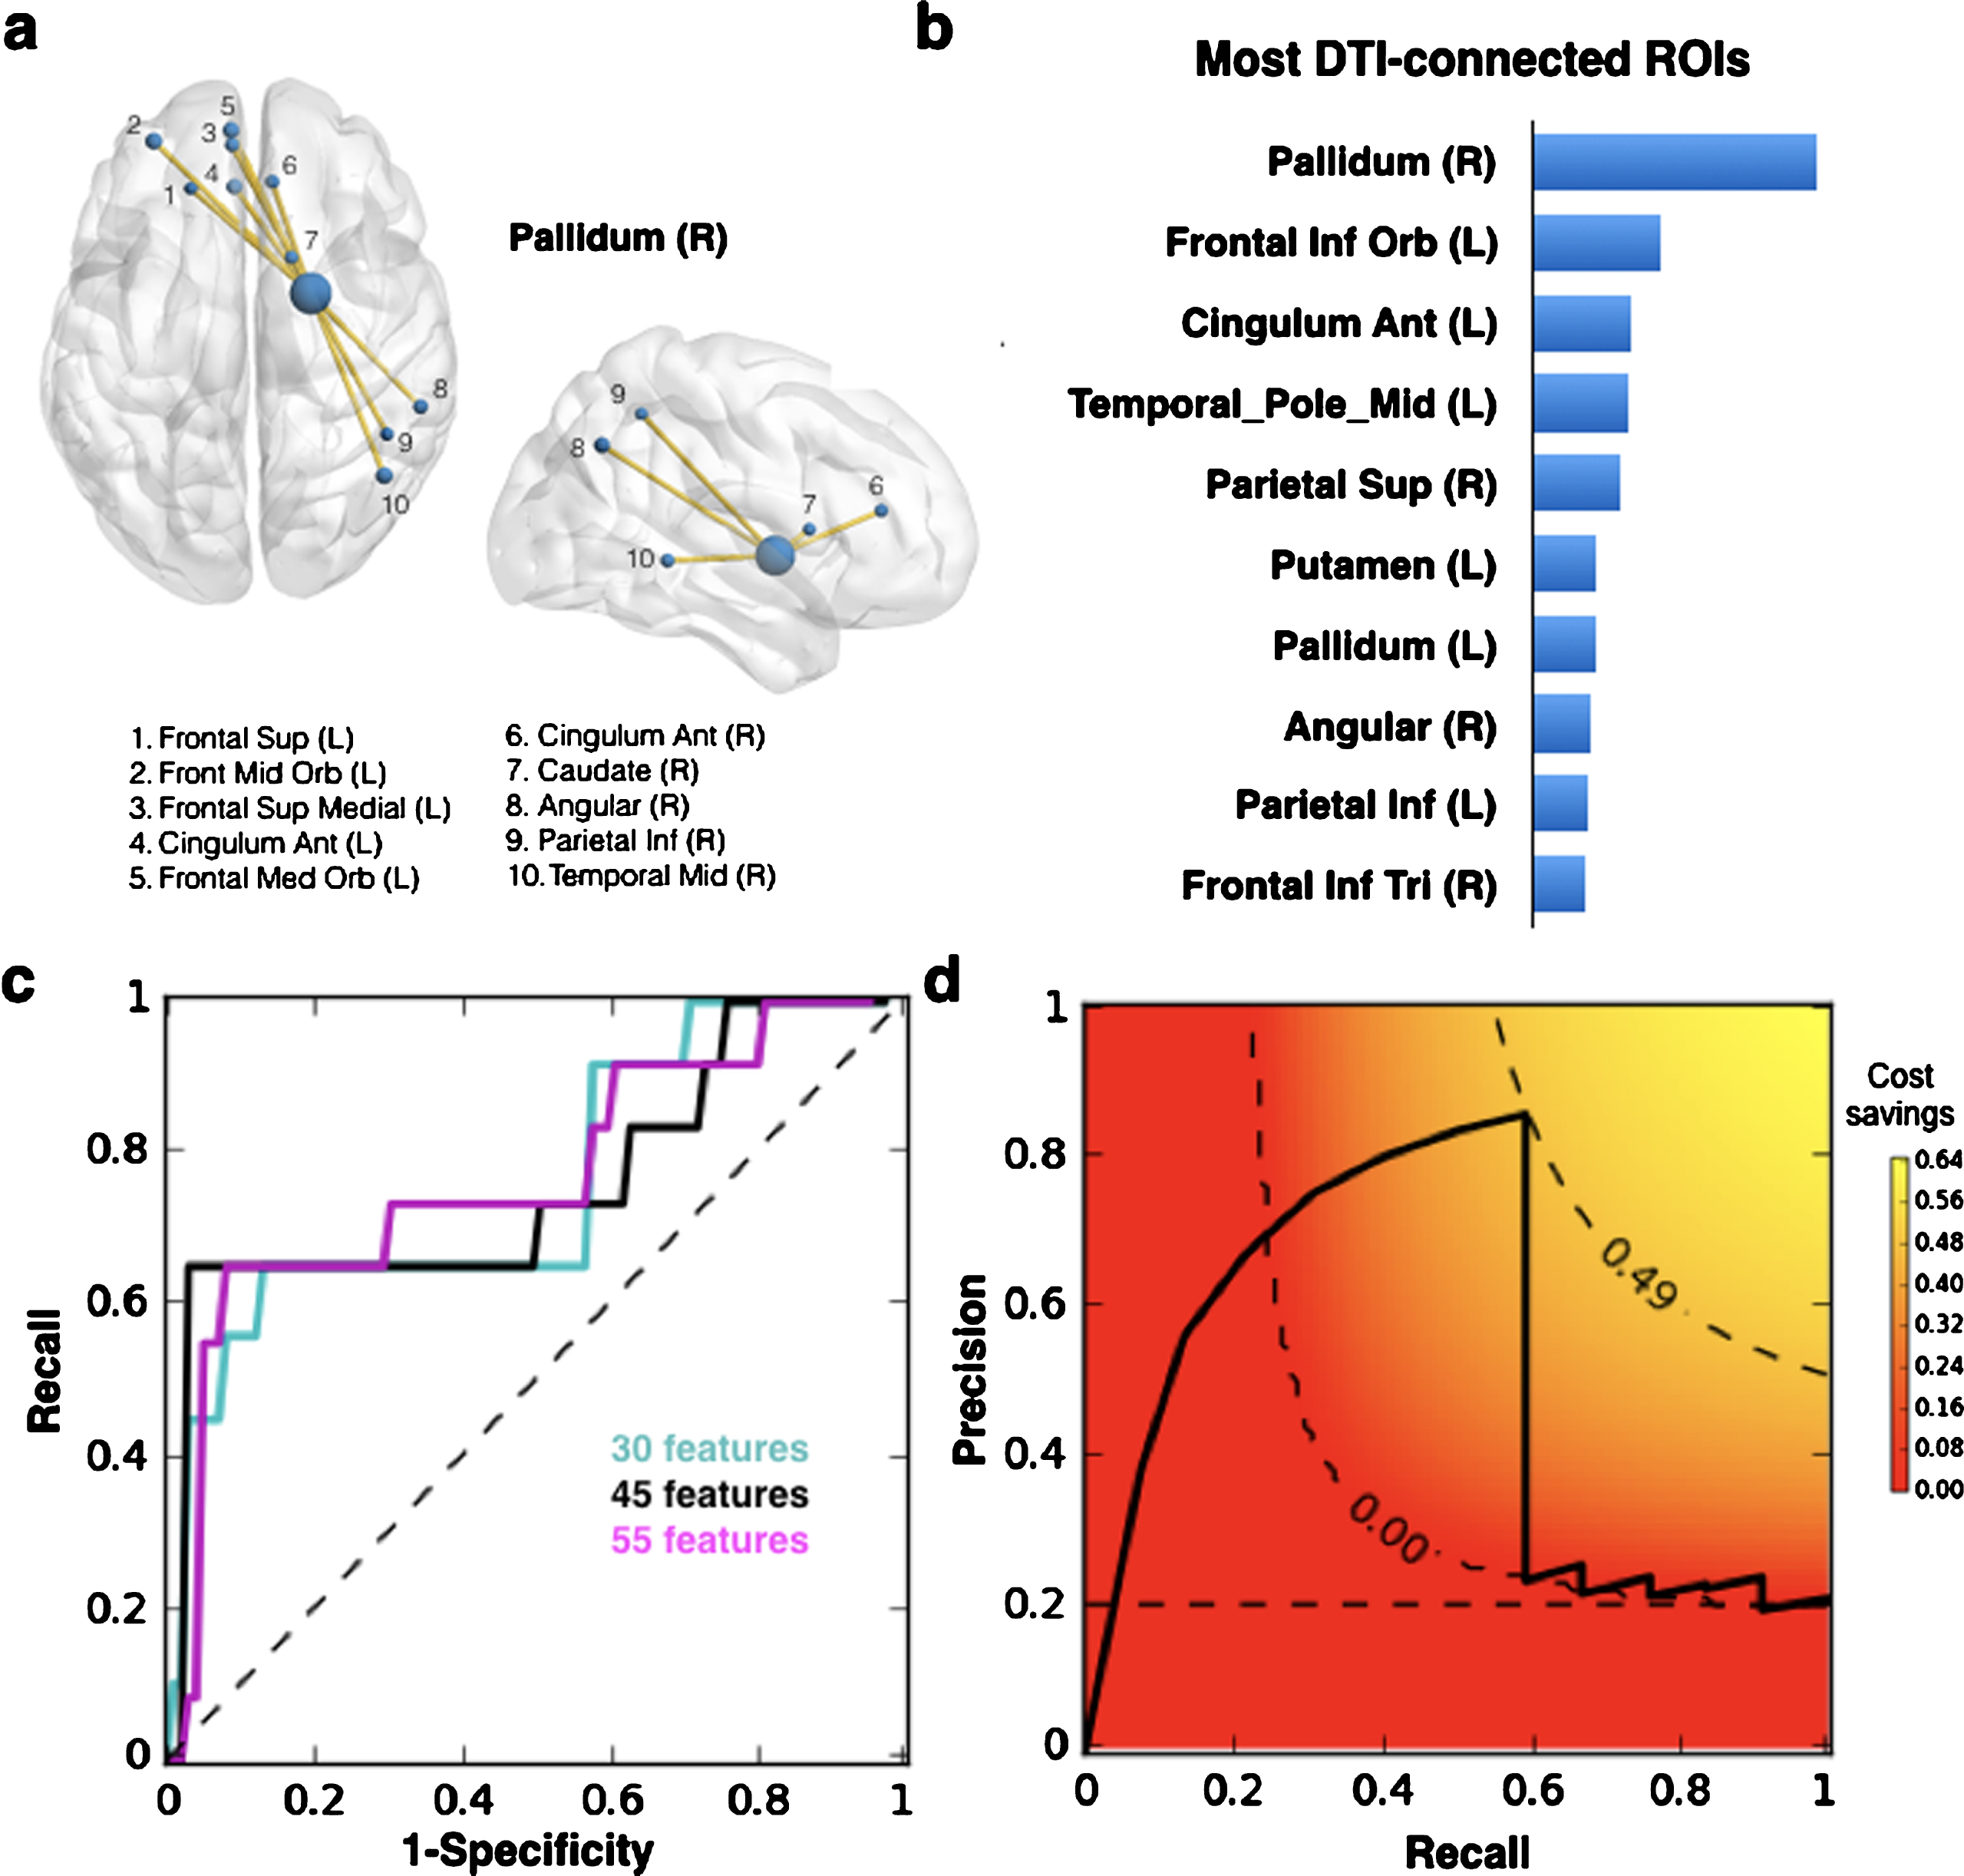
(a) Example ROI DTI connections to Pallidum as feature-pairs in the multimodal vector for machine learning. (b) Ranked list of most connected ROIs according to weighted sum of features from the SCM matrix based on the training set ADNI. Weights are provided by the LR decision function. (c) ROC analysis of the method performance for 30, 44, and 55 top ranking features for the multimodal T1 + DTI feature vector based on validation dataset HCB. (d) SavingsCOST as a function of precision-recall calculated based on the optimal number of features (n = 45) calculated on the validation dataset HCB. Color scale and dashed contour lines indicate savings. Contour line with savings = 0.001 demarks the boundary of the meaningful area of the precision-recall curve below which all savings = 0. Optimal P versus R pairing provides the highest savings (p = 0.85, R = 0.60, SavingsCOST = 49% ). Horizontal dotted line at p = 0.2 denotes savings of a random classifier.
The practical utility of our MRI-based screening protocol highly depends on the prevalence of PreAD subjects, which in turn, is intimately related with the age range and age distribution of the clinical study. At lower disease prevalence, savings rely on higher classifier precision to make the MRI-based screening layer worthwhile (Equation 1). This proposed recruitment protocol is most efficient for younger cohorts which are also best suited for secondary intervention trials.
Precision versus recall
Higher classifier precision reduces the number of unnecessary PET/CSF acquisitions (less false-positives). Higher classifier recall reduces the size of the initial participant pool for which MRI images need to be acquired by limiting the number of false negatives that are missed in the classification. Ensuring a cognitively healthy participant pool also incurs associated costs (e.g., additional cognitive/clinical tests) that scale up with the number of participants. While it is true that MRI-based screening relies on recruiting a larger initial cognitively healthy participant pool and therefore more MRI scans and cognition tests, we estimate that the proposed protocol is still more efficient in terms of saving economic and participant burden (see Supplementary Material C for details on more complex savings structure).
Example of application
In a standard clinical trial recruitment protocol, if the prevalence of PreAD is 20% , 1,500 individuals need to undergo CSF/PET test in order to identify 300 Aβ+ subjects. First, a preliminary MRI scan is acquired to exclude participants displaying incidental findings or other neuroradiological exclusion criteria. Instead, a modest MRI-based classifier (0.54 precision/0.84 recall), requires 1,807 MRI images to predict an identical pool of 300 Aβ positive individuals. From these images, only 555 will be predicted positive and sent for CSF/PET validation, with 300 resulting to be true positive and 255 will be false positives. This second protocol would spare 945 PET/CSF tests, in exchange for the additional 307 MRIs required to compensate for the false negatives missed by the classifier. In economic terms, the savings provided by the MRI-screening layer can prevent up to 60% unnecessary PET/CSF scans and save 47% of the cost as compared to the standard protocol that relies only the gold-standard CSF/PET measures.
Comparison to other approaches to detecting Aβ
At present, blood-based approaches to detecting Aβ+ are being actively pursued [27–29]. These methods show a high concordance (AUCs∼0.80– 0.90) between plasma Aβ species against PET imaging. Unlike our PreAD group that only included cognitively normal subjects, the performance of these methods was estimating including MCI and/or AD patients which might have favored them. Nevertheless, these works demonstrate a link between cerebral and peripheral Aβ alterations and, when validated and automated, they will represent a major resource to screen the general population and implement secondary AD prevention strategies. On the other hand, our MRI-based approach might be particularly useful in the context of research studies in which CSF and or PET imaging is envisaged, as in this case MRI scans are typically prescribed for safety reasons.
Other MRI-based approaches to detecting cerebral Aβ abnormalities is to develop MRI sequences that are sensible to amyloid burden or to other physiologic characteristics that correlate with amyloid deposition. In this line, MRI techniques have been developed which are sensitive to macromolecular changes that accompany amyloid accumulation [30], the integrity of brain tissue cellular structure [31] and tissue iron [32, 33] which showed a good correlation with amyloid PET imaging. These approaches could be combined into a single MRI protocol with others based on structural MRI alone, like the one presented in this paper, to improve the predictive power achieved by each modality separately.
Limitations
The main limitation in our study is the small sample size of the studied groups. This was due to the limitation of available T1 and DTI data of the same individuals in the two cohorts. Nevertheless, previous reports on standardizing the evaluation of algorithms for computer-aided diagnosis of dementia based on structural MRI recommend using small training sets (N∼30) to mimic the clinical setting where limited data is available and to avoid overtraining issues [34]. On the other hand, to maximize the generalizability of the performance evaluations, they prioritized applying the algorithms to independent datasets with different demographics and scanning parameters. Based on this rationale, we prioritized testing the algorithm in independent cohorts over the total sample size. Future studies will focus on validating similar approaches in larger test sets to better account for sample demographics and confounders. To this end, and given the results in this report, T1 data might solely achieve similar levels of classification accuracy. In addition, the small sample size has limited the complexity of the machine learning schemes that could be implemented robustly. Future studies with bigger samples sizes will also allow the investigation of potential improvements in classification performance of more complex classifying schemes. Nevertheless, we consider this report as a promising proof-of-concept as, even with a simple logistic regression model, robust performance can be achieved across two independent datasets with distinct demographic characteristics, potentially leading to significant savings of gold-standard procedures.
Another limitation of our experimental approach is that thresholds for Aβ+ may not be completely equivalent across the two cohorts. The respective CSF Aβ cut-offs have been independently validated to yield optimal discrimination between NC and AD patients on the respective analytical platforms (INNOTEST ELISA for HCB and xMAP-Luminex for ADNI). While absolute values are generally up to two to four times greater with the former compared to the latter, the correlation between them has been shown to be very high (r > 0.75) [35–37]. According to published conversion equations [36], the respective thresholds are within the interlaboratory reproducibility of the analytical platforms which fall in the rage of 15– 30% (% CV). Based on this rationale, we preferred to use published and validated cut-offs for comparability with previous reports. A similar limitation may arise from equating positivity based PET data unless CSF cut-offs are defined against visual reading of the scans, like in [38].
Future developments
Our study was restricted to a limited subject sample and therefore our models can only recognize a limited aspect of the PreAD signature. We expect an enhancement in performance when using larger training sets. We have adopted an atlas ROI-based approach using the AAL atlas that implements a rather coarse parcellation; future work will explore additional more fine-grained atlases or even explore voxel-based multivariate approaches. Despite their modest performance, our models could still be applied for prospective classification in an independent cohort. Follow-up efforts involve the application of this workflow to larger imaging datasets such as the one being acquired within our ALFA project [25]. Another line of improvement is to predict the actual CSF Aβ42 levels in order to dichotomize the result at a later stage or allowing to accommodate for optimal Aβ42 thresholds for different applications.
Conclusions
In this proof-of-concept study, we establish that machine learning can detect amyloid pathology in cognitively normal populations using T1 and DTI MRI. This method can be used prospectively for PreAD screening subjects in future cohorts, following appropriate data standardization. Such an approach can lead to significant reduction in participant burden and economic costs. The proposed application is not meant to replace gold-standard techniques for determination of amyloid pathology. Indeed, the benefit of this method relies on adding value to MRI images that have already been acquired, prior to PET scans in secondary prevention trials. In the near future, we ought to explore other biomarkers (p-tau, t-tau) and risk factors (APOE4) and their relationship with multimodal imaging features for the identification of preclinical AD. Taken together, MRI-based PreAD detection can make a valuable tool for secondary prevention trials and should be further validated in prospective multicenter clinical trials.
Footnotes
ACKNOWLEDGMENTS
PP thanks Grégory Operto and Raffaele Cacciagglia for insightful comments. This work has been partially supported by the projects BIGGRAPH-TEC2013-43935- R and MALEGRA TEC2016-75976-R financed by the Spanish Ministerio de Economía y Competitividad and the European Regional Development Fund (ERDF). AC is supported by the Spanish “Ministerio de Educación, Cultura y Deporte” FPU Research Fellowship. Juan D Gispert holds a “Ramón y Cajal” fellowship (RYC-2013– 13054). This work has received funding from the European Union’s Horizon 2020 research and innovation programme under the Marie Sklodowska-Curie action grant agreement No 707730.
Data collection and sharing for this project was funded by the Alzheimer’s Disease Neuroimaging Initiative (ADNI) (National Institutes of Health Grant U01 AG024904) and DOD ADNI (Department of Defense award number W81XWH-12-2-0012). ADNI is funded by the National Institute on Aging, the National Institute of Biomedical Imaging and Bioengineering, and through generous contributions from the following: AbbVie, Alzheimer’s Association; Alzheimer’s Drug Discovery Foundation; Araclon Biotech; BioClinica, Inc.; Biogen; Bristol-Myers Squibb Company; CereSpir, Inc.; Cogstate; Eisai Inc.; Elan Pharmaceuticals, Inc.; Eli Lilly and Company; EuroImmun; F. Hoffmann-La Roche Ltd and its affiliated company Genentech, Inc.; Fujirebio; GE Healthcare; IXICO Ltd.; Janssen Alzheimer Immunotherapy Research & Development, LLC.; Johnson & Johnson Pharmaceutical Research & Development LLC.; Lumosity; Lundbeck; Merck & Co., Inc.; Meso Scale Diagnostics, LLC.; NeuroRx Research; Neurotrack Technologies; Novartis Pharmaceuticals Corporation; Pfizer Inc.; Piramal Imaging; Servier; Takeda Pharmaceutical Company; and Transition Therapeutics. The Canadian Institutes of Health Research is providing funds to support ADNI clinical sites in Canada. Private sector contributions are facilitated by the Foundation for the National Institutes of Health (![]() ). The grantee organization is the Northern California Institute for Research and Education, and the study is coordinated by the Alzheimer’s Therapeutic Research Institute at the University of Southern California. ADNI data are disseminated by the Laboratory for Neuroimaging at the University of Southern California.
). The grantee organization is the Northern California Institute for Research and Education, and the study is coordinated by the Alzheimer’s Therapeutic Research Institute at the University of Southern California. ADNI data are disseminated by the Laboratory for Neuroimaging at the University of Southern California.