
Abstract
Cerebrospinal fluid (CSF) neurofilament light chain protein (NfL) and Alzheimer’s disease (AD) core biomarker levels have been evaluated in cohorts of patients with frontotemporal dementia spectrum (FTD), but the distribution of values across the different clinical syndromes and underlying proteinopathies, and the relative diagnostic accuracy appear discordant among studies. We measured CSF NfL, total (t)-tau, phosphorylated (p)-tau, and amyloid-β (Aβ)42 in healthy controls (n = 38) and subjects with a clinical, genetic, CSF biomarker-based, and/or neuropathological diagnosis of FTD (n = 141) or AD (n = 60). Sub-analyses were conducted in a proportion of subjects with definite and/or probable frontotemporal lobar degeneration with tau (FTLD-TAU) (n = 42) or TDP43 pathology (FTLD-TDP) (n = 36). Both FTD and AD groups showed significantly increased CSF NfL levels in comparison to controls (p < 0.001). CSF NfL levels were significantly higher in FTD patients than in AD (p < 0.001), reaching the highest values in amyotrophic lateral sclerosis associated with FTD. Patients with probable and definite FTLD-TDP had significantly higher NfL levels (p < 0.001) and lower p-tau/t-tau values (p < 0.001) in comparison with probable and definite FTLD-TAU cases. NfL showed good diagnostic accuracy in the distinction between FTD and controls (AUC 0.862±0.027) and yielded an accuracy (AUC 0.861±0.045) comparable to that of the p-tau/t-tau ratio (AUC 0.814±0.050), with 80.0% sensitivity and 81.0% specificity, in the discrimination between probable/definite FTLD-TAU and FTLD-TDP. Our data further validate CSF NfL as a surrogate biomarker of neurodegeneration and disease severity in patients with FTD spectrum. Moreover, they demonstrate a good diagnostic value for NfL and p-tau/t-tau ratio in the discrimination between FTLD-TAU and FTLD-TDP.
Keywords
INTRODUCTION
The term frontotemporal lobar degeneration (FTLD) encompasses a heterogeneous group of neurodegenerative pathologies, characterized by protein misfolding and aggregation, primarily affecting the frontal and temporal cortices. Based on the main protein involved, FTLD is currently classified into three major molecular subgroups, namely FTLD-TDP43, FTLD-TAU, and FTLD-FUS [1–3].
Major clinical syndromes within the frontotemporal dementia spectrum FTD include the behavioral variant of FTD (bvFTD), and the primary progressive aphasia (PPA), which in turn comprises the nonfluent/agrammatic (nfvPPA) and semantic (svPPA) variants. Moreover, amyotrophic lateral sclerosis associated with FTD (ALS-FTD), progressive supranuclear palsy (PSP), and corticobasal syndrome (CBS) are also commonly considered part of the FTD spectrum, given that they may also present with or develop symptoms of frontotemporal dysfunction [1–3].
Currently, sporadic CBS or PSP phenotypes and mutations in microtubule-associated protein tau gene (MAPT) are strongly predictive of FTLD-TAU pathology, while ALS-FTD, svPPA and pathogenic mutations in granulin or TAR DNA-binding protein 43 genes (GRN, TARDBP) or hexanucleotide repeat expansion on chromosome 9 open reading frame 72 gene (C9orf72 RE) predict FTLD-TDP [1–3]. However, it is still not possible to accurately diagnose an FTLD subtype based on clinical features due to the significant phenotypic overlap between FTLD associated proteinopathies and between Alzheimer’s disease (AD) and FTD [2]. Moreover, at variance with AD [4], the search for discriminatory or disease-specific biomarkers in biofluids has been, to date, less successful for FTLD. Apart from decreased progranulin concentration in serum or cerebrospinal fluid (CSF) for GRN mutation-related FTLD, an established biomarker for this subgroup of FTLD-TDP, the most promising results have come from studies focused on CSF phosphorylated-tau to total-tau ratio (p-tau/t-tau), and neurofilament light chain protein (NfL) [5–19]. However, there have been some divergent results between studies regarding the distribution of biomarker values across the different clinical syndromes and proteinopathies, specifically FTLD-TAU and FTLD-TDP. Moreover, very few studies included all clinical syndromes of FTD spectrum as well as AD cases, and/or evaluated the association between CSF biomarker levels and neuropsychological data [8, 18]. In this regard, there is the need for further investigations and data validation in independent and well-characterized cohorts.
In the present study, we have systematically analyzed CSF NfL, t-tau, p-tau, p-tau/t-tau, and amyloid-β 1–42 (Aβ42) levels in a large single-center cohort of Italian patients with FTD spectrum, including all clinical subtypes. Furthermore, we investigated the possible correlations between CSF biomarker levels and scores at neuropsychological testing.
MATERIALS AND METHODS
Study cohort and patient classification
We retrospectively analyzed 249 CSF samples submitted for analysis to the Neuropathology Laboratory at the Institute of Neurological Sciences of Bologna obtained between 2005 and 2016 from 151 clinically, genetically, or pathologically diagnosed FTD patients, 60 AD patients, and 38 cognitively healthy controls. Within the FTD group, 141 cases lacking evidence of significant co-morbidity, e.g., AD, dementia with Lewy bodies (DLB), prion disease, and vascular dementia, were selected (Fig. 1A).

Flow-chart indicating the selection of the cohort of FTD cases (A) and the classification of the FTD cases into FTLD-TAU and FTLD-TDP groups (B). AD, Alzheimer’s disease; ALS-FTD, amyotrophic lateral sclerosis associated with frontotemporal dementia; bvFTD, behavioral variant of frontotemporal dementia; C09ORF72, hexanucleotide repeat expansion on chromosome 9 open reading frame 72 gene; CBD, corticobasal degeneration; CBS, corticobasal syndrome; FTD, frontotemporal dementia; FTD+PARK, frontotemporal dementia associated with parkinsonism; FTLD-TAU, frontotemporal lobar degeneration with tau pathology; FTLD-TDP, frontotemporal lobar degeneration with TDP43 pathology; GRN, granulin gene; MAPT, microtubule-associated protein tau gene; nfvPPA, nonfluent/agrammatic variant of primary progressive aphasia; PSP, progressive supranuclear palsy; svPPA, semantic variant of primary progressive aphasia; TARDPB, TAR DNA-binding protein 43 gene. *p-tau/Aβ42 ratio >0.108, t-tau/Aβ42 ratio >0.615, Aβ42 <495 pg/ml and Aβ42/Aβ40(×10) <0.706.
The study was approved by the Local Ethics Committee and conducted according to the revised Declaration of Helsinki and Good Clinical Practice guidelines. Informed consent was given by study participants or the next of kin.
For each patient, we collected the clinical history, results of neurological examination(s), including the evaluation of cognitive status (see also below), and those of neuroimaging investigations, such as brain computed tomography (CT), brain magnetic resonance imaging (MRI), fluorodeoxyglucose-positron emission tomography, and cerebral blood flow single photon emission computed tomography.
FTD patients were classified in the following clinical syndromes, according to established criteria: bvFTD (n = 53), nfvPPA (n = 10), svPPA (n = 1), ALS-FTD (n = 20), CBS (n = 25), and PSP (n = 24) [20–24]. Furthermore, 18 patients, who met criteria for bvFTD and/or PPA but also showed extrapyramidal signs (in the presence of a mixed phenotype or not fully satisfying the criteria for CBS or PSP diagnosis), were classified as FTD+parkinsonism.
A definite diagnosis of FTLD was obtained neuropathologically in 4 cases [1 corticobasal degeneration (CBD), and 2 FTLD-TDP (one with RE in C9orf72)], based on established diagnostic criteria [25] (Supplementary Table 1). Briefly, 7μm thick sections from formalin-fixed and paraffin-embedded tissue blocks, including all brain regions of interest [25] were stained with hematoxylin-eosin for screening and by immunohistochemistry with antibodies specific for p-tau (AT8, 1:100, Innogenetics), hyperphosphorylated TDP-43 (phospho Ser 409/410-1 polyclonal antibody, 1:1000, CosmoBio Co), p62 lck ligand (clone 3, 1:1000, BD Biosciences), and Aβ (4G8, 1:5000, Signet Labs).
Furthermore, the diagnosis of FTLD was strongly supported by molecular genetic findings (RE in C9orf72, n = 8; pathogenic mutations in GRN, n = 9; TARDBP, n = 3; MAPT, n = 1; and FUS, n = 1) in 22 additional patients [1–3, 26]. In patients who met criteria for FTD clinical syndromes, the confirmed diagnostic suspicion after at least two years of follow-up was an adjunctive criterion.
In vivo evidence of AD pathology was gathered using the AD core CSF biomarkers and in-house calculated cut-offs [4]. Specifically, a p-tau/Aβ42 ratio >0.108, a t-tau/Aβ42 ratio >0.615, values of Aβ42 <495 pg/ml and values of Aβ42 to amyloid-β 1–40 ratio [Aβ42/Aβ40(×10)]<0.706 were considered supportive for AD. These cut-offs were obtained based on maximized Youden Index at receiver operating characteristic (ROC) analyses between a group of clinically or neuropathologically diagnosed AD patients (n = 74) and a group of age and sex-matched cognitively healthy subjects (n = 42).
In the FTD patients (n = 141), the in vivo evidence for AD co-pathology was determined based on abnormal p-tau/Aβ42 and/or t-tau/Aβ42 ratios. However, when a ratio (or both) was (were) above threshold in association with an Aβ42 lower than 495 pg/ml (n = 27), a pathological Aβ42/Aβ40(×10) ratio was also required as further criteria (i.e., we excluded only the cases with an Aβ42/Aβ40 ratio <0.706).
As expected, most (8 out of 10) patients who met the exclusion criteria had a clinical diagnosis of CBS, reflecting the higher incidence of AD pathology in CBS in comparison to the other FTD syndromes [27]. The clinical diagnosis in the remaining two cases was bvFTD and FTD+parkinsonism (Fig. 1A).
The concomitant cerebrovascular disease was excluded based on MRI or CT findings. The presence of underlying synucleinopathy (DLB) was ruled out by the absence of suggestive signs, such as clinically or neurophysiologically confirmed dysautonomia, clinically reported REM behavior disorder, fluctuating cognition, or a positive cardiac MIBG scintigraphy [28]. Finally, underlying prion disease was excluded based on absence of typical basal ganglia and/or cortical hyperintensities at fluid-attenuated inversion recovery and/or diffusion-weighted MRI, a negative 14-3-3 assay, t-tau levels lower than 1250 pg/ml and, in most suspicious cases, a negative prion real time quaking induced conversion assay [29].
For the AD group, the clinical diagnosis was made according to the International Working Group 2 criteria and was supported by a characteristic AD CSF biomarker profile (pathological values of p-tau/Aβ42 and t-tau/Aβ42 ratios according to our in-house cut-offs) [4]. In particular, after a clinical follow-up of at least 24 months, 52 AD cases fulfilled the criteria for typical AD, 4 for the atypical AD-logopenic variant, 4 for the atypical AD-posterior variant. Moreover, in 2 autopsied cases, the neuropathological assessment revealed an intermediate or high degree of AD pathology [30]. In AD cases vascular comorbidity was excluded based on neuroimaging findings.
The control group included 38 age- and sex-matched subjects lacking any clinical or neuroradiological evidence of CNS disease (e.g., psychiatric disorders, non-inflammatory polyneuropathies, tension-type headache, subjective complaints), and having normal values of p-tau/Aβ42 and t-tau/Aβ42 ratios.
For the analysis of biomarker values in the distinction between FTLD-TAU and FTLD-TDP, we merged the subjects with high level of certainty in their diagnosis and sufficient evidence predicting the underlining neuropathology (n = 53) with those with a definite diagnosis of FTLD-TAU (n = 3) and FTLD-TDP (n = 22) (Fig. 1B). Specifically, the probable/definite FTLD-TAU group (n = 42) included patients with: 1) a pathological diagnosis of tauopathy (PSP, CBD) (n = 2); 2) a pathogenic mutation in MAPT (n = 1); or 3) a clinical diagnosis of sporadic CBD or PSP (n = 39). At variance, the probable/definite FTLD-TDP group (n = 36) comprised patients with: 1) a pathological diagnosis of TDP43 pathology (n = 2); 2) a pathogenic mutation in C9orf72 (n = 9, including one with pathological diagnosis), GRN (n = 9) and TARDBP (n = 3); 3) a diagnosis of sporadic ALS-FTD (n = 13) or (4) a diagnosis of svPPA (n = 1) (Fig. 1B).
Genetic analysis
All FTD and AD cases with a positive familial history for dementia and/or those with a clinical history compatible with early-onset neurodegenerative dementia (<60 years) (87 FTD and 23 AD) were screened for variants in 27 dementia-associated genes, using the IlluminaMiSeq sequencer with the amplicon-based assay TruSeqCustom Amplicon v1.5 (TSCA, Illumina), as previously described [26]. Major screened genes included APP, PSEN1, PSEN2, GRN, MAPT, TARDBP, FUS, VCP, SQSTM1, HNRNPA2B1,CHMP2B, UBQLN2, OPTN, DCTN1. In the same patient group, we also screened for the presence of the C9orf72 RE using the 2-step strategy with southern blotting confirmation, as previously described [26, 31]. In the present study, only previously reported pathogenic mutations were considered for patient classification.
CSF biochemical analysis
CSF samples were obtained by lumbar puncture (LP) at L3/L4 or L4/L5 levels following a standard procedure, centrifuged in case of blood contamination (even mild), divided into aliquots and stored in polypropylene tubes [Eppendorf ® Safe-Lock micro tubes (0.5–1.5 ml) vials substituted by Sarstedt screw-cup microtubes (0.5 ml) at the end of 2013] at –80°C until analysis.
Samples were handled and analyzed by the same senior laboratory technician blinded to patients’ diagnoses. CSF t-tau, p-tau, Aβ42, and Aβ40 levels were analyzed using commercially available enzyme-linked immunosorbent assay (ELISA) kits (INNOTEST htau-Ag, INNOTEST phosphorylated-Tau181, INNOTEST Aβ1–42 and INNOTEST Aβ1–40; Innogenetics/Fujirebio Europe) according to the manufacturer’s instructions. NfL protein levels were analyzed using a commercially available ELISA kit (IBL, Hamburg, Germany), as previously described [16]. The measurement of NfL in samples from the same patients (n = 5) with repeated freeze-thaw cycles (up to 3) did not show a significant reduction in protein levels in agreement with previous studies showing that NfL proteins are stable under the most prevalent pre-analytical variations [32]. The mean intra-assay coefficients of variation (CVs) of the assays were 3.9% for NfL, 3.3% for t-tau, 2.5% for p-tau, 2.4% for Aβ42 and 2.9% for Aβ40, whereas the mean inter-assay CVs were 10.4 % (range 9.6–11.3) for NfL, 6.6% (range 6.0–7.2) for t-tau, 5.4% (range 4.4–6.5) for p-tau, 5.7% (range 5.4–6.1) for Aβ42, and 8.8% (range 7.0–10.6) for Aβ40.
Neuropsychological testing in FTD patients
Neuropsychological evaluation included the Mini-Mental State Examination (MMSE) (range: 1.93–35.24; cut-off: <23.8) [33], Brief Mental Deterioration Battery (BMDB) [34], and/or other specific batteries for which the affected cognitive domains but not the detailed scores were available. Overall, the neuropsychological testing was performed in 118 patients (MMSE n = 98, BMBD n = 84, other batteries n = 20) within two weeks of CSF collection.
BMDB included the Rey Auditory Verbal Learning Test with immediate and delayed recall (range: 0–75; cut-off: <4.69) [35], the immediate visual memory test (range: 0–22; cut-off: <13.85) [35], the visual search test (Barrage test) (time cut-off: ≥90; score cut-off: ≤9; errors cut-off: ≥2; result cut-off: >2.5) [34], and the verbal abstract thinking test (analogies test) (range: 0–20; cut-off: <15.1) [34]. A final score for BMDB was calculated as a measure of global cognitive function, as described [34].
Moreover, a large proportion of FTD cases underwent the phonemic (range: 0-infinite; cut-off: <17.35) [35] and semantic verbal fluency tests (range: 0-infinite; cut-off: <25) (n = 83) [36], the copy design test (range: 0–12; cut-off: <7.18) [35] (n = 82), the Stroop test (time cut-off: >27.5; errors cut-off: >7.5) (n = 82) [37], the Frontal Assessment Battery (FAB) (range: 0–18; cut-off<13.48) (n = 38) [38], and the Beck Depression Inventory (range 0–63; cut-off: >9) (n = 27) [39]. All test results were corrected for age and education, according to standardized values obtained in the Italian population.
Statistical analyses
Statistical analysis was performed using IBM SPSS Statistics version 21 (IBM, Armonk, NY, USA), R version 3.4.4 (R Foundation, Wien, Austria) and GraphPad Prism 7 (GraphPad Software, La Jolla, CA) softwares. Depending on the data distribution the Mann-Whitney U test or the t-test were used to test differences between two groups, while the Kruskal-Wallis test or the one-way ANOVA (followed by Tukey’s post hoc test) were applied for multiple group comparisons. Based on the presence or not of a normal distribution of the values, data were expressed as mean±standard deviation (SD) or median and interquartile range (IQR), respectively. A Bonferroni correction was applied to multiple comparisons. ROC analyses were performed to establish the diagnostic accuracy, sensitivity, and specificity of each biomarker or combination of biomarkers. The optimal cut-off value for biomarkers was chosen using the maximized Youden index. The Youden index for a cut-off is defined by its sensitivity+specificity-1. Depending on the presence of an equal or divergent direction of the ROC curves, the Delong or the Bootstrap test were used to compare the different area under the curve (AUC) values. The Spearman bivariate test was used to detect the strength of correlation between some of the analyzed variables. Differences were considered statistically significant at p < 0.05.
RESULTS
There were no significant differences regarding age, education, and sex distribution among patient groups (Table 1). The MMSE score showed a significant difference between FTD and AD groups (p < 0.001), as previously reported [40], while it did not differ significantly among FTD syndromes.
Demographics and results of cognitive assessment
AD, Alzheimer’s disease; ALS-FTD, amyotrophic lateral sclerosis associated with frontotemporal dementia; bvFTD, behavioral variant of frontotemporal dementia; CBS, corticobasal syndrome; FTD, frontotemporal dementia; LP, lumbar puncture; MMSE, Mini-Mental State Examination; N, number; nfvPPA, nonfluent/agrammatic variant of primary progressive aphasia; PPA, primary progressive aphasia; PSP, progressive supranuclear palsy; SD, standard deviation; svPPA, semantic variant of primary progressive aphasia; y, years.
Effect of demographic and pre-analytical variables on CSF biomarker results
Age showed no significant correlation with any of the biomarker values in probable/definite FTLD-TAU, probable/definite FTLD-TDP and AD groups. In the three groups, there was no effect of sex and time from clinical onset to LP on NfL, t-tau, p-tau, and Aβ42 levels.
Since we changed the type of polypropylene vials during the study (since the end of 2013), we also tested the possible effect of this variable on CSF biomarker results. There were no significant differences in biomarker values between subgroups of AD, FTD patients, or controls sampled before and after 2014.
CSF NfL, t-tau, p-tau, t-tau/p-tau and Aβ42 levels in the diagnostic groups (Table 2)
CSF biomarker data in the diagnostic groups
Aβ42, amyloid-β 1-42; AD, Alzheimer’s disease; ALS-FTD, amyotrophic lateral sclerosis associated with frontotemporal dementia; bvFTD, behavioral variant of frontotemporal dementia; CBS, corticobasal syndrome; FTD, frontotemporal dementia; IQR, interquartile range; LP, lumbar puncture; mo, months; N, number; NfL, neurofilament-light chain protein; nfvPPA, nonfluent/agrammatic variant of primary progressive aphasia; PPA, primary progressive aphasia; PSP, progressive supranuclear palsy; p-tau, phosphorylated tau protein; svPPA, semantic variant of primary progressive aphasia; SD, standard deviation; t-tau, total tau protein. # bvFTD versus ALS-FTD p = 0.017; bvFTD versus FTD+parkinsonism p = 0.032; bvFTD versus PSP p = 0.011; bvFTD versus AD p = 0.008; CBS versus ALS-FTD p = 0.006; ALS-FTD versus FTD+parkinsonism p = 0.006; ALS-FTD versus PSP p < 0.001; ALS-FTD versus AD p < 0.001; FTD+parkinsonism versus PPA p = 0.026; PPA versus PSP p = 0.015; PPA versus AD p = 0.015. *FTD versus controls p < 0.001; FTD versus AD p < 0.001; AD versus controls p < 0.001; ALS-FTD versus bvFTD p = 0.01; ALS-FTD versus PPA p = 0.028; ALS-FTD versus CBS p < 0.001; ALS-FTD versus PSP p < 0.001; ALS-FTD versus FTD-parkinsonism p < 0.001; bvFTD versus AD p = 0.017; PPA versus AD p = 0.004; ALS-FTD versus AD p < 0.001. § AD versus controls p < 0.001; FTD versus AD p < 0.001; each FTD group versus AD p < 0.001. ¶AD versus controls p < 0.001; FTD versus AD p < 0.001; each FTD group versus AD p < 0.001. ¥AD versus controls p < 0.001; FTD versus AD p < 0.001; PSP versus bvFTD p = 0.005; PSP versus PPA p < 0.001; PSP versus ALS-FTD p = 0.015. α controls versus AD p < 0.001; FTD versus AD p < 0.001; each FTD group versus AD p < 0.001.
Both FTD (each group) and AD patients had significantly higher CSF NfL levels than controls (each group versus controls p < 0.001). bvFTD (p = 0.017), PPA (p = 0.004), and ALS-FTD (p < 0.001) groups showed higher NfL levels than AD patients, while ALS-FTD cases demonstrated higher NfL levels in comparison to all the other FTD subtypes (ALS-FTD versus bvFTD p = 0.01; ALS-FTD versus PPA p = 0.028; ALS-FTD versus CBS p < 0.001; ALS-FTD versus PSP p < 0.001; ALS-FTD versus FTD-parkinsonism p < 0.001) (Fig. 2A).
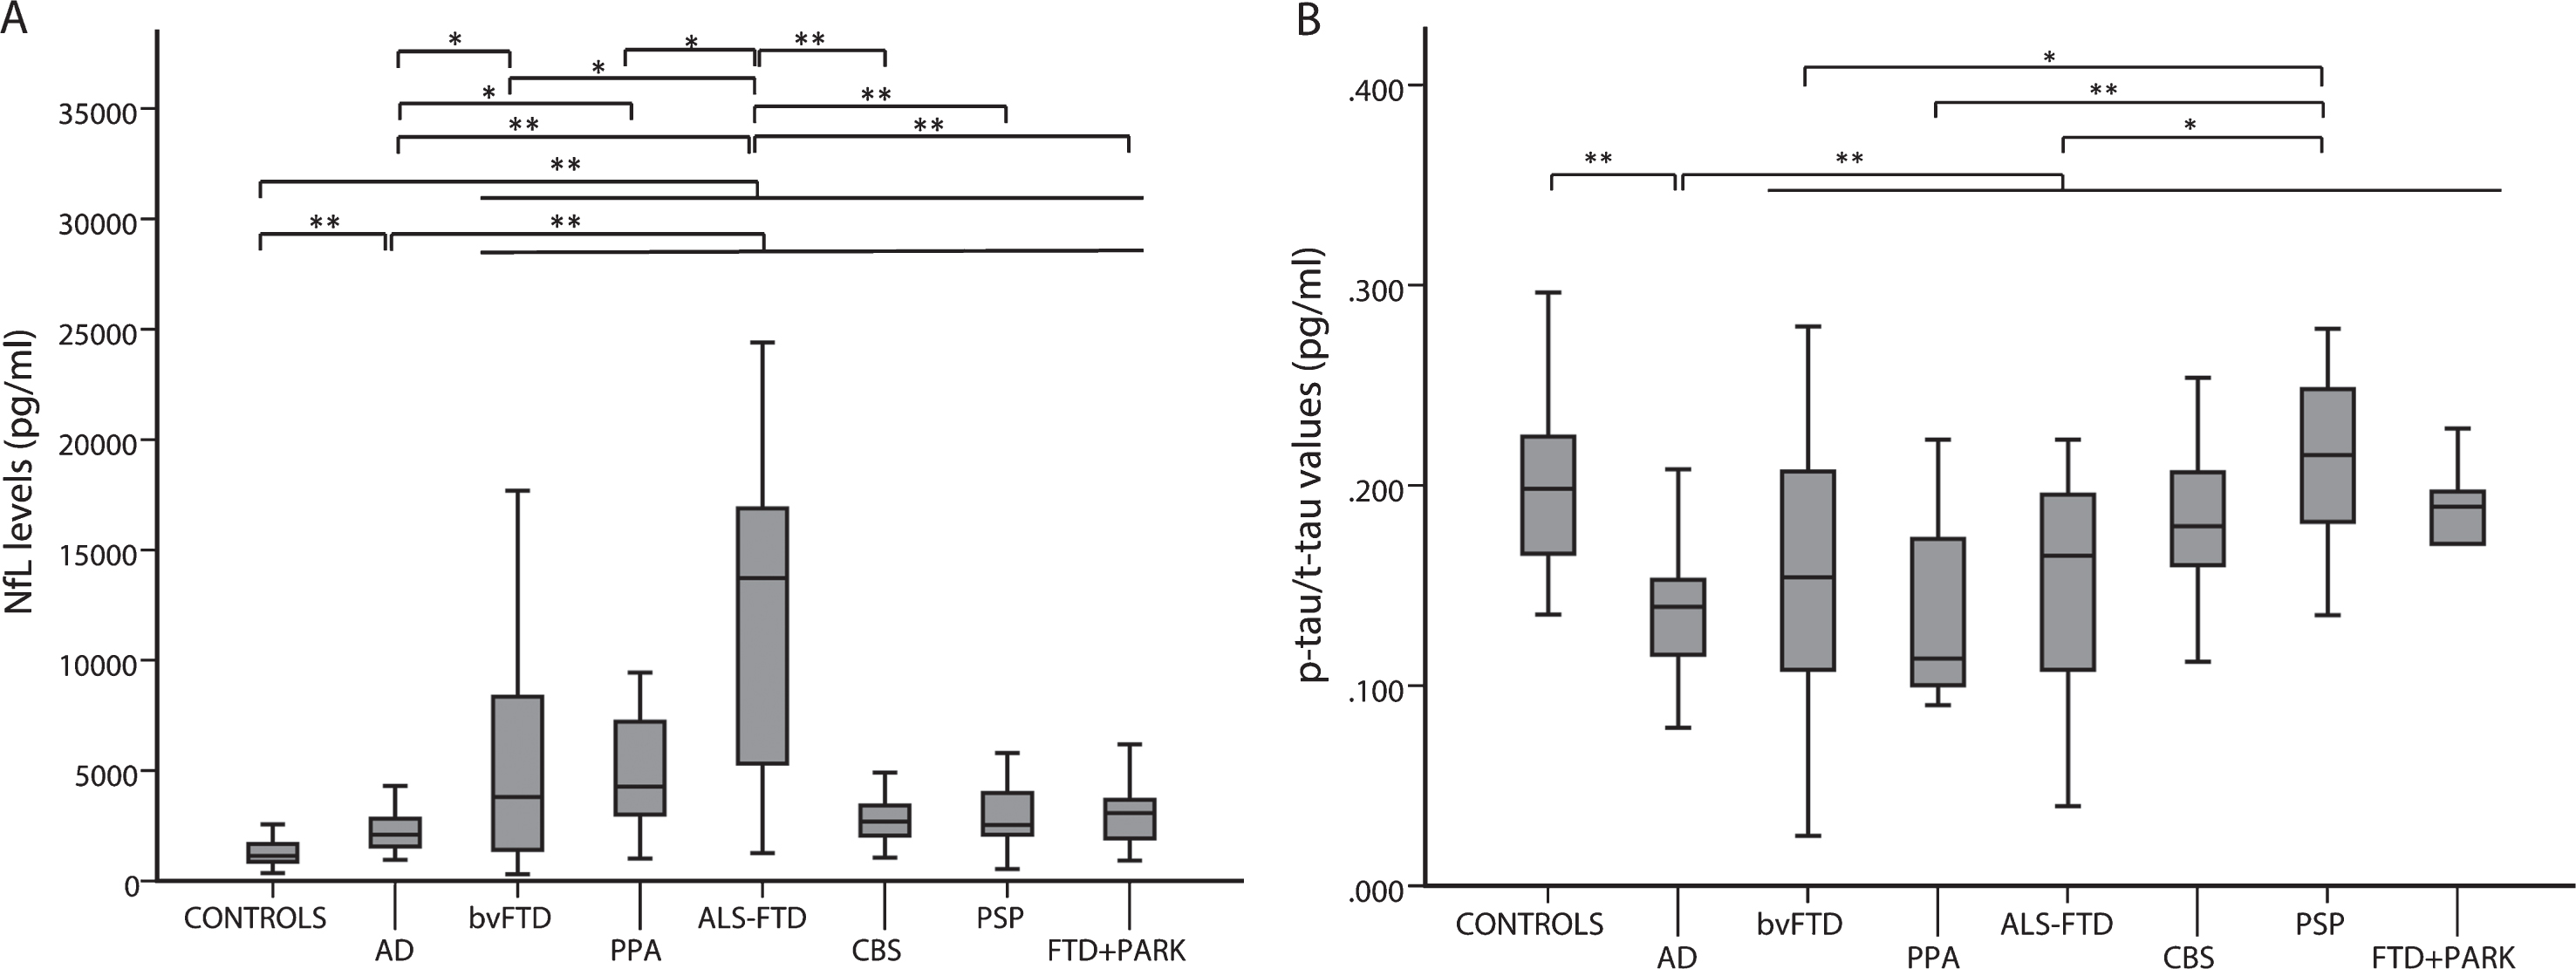
CSF NfL levels (A) and p-tau/t-tau values (B) in FTD subgroups, AD, and controls. *p < 0.05; **p < 0.001.
While there were no differences regarding t-tau, p-tau, Aβ42 levels, and p-tau/tau ratio between each FTD group and controls, t-tau, and p-tau levels were significantly higher and Aβ42 significantly lower in AD than in FTD (each group) (p < 0.001 in all comparisons) (Supplementary Figures 1–3).
Both FTD and controls showed significantly higher p-tau/t-tau values compared to AD (p < 0.001). Finally, PSP patients showed higher values of p-tau/t-tau ratio in comparison to those with bvFTD (p = 0.005), PPA (p < 0.001), and ALS-FTD (p = 0.015) (Fig. 2B).
CSF biomarkers in probable/definite FTLD-TAU and FTLD-TDP cases (Table 3)
CSF biomarker data in probable/definite FTLD-TAU and FTLD-TDP groups.
Aβ42, amyloid-β 1–42; AD, Alzheimer’s disease; ALS, amyotrophic lateral sclerosis; FTLD-TAU, frontotemporal lobar degeneration with tau pathology; FTLD-TDP, frontotemporal lobar degeneration with TDP43 pathology; IQR, interquartile range; LP, lumbar puncture; mo, months; N, number; NfL: neurofilament-light chain protein; p-tau, phosphorylated tau protein; SD, standard deviation; t-tau: total tau protein. # probable/definite FTLD-TAU versus FTLD-TDP with ALS p < 0.001; AD versus FTLD-TDP with ALS p < 0.001. *probable/definite FTLD-TAU versus controls p < 0.001; probable/definite FTLD-TDP versus controls p < 0.001; probable/definite FTLD-TDP versus probable/definite FTLD-TAU p < 0.001; FTLD-TDP with ALS versus controls p < 0.001; FTLD-TDP without ALS versus controls p < 0.001; FTLD-TDP with ALS versus probable/definite FTLD-TAU p < 0.001; FTLD-TDP without ALS versus probable/definite FTLD-TAU p < 0.001; probable/definite FTLD-TDP versus AD p < 0.001; FTLD-TDP with ALS versus AD p < 0.001; FTLD-TDP without ALS versus AD p < 0.001. § AD versus probable/definite FTLD-TAU p < 0.001; probable/definite FTLD-TDP versus controls p < 0.001; FTLD-TDP without ALS versus controls p < 0.001; probable/definite FTLD-TDP versus AD p < 0.001; AD versus FTLD-TDP with ALS p < 0.001; AD versus FTLD-TDP without ALS p < 0.001. ¶AD versus probable/definite FTLD-TAU p < 0.001; AD versus probable/definite FTLD-TDP p < 0.001; AD versus FTLD-TDP with ALS p < 0.001; AD versus FTLD-TDP without ALS p < 0.001. ¥ probable/definite FTLD-TAU versus AD p < 0.001; probable/definite FTLD-TDP versus AD p < 0.001; FTLD-TDP without ALS versus controls p < 0.001; probable/definite FTLD-TAU versus FTLD-TDP with ALS p = 0.012; probable/definite FTLD-TAU versus FTLD-TDP without ALS p < 0.001. α probable/definite FTLD-TAU versus AD p < 0.001; FTLD-TDP versus AD p < 0.001; FTLD-TDP with ALS versus AD p < 0.001; FTLD-TDP without ALS versus AD p < 0.001.
Both NfL levels and p-tau/t-tau values significantly differed between probable/definite FTLD-TAU and probable/definite FTLD-TDP (p < 0.001 for each comparison). Specifically, probable/definite FTLD-TDP cases showed higher NfL levels and lower p-tau/t-tau values in comparison to probable/definite FTLD-TAU (Fig. 3A, B). There were no other differences in biomarker values between the two groups.
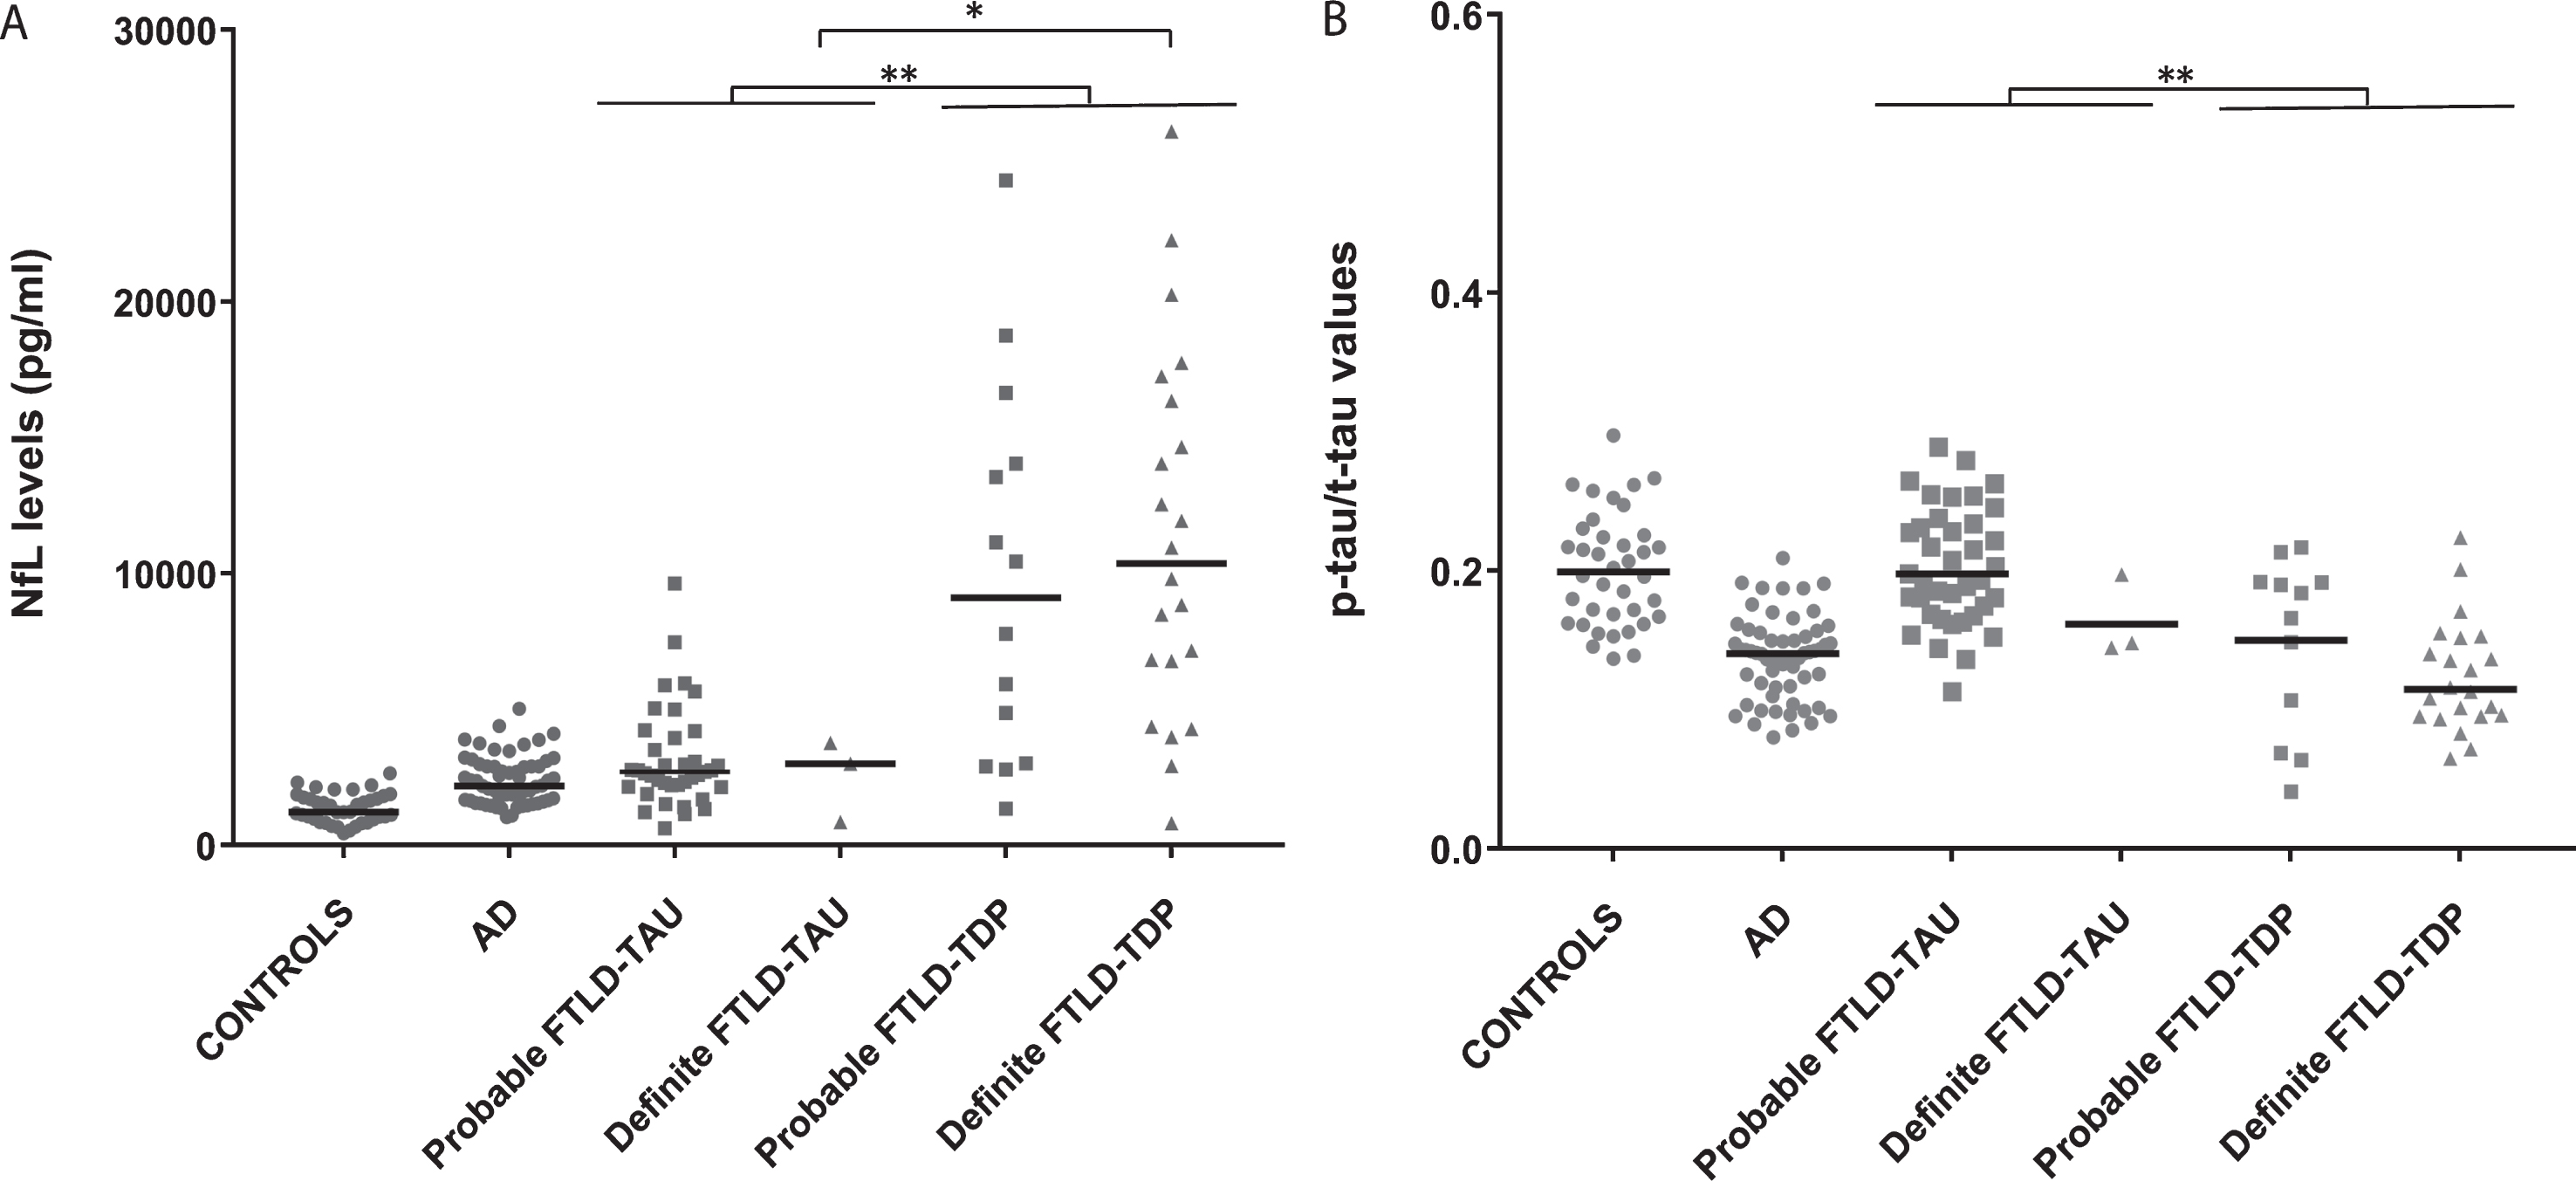
CSF NfL levels (A) and p-tau/t-tau values (B) in FTLD-TAU, FTLD-TDP, AD groups. and controls. Horizontal lines represent medians. *p < 0.05; **p < 0.001.
When limited to cases with a definite diagnosis (3 FTLD-TAU and 22 FTLD-TDP cases), the analysis confirmed the significant difference in NfL (p = 0.028) values, but not in p-tau/t-tau ratio (p = 0.128), between the two groups (Fig. 3A, B).
Both probable/definite FTLD-TDP with ALS (n = 20) and probable/definite FTLD-TDP without ALS (n = 16) showed significantly higher NfL levels (p < 0.001 for each comparison) and lower p-tau/t-tau values (p = 0.012 and p < 0.001, respectively) when compared to those with probable/definite FTLD-TAU. In contrast, the comparison between probable/definite FTLD-TDP with ALS and probable/definite FTLD-TDP without ALS failed to reveal any significant difference in biomarker values.
C9orf72 RE carriers had higher NfL levels (median 16300 pg/ml, IQR 12950-21200) than those with GRN (median 6785 pg/ml, IQR 4093-11700) (p = 0.024) and TARDP (median 4332 pg/ml, IQR 2891-4332) (p = 0.036) mutations. Other biomarker values were, instead, similar among the three genetic groups.
Diagnostic accuracy of CSF biomarkers in the differentiation between FTLD groups and controls (Table 4)
Diagnostic value of CSF biomarkers in the differential diagnosis between diagnostic groups.
Aβ42, amyloid-β 1–42; AUC, area under the curve; FTD, frontotemporal dementia; FTLD-TAU, frontotemporal lobar degeneration with tau pathology; FTLD-TDP, frontotemporal lobar degeneration with TDP43 pathology; NfL, neurofilament-light chain protein; p-tau, phosphorylated tau protein; SD, standard deviation; sens, sensitivity; spec, specificity; t-tau, total tau protein.
In the comparison between FTD and controls, the AUC value was significantly higher for NfL (AUC 0.862±0.027) than for t-tau (p < 0.001), p-tau (p < 0.001), p-tau/t-tau (p < 0.001), and Aβ42 (p < 0.001). Specifically, a NfL cut-off value of 1844 pg/ml yielded 78.4% sensitivity and 81.6% specificity in the discrimination between the two groups. In the same comparison, the accuracy of p-tau/t-tau ratio was, instead, similar to those of t-tau (p = 0.775), p-tau (p = 0.125) and Aβ42 (p = 0.796).
In the discrimination between probable/definite FTLD-TAU and FTLD-TDP, using a cut-off value of 4225 pg/ml, NfL yielded a moderate accuracy (AUC 0.861±0.045) with 80.0% sensitivity and 81.0% specificity, which was comparable to the diagnostic power of the p-tau/t-tau ratio (AUC 0.814±0.050) (p = 0.390). Moreover, both NfL and p-tau/tau ratio showed significantly higher AUC values in comparison to t-tau (p = 0.026 and p = 0.018, respectively), p-tau (p < 0.001 and p < 0.001, respectively), and Aβ42 (p < 0.001 and p = 0.003, respectively) in the same comparison. The results of the application of these cut-offs in groups with unknown underlying neuropathology are reported in the supplementary materials.
Neuropsychological correlates of CSF biomarkers in FTD patients
In the overall cohort of FTD patients, CSF NfL levels showed a moderate, negative correlation with FAB results (Spearman’s rho = −0.434, p = 0.006, n = 38), and, to a lesser extent, with the BMDB score (Spearman’s rho = −0.264, p = 0.015, n = 84), while they did not correlate with the MMSE score. CSF t-tau values were slightly associated with performance at immediate visual memory test (Spearman’s rho = −0.228, p = 0.037, n = 84) but showed no correlations with other cognitive tests. P-tau, p-tau/t-tau, and Aβ42 values did not correlate with any neuropsychological test score. The results of the specific analysis for each clinical group are reported in the supplementary materials.
DISCUSSION
The present data add to previous studies supporting the role of CSF NfL as a surrogate biomarker of neurodegeneration and disease severity in patients with FTD. Moreover, they demonstrated a moderately good diagnostic value for NfL and p-tau/t-tau ratio in the discrimination between FTLD-TAU and FTLD-TDP.
Previous studies demonstrated an increase in CSF and blood NfL levels in FTD and AD, with significantly higher values in the former group [5, 41]. Accordingly, NfL proteins are increasingly recognized as a surrogate biomarker of neurodegeneration, reflecting both the degree of subcortical axonal pathology and the extent of grey matter degeneration [12, 43]. The prominent involvement of the frontal and temporal lobes that are rich in large caliber axons and the more severe subcortical pathology, extending to pyramidal tracts in patients with motoneuron-associated dysfunction, best explain the higher NfL levels detected in FTD in comparison to AD [7–9, 44]. In our cohort, ALS-FTD showed the highest NfL values among FTD groups, as previously described [11, 18], while no significant differences were seen among the other FTD subtypes, as also previously shown [7, 18].
By focusing the analysis on probable and definite FTLD cases with either TDP or TAU pathology (n = 78), we also showed that patients with FTLD-TDP have significantly higher levels of NfL and lower p-tau/t-tau values in comparison to those with FTLD-TAU. The results agree with previous studies showing either a trend or a significant difference in NfL levels [7, 17], but are at variance with a recent study reporting no differences in NfL levels between definite FTLD-TAU and FTLD-TDP groups once specific subtypes such as PSP and ALS-FTD are excluded [18].
Regarding t-tau and p-tau, previous studies variably found higher p-tau or p-tau/t-tau ratio or lower t-tau in probable and/or definite FTLD-TAU in comparison to FTLD-TDP or even no differences between the two groups [6, 46]. Most significantly, Irwin et al. demonstrated that CSF p-tau, but not t-tau, correlate with postmortem tau pathology in sporadic FTLD, supporting the hypothesis that t-tau non-specifically reflect the axonal damage and neuronal loss, whereas CSF p-tau predicts the severity of tau pathology [45].
At variance with some previous studies [11, 18], our data suggest that the different NfL and p-tau/t-tau values between FTLD-TAU and FTLD-TDP may not exclusively depend on the ALS-associated pathology. Indeed, our probable/definite FTLD-TDP cases with or without ALS showed similar NfL and p-tau/t-tau values, as previously shown in a few studies [14, 17]. Moreover, NfL and p-tau/t-tau values remained significantly different between the two cohorts after the exclusion of the cases with ALS.
Overall, our results indicate that NfL and p-tau/t-tau values may be useful to increase accuracy in the prediction of the primary neuropathological substrate (TAU versus TDP) in FTD patients. Accordingly, and in line with previous reports, NfL and p-tau/t-tau ratio showed a moderate accuracy (AUC 0.861±0.045 and AUC 0.814±0.050, respectively), sensitivity (80.0 and 74.4%, respectively), and specificity (81.0 and 71.4% respectively) in this differential diagnosis [6, 18]. Since it has been shown that AD co-pathology significantly influences CSF p-tau levels independently from the FTLD proteinopathy, the exclusion of patients with suspected AD-related co-pathology, based on AD core biomarker assessment, likely contributed positively to these results [45, 46].
Our results could be relevant to the clinical scenario of patients with dementia associated with parkinsonism, in which the finding of relatively low CSF NfL levels and high p-tau/t-tau ratio would suggest an underlying tauopathy. Furthermore, given the low correlation between clinical features and underlying neuropathology in patients with FTD, especially in those with bvFTD and PPA syndromes, the discovery of specific biological signatures may be useful for the future implementation of substrate-specific therapeutic strategies. However, the partial overlap in NfL and p-tau/t-tau ratio values between TAU and TDP cases and the possible occurrence of AD comorbidity, currently represent a significant limit to the application of this classification strategy at the individual level.
Regarding the accuracy in the distinction between FTD cases and controls, we demonstrated a higher value of NfL (AUC 0.862±0.027) in comparison to other AD classical biomarkers regarding both sensitivity and specificity (78.4% and 81.6%) [13, 19]. Moreover, at variance with Meeter et al. [18], we showed a poor diagnostic value for p-tau/t-tau levels in the discrimination between FTD cases and controls, a difference possibly related to partially divergent biomarker-based selection criteria for controls and the inclusion of definite cases with concomitant AD pathology in their study.
On another issue, our finding that NfL values negatively correlate with FAB and BMDB scores supports the idea that CSF (or blood) NfL levels may indeed reflect disease severity in FTD [5, 18]. Accordingly, we previously demonstrated that rapidly progressive FTLD cases are associated with higher NfL values in comparison with typical cases [16]. Finally, our results confirmed that NfL levels did not correlate with MMSE score [9, 15], due to the low specificity of this test in FTD.
Strengths of our study are the inclusion of virtually all subgroups of the FTD spectrum, the single center recruitment, the comprehensive approach to the study of patients, including genetic, neuroimaging, and CSF biomarker data in addition to clinical assessment and follow-up. On the other hand, the low proportion of autopsy-confirmed cases represents the main limitation of this study. Furthermore, the single-center setting of the study could have introduced a clinical bias in patient selection (e.g., a large proportion of FTD associated with motor disorders and a minor proportion of other FTD syndromes, such as PPA). Finally, the fact we did not consider patients’ survival could be considered an additional bias.
In conclusion, our data add to the value of CSF NfL as a surrogate biomarker of neurodegeneration and disease severity in patients with FTD spectrum. Moreover, they demonstrate a good diagnostic value for NfL and p-tau/t-tau ratio in the discrimination between FTLD-TAU and FTLD-TDP.