
Abstract
Alzheimer’s disease (AD) is a progressive neurodegenerative disorder characterized by behavioral changes and cognitive decline. Recent evidence suggests that it is the soluble forms of tau oligomers (Tau-O) and Aβ oligomers (oAβ) rather than the well-studied insoluble protein aggregates that possess the neurotoxicity, infectivity, and amplification underlying disease progression. Heme oxygenase 1 (HO-1), an inducible enzyme upregulated in the cortex and hippocampus of AD brains, was reported to damage neural structures and disrupt brain function, suggesting possible contributions to Tau-O-mediated neurodegeneration. In this study, we focused on the effects of HO-1 on Tau-O formation. In hippocampus of HO-1-overexpressing transgenic mice and neural 2a (N2a) cells, Tau-O was co-localized with HO-1 as visualized by immunofluorescence staining. Furthermore, primary cultured hippocampal neurons from HO-1 transgenic mice showed elevated Tau-O and concomitant reductions in spine density and length as well as dendritic length, diameter, and arborization. Blocking Tau-O formation by isoprenaline reversed these HO-1-induced morphological changes. These results indicated that HO-1 contributes to Tau-O formation and ensuing synaptic damage. Thus, HO-1 is a promising target for AD drug development.
INTRODUCTION
Alzheimer’s disease (AD) is the most common neurodegenerative disorder. Patients exhibit progressive and eventually profound memory loss and cognitive decline that is paralleled by accumulation of extracellular amyloid plaques composed of amyloid-β (Aβ) and intracellular neurofibrillary tangles containing hyperphosphorylated tau protein [1–3]. In addition to patient suffering, AD imposes a great burden on caretakers and the healthcare system.
The causes of sporadic AD as well as the factors determining the progression rate and other disease characteristics are largely unknown [4–6]. However, there is accumulating evidence that it is the soluble forms of oligomeric tau (Tau-O) and Aβ (oAβ), rather than the more widely studied insoluble protein inclusions, that possess the neurotoxicity, infectivity, and amplification driving disease progression [7, 8]. These soluble oligomers, whether derived from brain or artificial synthesis, are capable of binding specifically to synapses and inducing the death of neurons [9–11]. Tau-O is an aggregate of hyperphosphorylated tau, a microtubule-associated monomeric protein. These aggregates eventually assemble to form neurofibrillary tangles. Inoculation of Tau-O into the healthy mouse brain accelerates oligomer aggregation, suggesting that Tau-O is capable of self-propagation like prions [12–14].
AD is the most common cause of dementia in the elderly [15]. Studies have shown that the sizes of entorhinal cortex, hippocampus, basal forebrain, and amygdala, structures involved in memory, learning, and emotional behaviors, are reduced compared to the healthy brain [16] due in part to degeneration of synapses and ultimately of neurons [17]. Further, synaptic loss is a major pathogenic mechanism underlying cognitive impairment in AD patients [18].
Heme oxygenase 1 (HO-1), an inducible isoform of heme oxygenase, degrades heme into carbon monoxide, biliverdin, and ferrous iron [19, 20]. Since the identification of HO-l in 1968, many investigators have focused on the regulation and function of HO-l in mediating protection against cellular and tissue injury because HO-l is highly induced by oxidative stress [21, 22]. The wide distribution of this enzyme makes it an attractive candidate stress-response marker protein [23–25]. While expression of HO-1 is lower in the central nervous system than other tissues under normal physiological conditions, it is highly induced in the cortex and hippocampus of AD patients [26–28]. Moreover, HO-1 can promote tau aggregation in the mouse brain, and overexpression of HO-1 can induce neurotoxic oAβ and Aβ42 aggregates in the hippocampus [29–31]. However, the function of HO-1 in Tau-O formation remains unknown.
In this study, we show that Tau-O is co-localized with overexpressed HO-1 and that overexpression of HO-1 can induce Tau-O formation both in vivo and in vitro. Conversely, knockdown of HO-1 attenuates Tau-O formation induced by HO-1 overexpression. Overexpression of HO-1 reduced spine density and length, as well as dendritic branching and diameter, while blocking Tau-O formation under HO-1 overexpression using isoprenaline reversed these synaptic and dendritic abnormities.
MATERIALS AND METHODS
Animals
Animal experiments were conducted in accordance with the guideline for the Care and Use of Laboratory Animals published by the US National Institutes of Health. The HO-1 transgenic mice [Tg(HO-1) mice] were generated by the standard pronuclear injection technique using C57BL/6 mice as previously described [29]. Briefly, a transgenic construct expressing mouse HO-1 under the control of the chicken β-actin promoter was microinjected into fertilized ova. The Tg(HO-1) mice were identified by genotyping of mouse tail DNA using PCR with a forward primer from the chicken β-actin promoter (5’-GCCTTCTTCTTTTTCCTACAGCTC-3’) and a reverse primer from mouse HO-1 (5’-GGCATGCTGTCGGGCTGTGGAC-3’).
Cell lines and culture conditions
The creation of cell lines HM1 and HM4 was described in our previous study [29]. In brief, N2a cells were transfected with the pCMV6-AN-mRFP/HO-1 (HM4) or pCMV6-AN-mRFP (HM1) vector using Lipofectamine 2000 (Invitrogen, USA) according to the manufacturer’s instructions. After 48 h, cells were selected using 800μg/mL G-418 (Amreso, USA) to establish stably transfected cell lines. Clonal populations were obtained by plating the transfected cells at low density on 6-cm culture dishes and subsequently identified as stably transfected by western blotting. The cells were continually grown in Minimum Essential Eagle’s Medium (EMEM, Sigma-Aldrich, USA) supplemented with 10% fetal bovine serum (FBS), 100 U/mL penicillin G, 100μg/mL streptomycin (GIBCO, USA), and 400μg/mL G-418.
HEK293T cells were grown in Dulbecco’s Modified Eagle’s Medium (DMEM, GIBCO) supplemented with 10% FBS, 100 U/mL penicillin G, and 100μg/mL streptomycin (GIBCO). Mouse N2a cells were grown in EMEM (Sigma-Aldrich) with 10% FBS, 100 U/mL penicillin G, and 100μg/mL streptomycin (GIBCO). All cells were cultured at 37°C in a humidified incubator containing 5% CO2.
Primary neuron culture
For in vitro experiments on hippocampal neurons, cells were isolated from the hippocampus of neonatal Tg(HO-1) and wild-type (WT) mice following a previously described protocol [31]. In brief, hippocampi from neonatal mouse brains were isolated and digested in 0.25% trypsin for 20 min. Cells were collected by centrifugation at 200×g for 5 min. Isolated cells were cultured and maintained in Neurobasal™ medium (GIBCO) supplemented with B27 and L-glutamine (GIBCO).
Lentivirus packaging and infection
For lentivirus packaging, the expression vector, packaging plasmid (psPAX2), and envelope plasmid (pMD2.G) were packaged in HEK293T cells. Packaging efficiency was assessed by the ratio of green fluorescent cells to all cells (Supplementary Figure 1) and was 92% in this study. Culture medium containing package viruses was collected after 48 h and centrifuged (3,000 rpm, 15 min, 4°C) to remove debris. Supernatant were filtered through 0.45μm membranes and used for infection experiments.
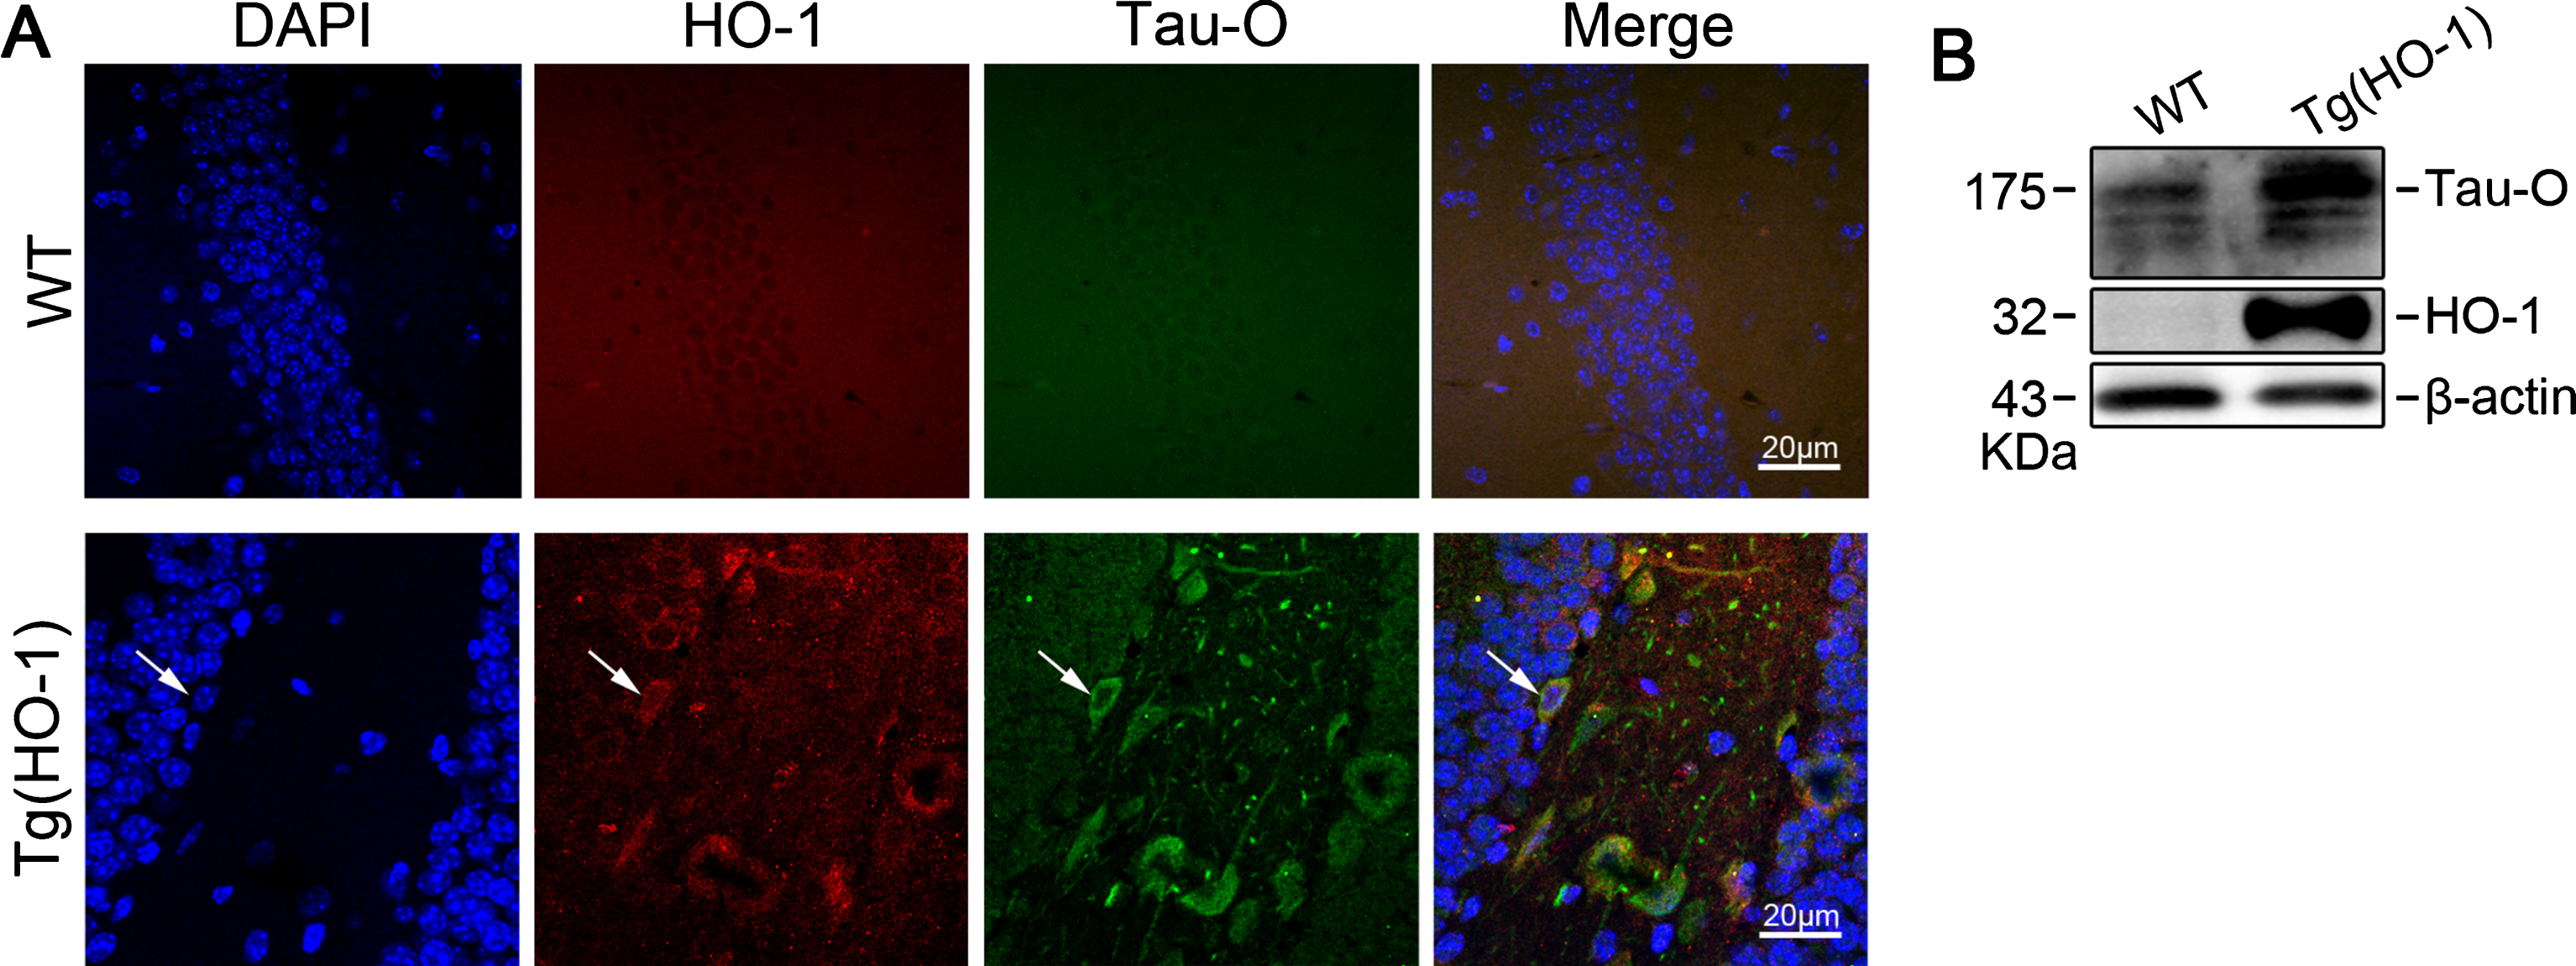
HO-1 is co-localized with Tau-oligomer (Tau-O) and induces Tau-O formation in Tg(HO-1) mice. A) Representative confocal microscope images showing the hippocampal CA3 region of WT and Tg(HO-1) mice stained for HO-1 (red) and Tau-O (green) and counterstained with DAPI (blue). The arrow shows the co-localization of HO-1 and Tau-O. B) Expression of HO-1 and Tau-O in the hippocampus of Tg(HO-1) mice and WT mice.
To infect primary hippocampal neurons, 80–100,000 were seeded on plastic 12-well plates precoated with poly-D-lysine (Sigma-Aldrich). After 12 h, cells were fed fresh medium, and 5–6 h later 2 mL of the virus medium was applied with 16μg/mL polybrene (Sigma-Aldrich) to increase infection efficiency. After overnight culture, the medium was changed to DMEM containing 10% FBS. Cells were cultured for 3 days before experiments.
To infect N2a cells, cells were cultured for 12 h in virus medium. The medium was then replaced with EMEM and the cells incubated for another 3 days in culture. The infection efficiency was about 90% according to the proportion of green fluorescent cells to all cells (Supplementary Figure 2).

HO-1 overexpression induces Tau-O formation in N2a cells. A) Increased HO-1 and Tau-O expression in N2a cells infected by Lv-ZsGreen-HO-1. HO-1 was co-localized with Tau-O. Representative images are shown. B) Average optical density of Lv-ZsGreen-HO-1-infected N2a cells compared to Lv-ZsGreen-infected N2a cells. *p < 0.05. n = 4 independent cultures per treatment group. C) HO-1 and Tau-O levels in Lv-ZsGreen-HO-1-infected N2a cells compared to Lv-ZsGreen-infected N2a cells. Representative images are shown. D) Densitometry of immunoblotting results. **p < 0.01. ***p < 0.001. n = 4 independent experiments.
Western blotting
Cells were lysed in ice-cold RIPA buffer with protease inhibitors (Roche Applied Science, Switzerland) for 30 min. The lysate was centrifuged (13,500 rpm, 15 min, 4°C) and the supernatant transferred to a new Eppendorf tube. Total soluble protein concentration was measured using a BCA protein assay kit (Applygen, Beijing, China). Soluble proteins in lysates were resolved by 12% sodium dodecyl sulfate polyacrylamide gel electrophoresis (SDS-PAGE) at 30μg protein per gel lane and transferred to nitrocellulose membranes. Membranes were blocked with 5% skim milk for 2 h at room temperature and then probed with primary antibodies (listed in Table 1) at 4°C overnight. After washing and incubating the membranes in secondary antibodies (ZS-biotechnology Company, China), and immunolabeling was visualized by the ECL reagent (HaiGene, China). Protein bands were scanned and then analyzed using ImageJ 1.61 software.
Antibodies used for immunoblotting and histological staining
Immunofluorescence
Primary hippocampal neurons (1×10⁵) were seeded on glass coverslips coated with poly-L-lysine (0.1 mg/mL, Sigma-Aldrich). After 14 days in vitro, cells were fixed with 4% paraformaldehyde (PFA, Sinoreagent, China) in phosphate buffered saline (PBS) for 20 min, permeabilized using 0.5% Triton X-100 (Biosharp, China) for 30 min, and then blocked using 5% bovine serum albumin (BSA, Boster, China) for 1 h. Primary antibody (Table 1) was applied overnight at 4°C in 1% BSA buffer. After washing with PBS, cells were incubated with FITC- and TRITC-conjugated secondary antibodies (ZS-biotechnology Company) for 1 h at room temperature. All cells were counterstained with DAPI for 5 min and mounted using ProLong™ Diamond Antifade Mountant (Invitrogen).
For in vivo immunofluorescence, mice were perfused transcardially with PBS solution and then 4% PFA in PBS (Sinoreagent). Mouse brains were post-fixed in PFA, paraffin embedded, and sectioned along the entire extent of the dentate gyrus using a microtome (SM2000, Leica, Germany). Sections were kept in sequential order for additional processing. For antigen retrieval, sections were first heated with citrate buffer under pressure for 10 min. Sections were then blocked with 5% BSA for 1 h, incubated overnight at 4°C with PBS plus Triton X (PBST) and primary antibodies (Table 1), washed in PBST, and incubated with secondary antibody (Table 1) for 1 h. After washing in PBST, the sections were counterstained with DAPI and mounted on glass slides. Fluorescence images were acquired using a Nikon C2 confocal microscope (Nikon, Japan).
Analysis of dendritic development
To characterize the changes in neuronal morphology under HO-1 overexpression and knockdown, primary hippocampal neurons from WT and HO-1 transgenic mice were cultured for 14 days on glass coverslips, fixed in 4% PFA for 20 min, permeabilized using 0.5% Triton X-100 (Biosharp, China) for 30 min, blocked using 5% BSA (Boster) for 1 h, and treated with Alexa Fluor 488 conjugated phalloidin (Cell Signaling, USA) for 30 min and the nuclear counterstain DAPI for 5 min. Coverslips were washed and mounted on glass slides. Stained neurons were photographed using a Nikon C2 si confocal microscope (Nikon) equipped with a 60×oil emersion objective. Phalloidin staining was imaged using 488 nm laser excitation at 60% power, while DAPI staining was imaged using 405 nm laser excitation at 30% power. All images were 1024×1024 z-stacks. Morphological changes were quantified manually from eight neurons in each treatment group using ImageJ. Spine density and length were analyzed at three randomly chosen points equidistant from the soma. Dendritic diameter and intersection number were measured at different distance from the soma. Total dendritic length was calculated as the sum of all individual dendritic lengths per neuron.
Statistical analyses
All statistical analyses were conducted using Statistical Program for Social Sciences (SPSS) 17.0 (SPSS, USA). Data are presented as mean±SEM unless otherwise stated. The means of two groups were compared by independent samples Student’s t-test and three or more group means by one- or two-way analysis of variance (ANOVA). Both dendritic length and intersection number were analyzed by two-way ANOVA followed by Bonferroni’s post hoc tests. Differences were considered significant at p < 0.05.
RESULTS
HO-1 and Tau-O co-localize in Tg(HO-1) mouse hippocampal neurons
To explore the effect of HO-1 overexpression on tauopathies in mice, we first conducted immunofluorescence staining of hippocampal slices from 12-month-old Tg(HO-1) and age-matched WT mice. Notably, Tau-O was co-localized with HO-1 in the Tg(HO-1) mouse hippocampus (Fig. 1A), and western blotting indicated that overexpression of HO-1 led to increased formation of Tau-O (Fig. 1B).
HO-1 overexpression induces Tau-O formation in N2a cells
To investigate the effects of neuron-specific HO-1 overexpression on Tau-O, N2a cells were infected with a HO-1-encoding lentivirus vector (Lv-ZsGreen-HO-1) and subjected to immunofluorescence staining to monitor the change of Tau-O formation. As expected, Lv-ZsGreen-HO-1-infected cells emitted stronger Tau-O immunofluorescence than control cells infected with empty vector (Lv-ZsGreen) (Fig. 2A, B). In addition, Tau-O was co-localized with HO-1 (Fig. 2A), consistent with results in HO-1-overexpressing transgenic mice. Western blotting confirmed that infection with the lentivirus carrying ZsGreen-HO-1 (Lv-ZsGreen-HO-1) successfully induced HO-1 overexpression in N2a cells (Fig. 2C, D). Also consistent with findings in transgenic mice, Tau-O expression was elevated in Lv-ZsGreen-HO-1-infected N2a cells compared to empty vector-infected controls (Fig. 2C, D). These findings confirmed that overexpression of HO-1 increased Tau-O formation and that this excess Tau-O co-localized with HO-1 in the absence of processes mediated by non-neuronal cells.
HO-1 overexpression induces Tau-O formation in primary cultured hippocampal neurons
We next examined the influence of HO-1 overexpression of Tau-O in primary cultured hippocampal neurons from neonatal Tg(HO-1) mice and WT littermates. Expression levels of HO-1 and Tau-O were detected by immunofluorescence staining after 14 days in culture. Consistent with results in transgenic mice and N2a cells, Tau-O expression exhibited greater co-localization with HO-1 in primary hippocampal neurons from Tg(HO-1) mice than primary neurons from WT mice (Fig. 3A, B).

HO-1 induces Tau-O formation in primary cultured hippocampal neurons. A) Representative confocal images showing primary cultured hippocampal neurons stained for Tau-O (red) and phalloidin (green), and counterstained with DAPI (blue). B) Average optical density showing HO-1 and Tau-O expression in primary culture hippocampus neurons. ***p < 0.001. n = 4.
shRNA-mediated HO-1 knockdown attenuates Tau-O formation in neurons
To provide further evidence that HO-1 induction (overexpression) can evoke Tau-O formation, we examined expression levels and co-localization in N2a-derived HM4 cells stably overexpressing HO-1 upon infected with empty virus or lentivirus encoding a targeted shRNA for HO-1 knockdown. Western blotting again revealed that Tau-O was markedly increased in HO-1-overexpressing HM4 cells compared to a control cell line (HM1). Infection of HM4 cells with a lentivirus vector carrying HO-1 shRNA (Lv-shHO-1), but not empty vector, almost completely reversed HO-1 overexpression to the basal level of HM1 cells, and Tau-O formation and co-localization were reduced in parallel. We next repeated these experiments in primary hippocampal neurons from neonatal Tg(HO-1) mice and WT littermates. Consistent with findings in HM4 cells, infection of primary neurons from Tg(HO-1) mice with Lv-shHO-1 attenuated HO-1 overexpression and concomitantly reduced Tau-O formation (Fig. 4C, D).
HO-1 impairs dendritic development in primary neurons

Knockdown of HO-1 reduces Tau-O formation in Neur2a cell. A) HO-1 and Tau-O protein production in N2a cells infected by Lv-pl or Lv-shHO-1. Representative immunoblots of HO-1 and Tau-O are shown. B) Densitometric analysis of immunoblotting data. *p < 0.05. n = 4 independent cultures. C) Representative confocal images showing primary cultured hippocampal neurons infected with Lv-pl or Lv-shHO-1 and stained for HO-1 (blue) and Tau-O (red). D) Average optical density showing HO-1 and Tau-O expression in primary cultured hippocampal neurons infected with Lv-pl or Lv-shHO-1. *p < 0.05, ***p < 0.001. n = 3 independent experiments.
To examine the downstream effects of HO-1-induced Tau-O formation on neuronal function, we first investigated the changes in synaptic and dendritic structure associated with HO-1 overexpression as shown in the schematic diagram (Fig. 5A). Primary hippocampal neurons were isolated from neonatal Tg(HO-1) mice and WT mice morphology examined by labeling the cytoskeleton with phalloidin (Fig. 5B, C). The spine density and spine length were significantly reduced on the dendrites of Tg(HO-1) neurons compared to WT neurons (Fig. 5D-F). In addition, dendritic length, diameter, and arborization were also decreased compared to WT neurons (Fig. 5G-J).

A) Schematic diagram showing the measurement of dendritic spine morphology and related features. B) Representative confocal images showing primary culture hippocampal neurons stained for HO-1 (red) and phalloidin (green). C) Morphology of WT and Tg(HO-1) mouse primary cultured hippocampus neurons as revealed by ImageJ software. D) Morphology of dendritic spines shown by phalloidin staining. Representative images are shown. E) Mean spine density of Tg(HO-1) and WT primary neurons. HO-1 overexpression decreases spine density in neurons from Tg(HO-1) mice **p < 0.01. n = 8. F) Measurement of spine length at 90μm and 180μm from the soma. HO-1 overexpression in Tg(HO-1) mice decreases the spine length ***p < 0.001. n = 8. G) Counting of dendritic intersections. HO-1 overexpression decreased the number of intersections at 120μm from the soma. **p < 0.01. n = 4. H) Measurement of dendritic length. HO-1 overexpression decreased dendritic length. **p < 0.01, n = 9. I) Morphology of dendrites as shown by phalloidin staining. Representative images are shown. J) HO-1 overexpression decreased dendritic diameter at 90μm and 180μm from the soma. ***p < 0. 001. n = 4.
Finally, we examined the dependence of these changes in morphology on Tau-O formation by treating HM4 cells and primary neuronal cells from Tg(HO-1) mice with 1μM of the known Tau-0 formation inhibitor, isoprenaline (ISO). Indeed, isoprenaline successfully decreased the level of Tau-O both in HM4 cells and primary neurons from Tg(HO-1) mice (Fig. 6A, B) and restored normal spine density, spine length, and dendritic morphology (Fig. 6B-E).

Suppression of Tau-O formation reversed the morphological changes caused by HO-1 overexpression. A) Isoprenaline (ISO) successfully suppressed Tau-O formation in HM4 cells as measured by western blotting. B) Primary neuronal cells from Tg(HO-1) mice were treated with 1μM isoprenaline or left untreated. Cells were fixed and stained with DAPI (blue), anti-Tau-O (red), and phalloidin (green). Representative images are shown. C) Morphology of dendritic spines showed by phalloidin staining. Representative images are shown. D) Isoprenaline treatment reversed the spine density reduction in primary neurons caused by HO-1 overexpression. E) Isoprenaline treatment reversed the dendritic length reduction in primary neurons caused by HO-1 overexpression.
DISCUSSION
Formation of Tau-O is implicated in the neurodegeneration and cognitive decline associated with AD [32–35]. In this study, we showed that HO-1 co-localized with Tau-O and induced Tau-O formation in vivo and in vitro. Furthermore, a HO-1 shRNA attenuated Tau-O formation. Overexpression of HO-1 reduced spine density and spine length as well as dendritic length, diameter, and arborization, and these effects were reversed by HO-1 knockdown and pharmacological inhibition of Tau-O formation. Collectively, these results suggested that induction of HO-1 in the AD brain contributed to neurodegeneration and functional impairment by promoting the formation of neurotoxic Tau-O.
In AD, HO-1 is upregulated in both neurons and astrocytes of the hippocampus and cerebral cortex relative to age-matched non-demented controls, and co-localizes with senile plaques, neurofibrillary tangles, and corpora amylacea [28, 36]. Schrag et al. suggested that microbleeding associated with cerebral amyloid angiopathy is a significant source of pathological iron in the AD brain [37], and HO-1 liberates iron from hemoglobin. Schipper et al. reported that HO-1 was significantly elevated in the temporal cortex and hippocampus of patients with AD and mild cognitive impairment compared to age-matched controls without cognitive impairment, suggesting that HO-1, a biomarker of oxidative stress, is elevated prior to the onset of overt dementia [27]. Our observations suggested that overexpression of HO-1 can induce Tau-O formation both in vivo and in vitro, and that overexpression of HO-1 can impair synaptic transmission, plasticity, and integration by decreasing spine density and length as well as the diameter, length, and morphological complexity of dendrites. Collectively these results supported a pathogenic process whereby upregulation of HO-1 increased free Fe, resulting in generation of cytotoxic free radicals, as well as the generation of Tau-O. The biochemical mechanisms underlying Tau-O formation around HO-1 remain to be elucidated.
Neurofibrillary tangles, one of the two cardinal pathological manifestations of AD, are generated from Tau-O [38, 39]. Several studies reported that direct application of Tau-O to WT hippocampal neurons resulted in decreased spine density and altered spine morphology, suggesting that Tau-O acts as a mediator of AD-related synaptic deficits [40–44]. Our results suggested that HO-1 was involved in tauopathy and in the pathogenesis of AD. The bouton-dendritic spine complex is the basic functional unit of glutamatergic transmission [45–48]. Transmission and plasticity are altered by changes in spine morphology [49, 50]. The number of spines on a particular dendrite is indicative of the number of excitatory synapses, and spines with larger heads are thought to have stronger synapses containing the molecular machinery important for robust synaptic transmission [51, 52]. An increase in dendritic spine density represents an increase in excitatory input to the postsynaptic neuron, which may increase the overall excitability of a neural circuit [53–56]. Dysgenesis of dendritic spines as well as local synaptic abnormalities and breakage of neuronal branches observed in neurons from Tg(HO-1) mice may underlying the memory loss and cognitive dysfunction observed in these mice. Dendritic spines have varied shapes and geometries, but are generally categorized as “mushroom,” “thin,” “filopodia-like,” “stubby,” and “branched” [57–60]. The morphology of dendritic spines is directly related to functional status. Thin filopodia-like spines are highly mobile and are hypothesized to aid in the initiation of synaptic contact (i.e., immature spines), while larger mushroom and stubby spines are higher-output and more stable [61–64], and are thought to be mature synapses strengthened and stabilized by use-dependent plasticity (i.e., “memory spines”) [65–69]. Interestingly, the immature spine forms, including thin filopodia-like spines, are rare in Tg(HO-1) mice compared to WTs, suggesting that HO-1 may induce excessive spine maturation, thereby disrupting proper circuit development or plasticity and leading to cognitive decline. Indeed, our previous study demonstrated memory loss and cognitive dysfunction in Tg(HO-1) mice and these current results provided a plausible explanation for these deficits.
Taken together, our study demonstrated that HO-1 induction/overexpression contributed to Tau-O formation and aggregation in the AD brain. Tau-O is the most toxic species in AD and can spread through a prion-like mechanism. Our findings thus highlighted HO-1 as a potential therapeutic target to reduce the Tau-O burden in AD.
DISCLOSURE STATEMENT
Authors’ disclosures available online (https://www.j-alz.com/manuscript-disclosures/18-0451r1).