
Abstract
To evaluate whether genetically increased serum uric acid levels influence the risk of Alzheimer’s disease (AD), we used genome-wide significant single nucleotide polymorphisms for uric acid as the instrumental variables, and undertook a Mendelian randomization (MR) study to estimate the effect of uric acid on the risk of AD. The MR method prevents bias due to reverse causation (e.g., uric acid changes because of AD) and minimizes bias due to confounding of both measured and unmeasured confounders. We used the summary statistics from The International Genomics of Alzheimer’s Project Consortium that is the largest AD genome-wide association study of 74,046 individuals of European ethnicity including 25,580 AD cases. We further performed sensitivity analyses to evaluate the assumptions of the MR method. The MR analyses did not support a causal role of genetically elevated serum uric acid on AD risk (odds ratio: 1.02, 95% confidence interval: 0.93–1.12, p = 0.65). Sensitivity analyses, including MR-Egger regression, suggested no strong evidence of bias due to pleiotropy. In conclusion, lifelong genetically increased serum uric acid levels have no protective effect on the risk of AD.
INTRODUCTION
Serum uric acid (SUA) is an endogenously produced water-soluble antioxidant, accounting for a large portion of the free radical scavenging capacity in the peripheral system by acting on superoxide and singlet oxygen [1, 2]. SUA is also capable to bind iron and to inhibit iron-dependent ascorbate oxidation [3], thus preventing the generation of free radicals which have an negative impact on Alzheimer’s disease (AD) pathogenesis [4]. The relevance of SUA has been hypothesized to protect against neurodegenerative diseases for quite a long time. Several large epidemiological studies reported a lower risk of incident AD or dementia in people with higher SUA levels [5, 6]. However, these observational studies had a major limitation that unmeasured variables, such as common genetic predisposition or environmental factors, may be the common causes of both SUA and AD; thus, this could confound the reported inverse association. Until now, no large-scale intervention studies have been conducted to evaluate the effects of SUA on dementia outcomes. In the absence of such evidence, it remains unknown whether SUA is a causal protective factor for AD. In this study, we assessed whether genetic determined SUA was associated with AD risk using a Mendelian randomization (MR) approach [7, 8] that utilizes genetic biomarkers to infer causal effect and is independent of unmeasured confounders and reverse causation (Fig. 1). Previously, the MR method was used to assess the causality of SUA on cardiovascular outcomes and other risk factors on AD [9–11].

Directed acyclic graph for Mendelian randomization framework.
MATERIALS AND METHODS
SNP selection
We selected 28 single-nucleotide polymorphisms (SNPs), which are not in the linkage disequilibrium, as instrumental variables (Fig. 2) for the MR analyses. These SNPs were identified to be of genome-wide significance from a genome-wide association study (GWAS) of SUA with more than 140,000 participants of European ancestry within the Global Urate Genetics Consortium [12]. These variants were used in a previous MR study [9]. Of the 28 SUA-related SNPs, 14 variants had potential pleiotropic associations at a p-value <0.01 level with at least one vascular or nonvascular trait [9]. The other 14 SNPs (SNP names in bold font in Fig. 2) were reported to be specific to SUA. Thus, these SNPs were utilized in two approaches: one liberal approach using all 28 SNPs and one conservative approach using only 14 SUA specific SNPs as instrumental variables.

Effects of SUA-increasing alleles on AD risk in IGAP.
AD data source
For the study participants, we used the summary statistics from The International Genomics of Alzheimer’s Project (IGAP) Consortium that is the largest AD GWAS of 74,046 individuals of European ethnicity including 25,580 AD cases [13]. The AD cases were ascertained according to clinical diagnosis, autopsy, Diagnostic and Statistical Manual of Mental Disorders (DSM)-IV, or Clinical Dementia Rating criteria. Corresponding effect estimates of the SUA-associated SNPs on the risk of AD were obtained from the IGAP website where the summary AD GWAS statistics were deposited [14]. We assume the odds ratio of AD per standard deviation increase of SUA was 1.12 and variance explained by the SNPs was 6%, and estimate the power of the IGAP data for the present MR analysis to be 87% (http://cnsgenomics.com/shiny/mRnd/).
Statistical analysis
Mendelian randomization
In observational epidemiological studies, MR is a kind of instrumental variable approach that uses genetic variants of known functions to examine the causal effect of a modifiable risk factor (e.g., SUA) on the risk of an outcome (e.g., AD). It adopts the idea that if a risk factor is a causal factor for a disease, then the genetic variants that determine the risk factor should also be associated with the outcome. The MR approach has three essential assumptions: 1) the genetic variants serving as instrumental variables are significantly associated with the exposure; 2) the genetic variants are not associated with any confounders between the exposure and the outcome; 3) the effects of the genetic variants on the outcome are totally through the exposure. Based on these three assumptions, various statistical methods have been developed to estimate the causal effect of an exposure on the outcome.
We carried out four different estimating methods (inverse variance weighting method [7], weighted median method [15], MR-Egger regression, and robust MR-Egger regression method [16]) for the MR analyses). All of them were applied to the summary statistics of these SNPs on SUA and AD. Because the MR analyses assume that the SNPs influence the outcome (AD) solely through the exposure of interest (SUA), the MR-Egger regression is performed to assess the potential pleiotropy of these selected SNPs [16]. This approach is based on Egger regression, which has been used to examine publication bias in the meta-analysis literature [17]. In brief, the SNP’s effects upon the exposure variable are plotted against their effects upon the outcome, where an intercept distinct from the origin provides evidence for pleiotropic effects. All statistical analyses were performed using R 3.3 software [18] with rmeta [19], gtx [20], and MendelianRandomization [21] packages. See Supplementary Material for more details.
Inverse-variance weighted estimator
The causal estimate from the inverse-variance weighted (IVW) method (βIVW) is calculated by the following equation:
The standard error is estimated by:
Weighted media estimator
The weighted median estimator is a modification of the simple median approach and in comparison to an approach that takes account of the variance of the individual genetic instruments. Specifically, the weighted median estimator is the median of a distribution having estimate βj as its Pj = 100 (Sj - Wj/2)th percentile, where P is the percentile for the jth ordered ratio estimate, wj is the weight given to the jth ordered ratio estimate, proportional to the inverse of the IV variance, and Sj is the sum of weights up to and including the weight of the jth ordered ratio estimates, calculated using the following equation
MR-Egger regression
MR Egger uses a weighted linear regression of the gene–outcome coefficients θ j on the gene–exposure coefficients δj: θj = β0E + βE * δj, in which all the δ
j
associations are orientated to be positive, and the weights in the regression are the inverse-variances of the gene–outcome associations (σ
Y
j
-2). If the intercept in the regression model of MR-Egger is truly zero (or were constrained to be zero), the MR-Egger slope estimate
RESULTS
The F-statistic using 28 SNPs as the instrumental variable is 2519, which is suggestive of a strong instrument [22]. Figure 2 shows the effects of SUA-increasing allele on AD risk. None of these SNPs were nominally significantly associated with AD. As shown in Table 1, MR estimates from random effects inverse variance weighting method, weighted median, and MR-Egger regression do not support a protective causal role of SUA on AD risk, while the robust MR-Egger analysis suggests increasing SUA may be a causal risk factor for AD. These results were consistent for both the liberal approach using 28 SNPs and conservative approach using 14 SUA specific SNPs as instrumental variables. These MR estimates were also plotted in Figs. 3 and 4. MR-Egger regression analyses suggested that pleiotropy did not greatly influence the results of the MR analyses (Egger intercept, p = 0.22 for the 14-SNPs conservative approach).
The Mendelian randomization analyses of serum uric acid with Alzheimer’s disease using different estimation approach
IVW, inverse variance weighting; MR, Mendelian randomization; OR, odds ratio; CI, confidence interval.

Mendelian randomization analyses of serum uric acid and AD risk using the liberal approach with 28 SNPs as the instrumental variable. The slope means the MR estimates of SUA on AD risk.
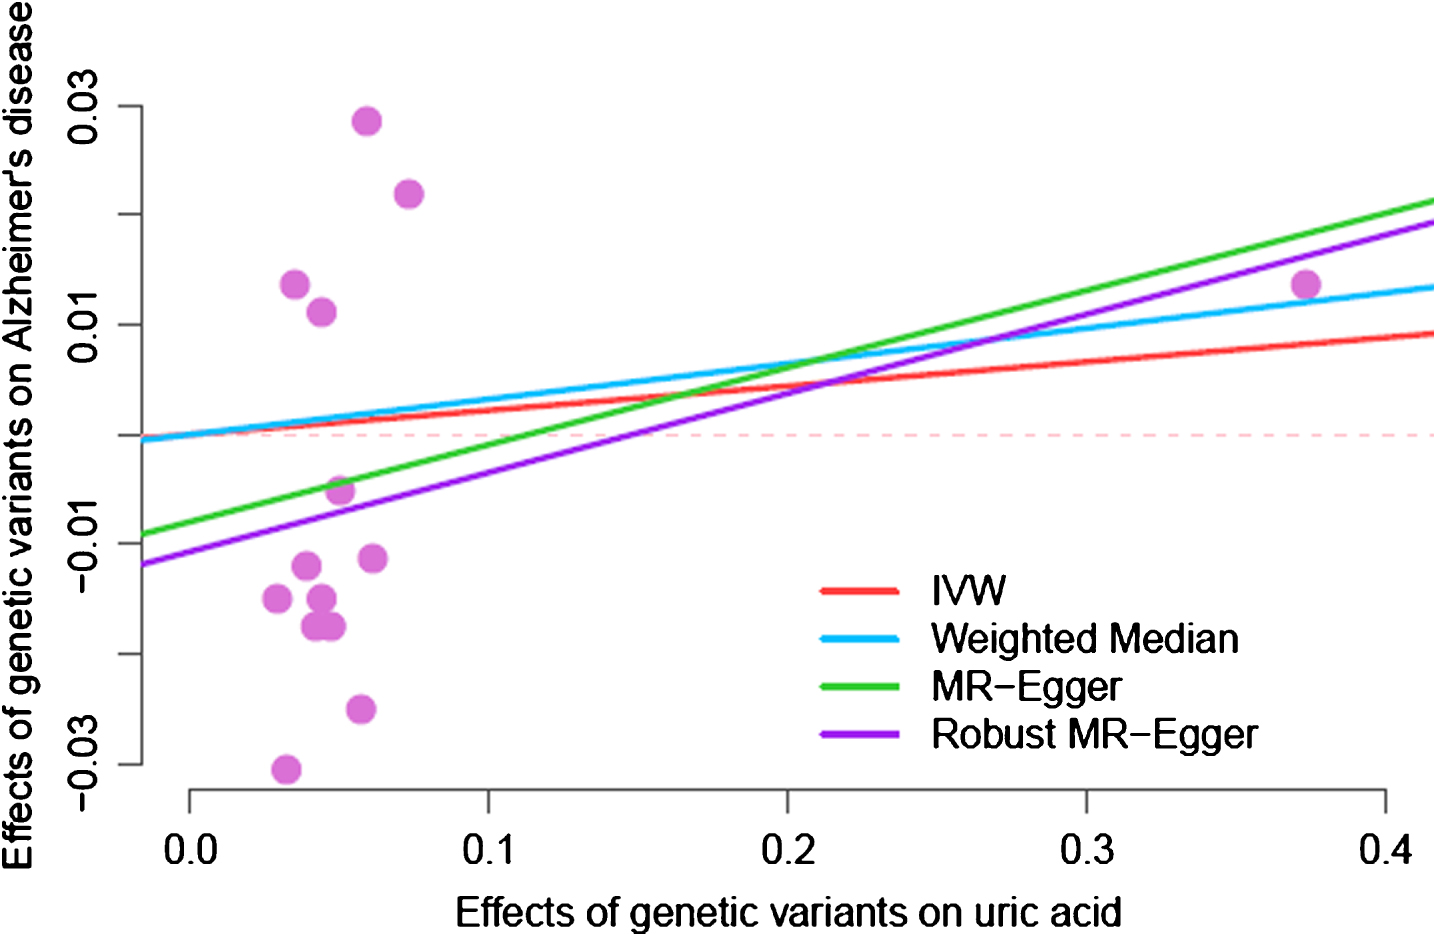
Mendelian randomization analyses of serum uric acid and AD risk using the conservative approach using 14 SUA specific SNPs as the instrumental variable. The slope means the MR estimates of SUA on AD risk.
DISCUSSION
In this study, we performed the first MR analysis to examine the causal effect of SUA on AD risk and found that the MR analyses did not support a causal protective role of lifelong genetic increase in SUA for AD risk. While the MR analysis is able to disentangle the causal effect from unmeasured confounders or reverse causation, it also requires large sample size that can be achieved by utilizing IGAP Consortium involving 74,046 participants [13]. We also tested the pleiotropic assumption and did not find any evidence for violations of these assumptions (MR-Egger intercept test).
Observational studies aiming to investigate the relevance of SUA levels in AD have yielded inconsistent results [23, 24]. Epidemiological studies like these observational examinations are susceptible to residual confounding as well as other factors those may bias the observed estimates. While the potential confounding effects of obesity, age, and sex have been accounted for in most of these studies [6], there are several other related physiological factors not being controlled for. For example, difference in inflammation or diet could be the common causes for both SUA and AD [25–28], but they are seldom analyzed in evaluating the association of SUA and AD risk. Other important confounders could be genetic predisposition. Indeed, family background has been found to be associated with both SUA and AD risk [29–31]. One way to address familial confounding of both shared genetics and environmental factors is to use twin or family design to control these factors. However, no study has been published until now using this design. An alternative approach to control for unmeasured confounding is MR design, which uses SNPs as instrumental variables to examine if SUA and AD are associated independent of these confounding factors.
Our study assessed the association between lifelong genetically increased SUA levels and the risk of development of AD, the findings reported here suggested that increasing SUA was not an ideal modifiable treatment target for AD as shown in the MR analyses using either 14 or 28 SNPs as the instrumental variables. Moreover, one SNP (rs12498742) located in SLC2A9 that explains a larger proportion of variance for SUA levels [12] showed no significant association with AD (OR: 1.01, 95% CI: 0.98–1.05, p = 0.45). This SUA-specific SNP analysis further showed the higher SUA levels may not be of protective role for AD risk.
This study has several limitations. Concerns should be noted regarding the no-pleiotropic assumption of the MR approach. In our study, we used both the liberal approach using 28 SNPs and conservative approach using 14 SUA-specific SNPs, and obtained similar results. Importantly, we also performed analyses for one single variant, rs12498742, which shows the strongest effect on uric acid levels and did not find a protective role of this variant on AD. In addition to that, our study only used summary statistics and no individual level data were available, hence providing us no chance to test the association of these variants with other potential confounders. However, a previous study extensively examined these 28 SNPs with 50 vascular and nonvascular traits and did not find significant association [9]. The GWAS summary statistics from IGAP were generated by using the additive genetic model, which may underestimate the effects of certain SNPs if the underlying model is dominant. When the individual level data are available, a dominant genetic model could be employed to increase statistical power. Recent research showed that MR estimates could be biased due to assortative mating [32]. Genetic data from mother-father-offspring trios can be used to detect and correct this bias [32]. However, these data are unavailable for the GWAS data in IGAP.
In summary, our finding implies that previous results from observational epidemiological studies may be due to unmeasured confounders or reverse causation. Our analyses suggested that increasing SUA levels may not translate to risk reduction for AD in individuals of European ancestry.