
Abstract
Background:
Late-onset Alzheimer’s disease (LOAD) represents a growing health burden. Previous studies suggest that blood metabolite levels influence risk of LOAD.
Objective:
We used a genetics-based study design which may overcome limitations of other epidemiological studies to assess the influence of metabolite levels on LOAD risk.
Methods:
We applied Mendelian randomization (MR) to evaluate bi-directional causal effects using summary statistics from the largest genome-wide association studies (GWAS) of 249 blood metabolites (n = 115,082) and GWAS of LOAD (ncase = 21,982, ncontrol = 41,944).
Results:
MR analysis of metabolites as exposures revealed a negative association of genetically-predicted glutamine levels with LOAD (Odds Ratio (OR) = 0.83, 95% CI = 0.73, 0.92) that was consistent in multiple sensitivity analyses. We also identified a positive association of genetically-predicted free cholesterol levels in small LDL (OR = 1.79, 95% CI = 1.36, 2.22) on LOAD. Using genetically-predicted LOAD as the exposure, we identified associations with phospholipids to total lipids ratio in large LDL (OR = 0.96, 95% CI = 0.94, 0.98), but not with glutamine, suggesting that the relationship between glutamine and LOAD is unidirectional.
Conclusions:
Our findings support previous evidence that higher circulating levels of glutamine may be a target for protection against LOAD.
INTRODUCTION
Late onset Alzheimer’s disease (LOAD), a devastating age-related neurodegenerative disorder and the leading cause of dementia [1], remains an urgent public health crisis. Today, the global prevalence of LOAD is 24 million and is expected to double by 2040, increasing the burden of disease on patients, families, and health-care systems [2]. Recent studies suggest that altered levels of circulating biomarkers in the blood, such as high-density lipoprotein cholesterol and glucose, may reduce the risk of LOAD [3]. With limited effective prevention or treatments for LOAD available [1, 4], further investigation of the causal effect of blood metabolites on LOAD may yield insights for advancing prevention strategies, and informing public health interventions.
Blood metabolites (molecules <1,500 atomic mass units) are the end-products of biological processes. Due to their ability to cross the blood-brain-barrier, and their potential modification through diet and lifestyle interventions, metabolites may represent a promising target for prevention or treatment. Previous epidemiological studies suggest associations between metabolite levels such as lipids and branched chain amino acids with the incidence of LOAD [5–8]. However, these types of observational studies are susceptible to biases such as confounding and reverse causation, making it difficult to establish causal relationships.
Mendelian randomization (MR) offers an alternative study design that uses single nucleotide polymorphisms (SNPs) in the DNA sequence as instrumental variables to assess causal inferences between an exposure and an outcome of interest [9]. Similar to randomized control trials, MR studies leverage the random allocation of alleles at gametogenesis to assess causal effects. MR designs may therefore reduce susceptibility to reverse causation and confounding which would otherwise impede interpretation of traditional study designs. Recent MR studies have explored the associations between blood metabolites and LOAD, suggesting that glutamine protects against LOAD [10, 11]. Additional evidence from Lord et al. identified free cholesterol in extra-large high density lipoproteins as a protective factor against LOAD [11]. Previous MR studies have been based on GWAS of metabolites from a relatively small sample (n = 24,925).
In this study, we performed MR of metabolite concentration with LOAD using much larger GWAS data on 249 blood metabolites (n = 115,082). We aimed to identify causal relationships between metabolite concentrations and LOAD in the context of previous evidence, and further evaluate additional metabolomic exposures not included in previous analyses. We further examined bi-directional effects to assess the mutual exclusivity of causal relationships. A greater understanding of the etiology of LOAD may result in novel preventative and treatment strategies.
METHODS
Study design
We conducted bi-directional MR analyses of metabolites and LOAD. GWAS summary statistics were derived from non-overlapping samples to facilitate a two-sample MR study, which is less prone to weak instrument bias compared to one-sample MR [12]. We utilized the largest and most recent GWAS of metabolomic data from the UK Biobank (UKB) [13]. Briefly, the UKB is an ongoing prospective cohort study including 502,639 participants aged 37–70 in the United Kingdom. A random subset of participants were measured using targeted high-throughput NMR metabolomics on non-fasting baseline plasma samples (Nightingale Health Ltd; biomarker quantification version 2020). Metabolomic measures were quantified through 249 biomarkers, including lipids, amino acids, ketone bodies and glycolysis metabolites, on sample sizes between n = 110,051 and n = 115,082, after quality control procedures. Each metabolite was inverse-normalized to have a mean 0 and standard deviation of 1. GWAS summary statistics were adjusted for age, sex, fasting time, and genotyping chip, as previously described [14, 15]. Summary statistics from these GWAS were obtained from the OpenGWAS platform (https://gwas.mrcieu.ac.uk/). Ethical approval of the UKB was provided by the Northwest Multicentre Research Ethics Committee, the National Information Governance Board for Health & Social Care, and the Community Health Index Advisory Group. No selection criteria were applied to sampling the entire UKB population. Details of the design of the UKB have been previously reported [16].
The GWAS for LOAD was taken from the recent meta-analysis by Kunkle et al. [17]. This study consisted of three stages, including a discovery phase (N = 63,926), a replication phase (N = 18,845), and a post-replication phase (N = 11,666). We conducted parallel analyses using the previously released GWAS meta-analysis of LOAD from Lambert et al. [18]. This study consisted of two stages, including a discovery phase (N = 55,134), and a replication phase (N = 19,884). It is important to note that the Lambert et al. and Kunkle et al. samples are not completely independent, as the sample used in Lambert et al. is a subset of the sample used in Kunkle et al. Both of these GWAS meta-analyses arose from the International Genomics of Alzheimer’s Project, which includes four large consortia: Alzheimer’s Disease Genetic Consortium (ADGC), the Cohorts for Heart and Aging Research in Genomic Epidemiology (CHARGE), the European Alzheimer’s Disease Initiative (EADI), and the Genetics and Environmental Alzheimer’s Disease Initiative (GERAD). Participants are non-Hispanic Whites, and cases are defined based on having a clinical diagnosis while controls are cognitively healthy, as previously described [18]. We utilized the stage one summary data from both studies for MR analyses. A flow diagram summarizing the methodology is detailed in Fig. 1. Although there have been more recent larger GWAS meta-analyses of LOAD, we have opted not to use these in our primary analyses, because of the biases and reduced SNP heritability that have been demonstrated [19–21], which likely resulted from the use of proxy-cases, the inclusion of a very large number of young controls, among other potential factors. While recognizing these limitations, we performed an additional MR analysis of our main finding, glutamine, with the Alzheimer’s disease and related dementias outcome from the more recent and larger Bellenguez et al. [22] GWAS meta-analysis, consisting of 85,934 cases and 401,577 controls.
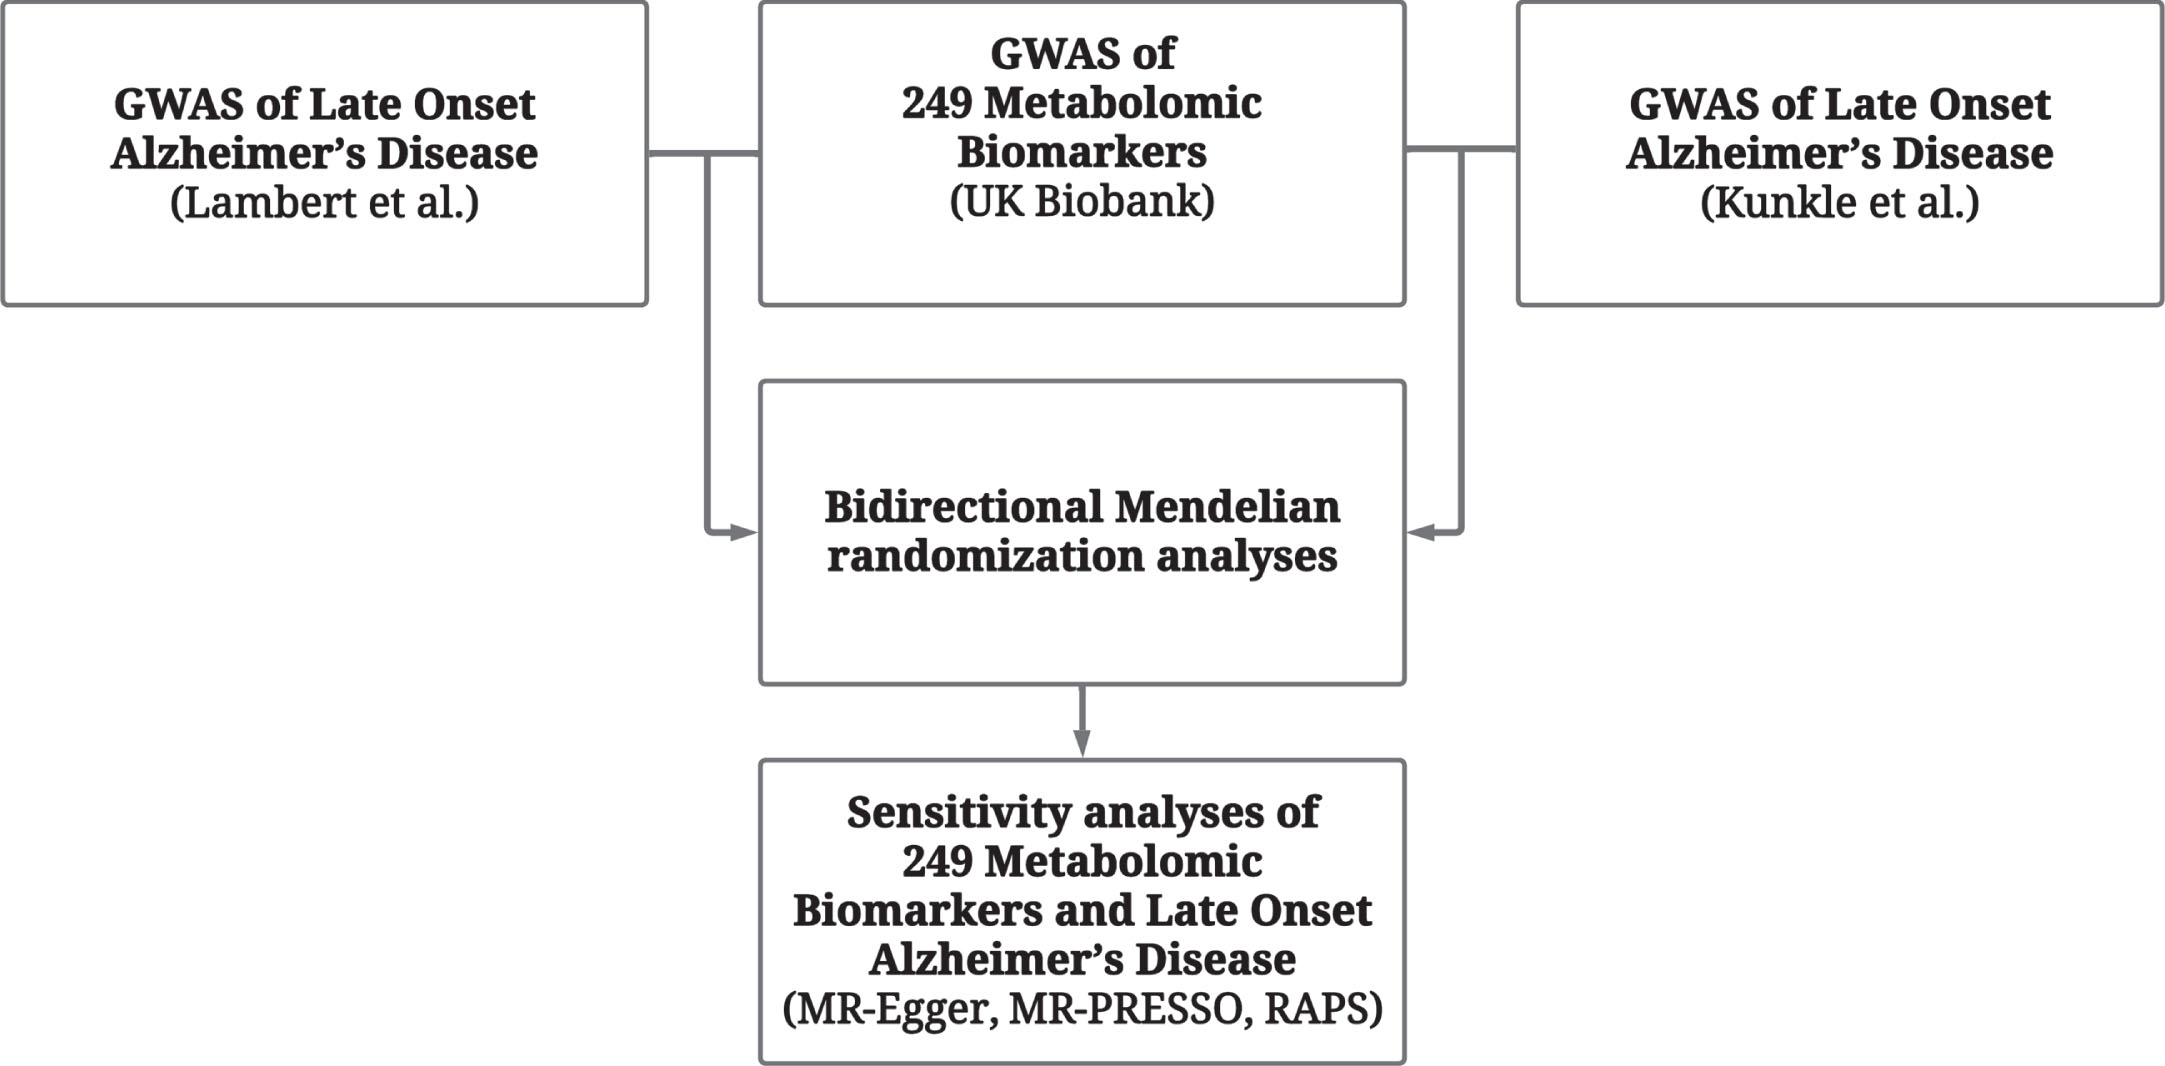
Study Design. Flowchart describing sequence of analytical steps.
Instrument selection
SNPs were selected at the genome-wide significance threshold (p<5.0×10⁻⁸). SNPs in linkage disequilibrium were clumped to account for correlated genetic variants (clumping window of 10,000 kb, r2 < 0.001), and the SNP with the lowest p-value was retained in a given genomic region. Proxies for genetic variants missing in outcome GWAS were identified using the 1,000 Genomes European sample data. Alleles were harmonized to ensure that the same allele was being referenced for exposure and outcome effect sizes. We attempted to infer the positive strand allele using allele frequencies for palindromic SNPs. We did not manually “prune” for genetic variants with suspected associations with outcome phenotypes as it risks the removal of only variants with a directional effect [9].
Analyses
MR associations were first estimated using the inverse variance weighted (IVW) linear regression. Post hoc sensitivity analyses included the MR-Egger, weighted median, weighted mode, MR Robust Adjusted Profile Score (RAPS), and MR Pleiotropy Residual Sum and Outlier (MR-PRESSO) methods. Briefly, MR-Egger regression assumes linearity and homogeneity in the associations between the genetic variants, risk factor, and outcome. No assumption is made about the validity of the genetic variants. Egger regression provides an estimate of the causal effect that is consistent asymptotically even if all the genetic variants have pleiotropic effects on the outcome [23]. The weighted median and weighted mode derive causal estimates by assigning greater weight for variants with more precise ratio estimates. However, both mode- and median-based estimates are more vulnerable to horizontal pleiotropy [24]. MR-RAPS uses a profile-likelihood function to estimate the variance of the pleiotropic effect distribution, down-weighting outliers in causal estimation [25]. MR-PRESSO down-weights outliers by comparing the residual sum of squares against the expected distance under the null hypothesis of no pleiotropic effect [26]. Beta coefficients were reported as Odds Ratios (OR).
We initially applied a significance threshold of p < 0.05 for bi-directional IVW estimates. To account for multiple testing, we subsequently applied an adjusted significance threshold of p < 2.0×10⁻⁴, based on a conservative Bonferroni correction for the number of metabolites tested (n = 249). At this type-1 error rate, we estimate [27] that we have 80% power to detect an OR as small as 1.2 with a sample size of 55,000, a case proportion of 30%, and a genetic instrument explaining 5% of the variance in metabolite level. The validity of MR estimates are dependent on three core assumptions: 1) the relevance assumption, meaning selected variants must be directly associated with the exposure; 2) the independence assumption that unmeasured confounders are not associated with the outcome; 3) and the exclusion restriction assumption that genetic variants are not pleiotropically associated with the exposure.
We performed additional sensitivity analyses to evaluate the MR assumptions for estimates meeting the adjusted threshold. Instrument strength was calculated using the F-statistic, with instruments exhibiting an F > 10 considered sufficient to meet the first assumption. Next, heterogeneity was calculated using Cochran’s Q to assess pleiotropic effects. We performed a visual assessment of IVW regression results, funnel plots and leave-one-out (LOO) analyses to investigate the influence of outlier SNPs on causal estimates. We applied the I2GX statistic to evaluate the reliability of the Egger regression results. We performed an additional Steiger filtering sensitivity analysis to remove genetic variants explaining greater variance of the exposure trait than of the outcome. Given its large effect on LOAD as well as effects on circulating lipid levels, we additionally conducted a separate analysis to evaluate the influence of the APOE ɛ4 allele by removing IVs within 500 kb of the rs429358 variant. Briefly, the rs429358 variant has been observed at lower frequencies among older participants in the UK Biobank, suggesting a potential selection bias for older participants with the risk allele to have longer, healthier lives [28]. All data extraction, processing and analyses were performed using the “TwoSampleMR” package in R version 3.6.3 (R Foundation for Statistical Computing) [29, 30].
RESULTS
Metabolomic exposures
We identified 25 nominally significant (p < 0.05) MR IVW associations between blood metabolite exposures and LOAD as an outcome (Supplementary Table 1). Using the Kunkle et al. GWAS, both glutamine (OR = 0.83, 95% CI = 0.73, 0.92) and phospholipids to total lipids ratio in chylomicrons and extremely large VLDL (XXL.VLDL.PL.pct) (OR = 0.74, 95% CI = 0.50, 0.99) exhibited a protective effect on LOAD, while isoleucine (OR = 1.53,95% CI = 1.27, 1.79) and free cholesterol levels in LDL particles (LDL.FC) (OR = 1.69, 95% CI = 1.02, 2.83) were suggested to increase risk of LOAD. Phospholipids to total lipids ratio in very large HDL (XL.HDL.PL.pct) (OR = 0.89, 95% CI = 0.80, 0.98) and phospholipids to total lipids ratio in small HDL (S.HDL.PL.pct) (OR = 0.54, 95% CI = 0.04, 1.04) were additionally identified as potential protective markers against LOAD. We identified increased risk from glucose (OR = 1.29, 95% CI = 1.10, 1.47) and phospholipid concentration measures, including phospholipids in LDL (LDL.PL) (OR = 1.69, 95% CI = 1.21, 2.18), phospholipids in large LDL (L.LDL.PL) (OR = 1.71, 95% CI = 1.20, 2.22), and phospholipids in medium LDL (M.LDL.PL) (OR = 1.68, 95% CI = 1.20, 2.20). A complete list of identified associations is provided in Fig. 2.

Bi-directional Inverse Variance Weighted Mendelian Randomization Estimates for metabolites with at least one nominally significant association.
Using the LOAD summary statistics from the Lambert et al. GWAS, we identified 9 of the nominally significant associations in Kunkle et al. analyses, including protective effects from glutamine (OR = 0.82, 95% CI = 0.70, 0.94) and XXL.VLDL.PL.pct (OR = 0.81, 95% CI = 0.62, 0.99). Metabolomic exposures increasing risk of LOAD included isoleucine (OR = 1.44, 95% CI = 1.14, 1.74), and free cholesterol levels in large LDL (L.LDL.FC) (OR = 1.08, 95% CI = 1.02, 1.14), medium LDL (M.LDL.FC) (OR = 1.08, 95% CI = 1.02, 1.14), and small LDL (S.LDL.FC) (OR = 1.09, 95% CI = 1.02, 1.16). We further identified cholesteryl esters to total lipids ratio in large LDL (L.LDL.CE.pct) as a risk factor for LOAD (OR = 1.05, 95% CI = 1.02, 1.08), which was not identified in the parallel analysis using the Kunkle et al. GWAS.
After applying our corrected significance threshold, only glutamine was found to be a significant protective exposure using the Kunkle et al. GWAS. For glutamine as an exposure, we identified 32 genome-wide significant instruments (p < 5×10⁻⁸) after clumping in the Kunkle et al GWAS (Supplementary Table 2). Sensitivity analyses including median, mode, MR-RAPS, and MR-PRESSO estimates yielded protective effects consistent with the IVW estimate (Fig. 3). F-statistics suggested that all instruments were sufficiently associated with glutamine concentration (F > 10, Supplementary Table 3). Cochran’s Q (Supplementary Table 4), and the I2GX statistic (Supplementary Table 5) did not suggest statistically significant heterogeneity. MR-PRESSO analysis did not identify outlier variants (Supplementary Table 6). We did not identify directional changes for any associations after Steiger filtering (Supplementary Table 7). Inspection of forest plots and LOO analyses did not reveal heterogeneity or influential SNPs driving associations (Supplementary Figures 1 and 2). Additional sensitivity analyses for glutamine instruments did not identify SNPs within 500 kb of the APOE gene. MR analyses of glutamine exposure using the Bellenguez et al. GWAS summary statistics for Alzheimer’s disease and related dementias as our outcome, revealed slightly attenuated magnitudes of association as those obtained with LOAD GWAS outcomes (IVW OR = 0.90, 95% CI = 0.84, 0.95; see Supplementary Table 8).
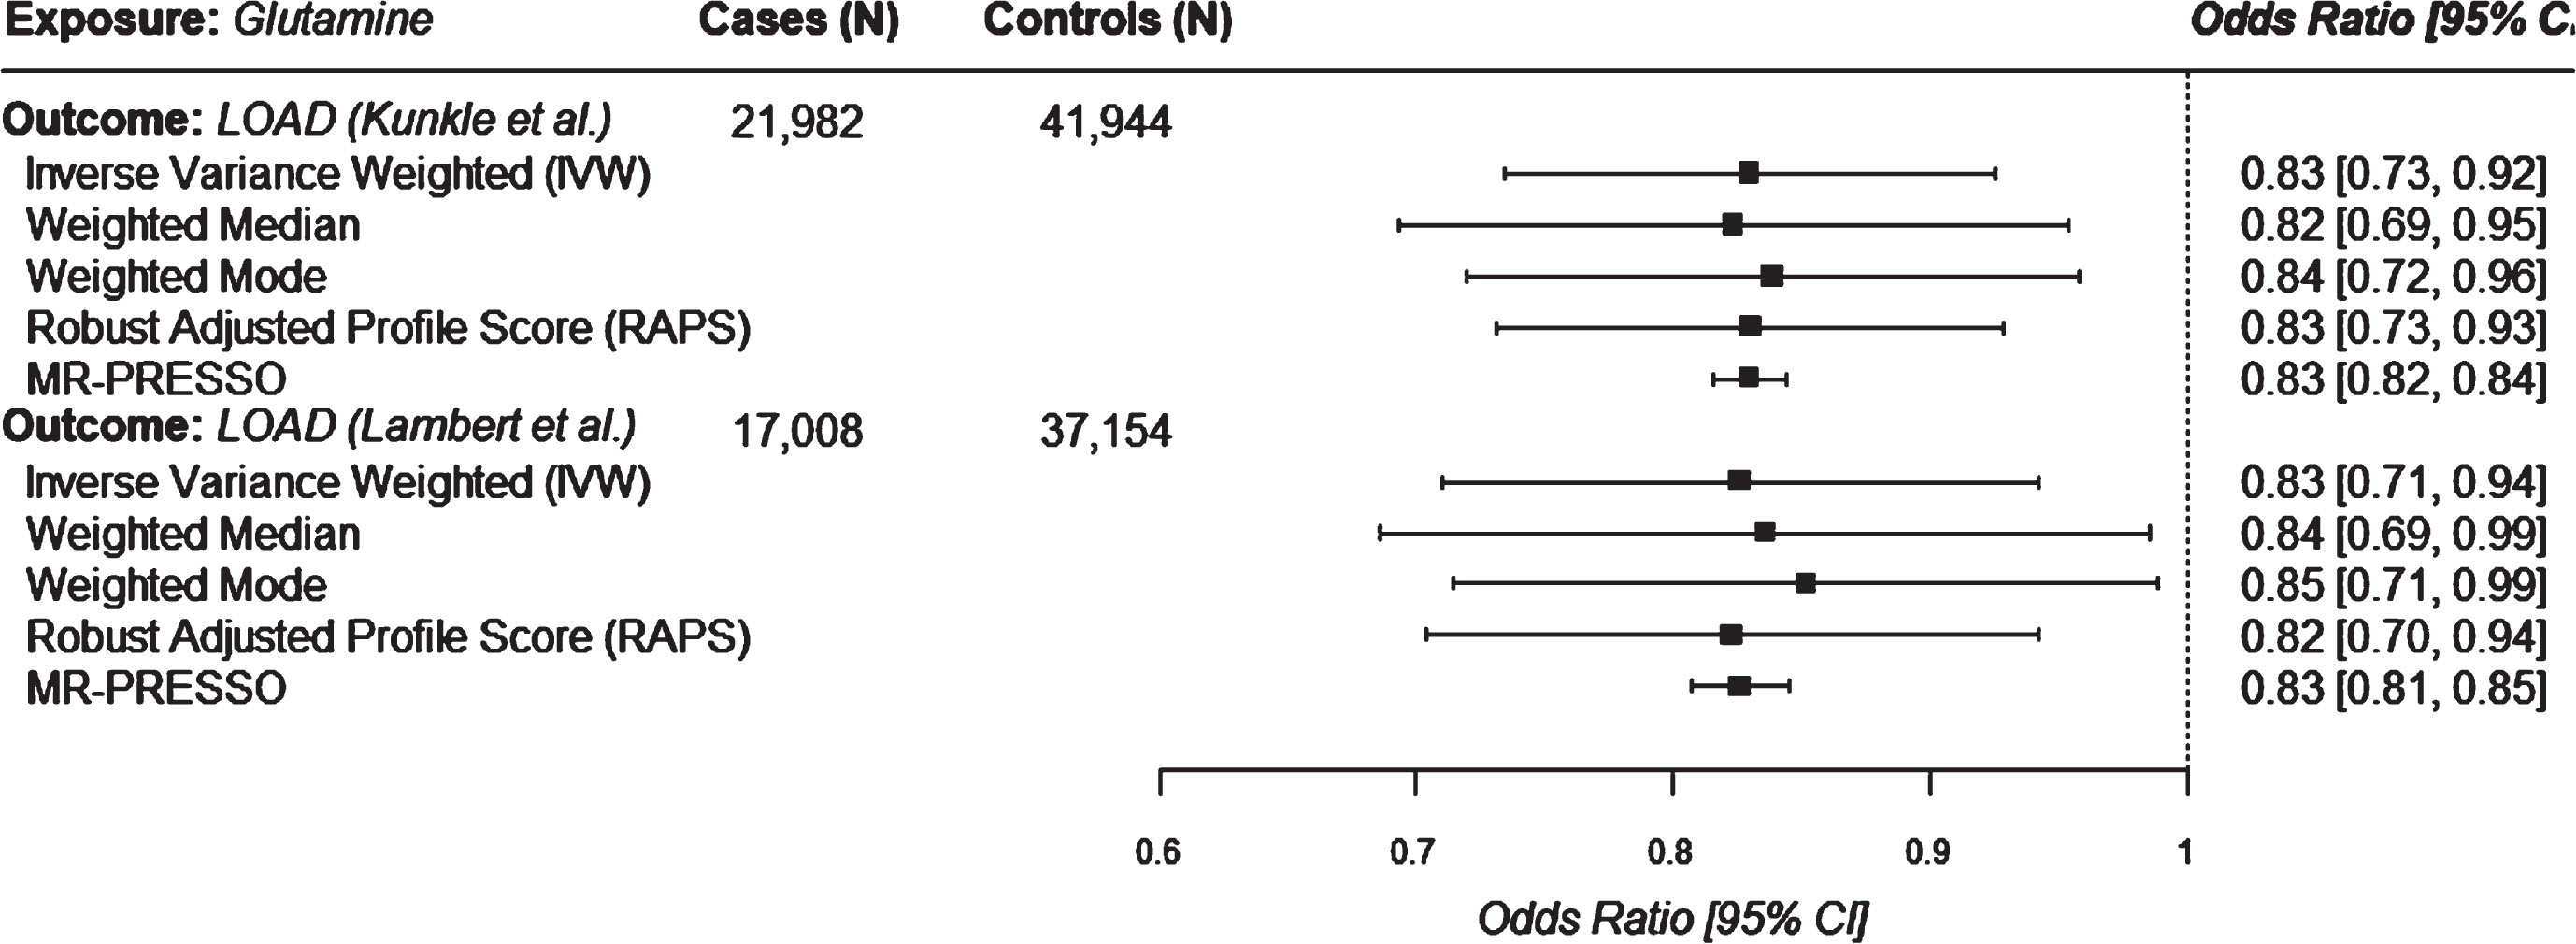
Univariable mendelian randomization estimates for glutamine on LOAD outcomes.
Bi-directional analysis revealed 175 significant associations between LOAD exposures and blood metabolite outcomes at the p < 0.05 threshold (Supplementary Table 9). Using the LOAD summary statistics from Lambert et al. we identified 98 significant associations, including 6 that were not identified using the Kunkle et al. GWAS. We subsequently identified 77 significant associations using the Kunkle et al. GWAS (Supplementary Table 9). Among the 25 associations initially identified using blood metabolites as our exposure, we identified a bi-directional effect among 22 measures, with the exceptions of glutamine, XXL.VLDL.PL.pct, and glucose (Fig. 2).
After applying our adjusted significance threshold, we identified four associations using the GWAS from Kunkle et al. Using the GWAS from Lambert et al. as an exposure, we identified five additional non-overlapping associations with blood metabolite outcomes (see Fig. 4 and Supplementary Table 9). Although all associations using the exposure GWAS from Lambert et al.—including cholesterol in very large HDL (XL.HDL.C), total lipids in very large HDL (XL.HDL.L), cholesteryl esters in very large HDL (XL.HDL.CE), and sphingomyelins—were nominally significant using the parallel GWAS from Kunkle et al., they did not suggest an association after applying our corrected significance threshold (see Fig. 4). Similarly, all associations using the exposure GWAS from Kunkle et al. did not meet our corrected significance threshold in analyses using the LOAD GWAS from Lambert et al.

Statistically significant (at Bonferroni-Adjusted Threshold) inverse variance weighted mendelian randomization estimates for either Kunkle et al. or Lambert et al. LOAD on blood metabolites.
Sensitivity analyses for these measures including median, mode, MR-RAPS, and MR-PRESSO estimates yielded protective effects consistent with the IVW estimate. F-statistics suggested that all instruments were sufficiently associated with LOAD (F > 10). Cochran’s Q and the I2GX statistic did not suggest statistically significant heterogeneity. MR-PRESSO analysis did not identify outlier variants. Inspection of forest plots and LOO analyses did not reveal heterogeneity or influential SNPs driving associations. Additional sensitivity analyses removing SNPs within 500 kb of the APOE gene were consistent with our primary analysis.
DISCUSSION
In this study, we conducted bi-directional MR analyses on the largest set of GWAS summary statistics for blood metabolites and LOAD available to date. Across multiple sensitivity analyses, glutamine was shown to be a robust protective marker against LOAD. We additionally identified 24 metabolite exposures with nominal effects on LOAD, and 175 associations for LOAD on metabolite outcomes. We additionally identified nominal evidence suggesting an increased risk of LOAD from higher levels of both ‘phospholipids to total lipids ratio in chylomicrons and extremely large VLDL’ and circulating glucose. In our bi-directional analysis using LOAD as an exposure, we identified evidence suggesting associations with increased levels of ‘concentration of very large HDL particles’ and decreased levels of ‘phospholipids to total lipids ratio in large LDL’ and ‘total BCAA’, but not with glutamine levels.
Previous epidemiological studies have suggested an association between blood metabolite levels and incidence of LOAD. In a recent analysis by Chen and Herrup [31], LOAD was suggested to directly reduce glutamine synthetase activity, as glutamine metabolism was shown to be compromised among LOAD patients. Our findings that genetically-predicted glutamine level is associated with lower risk of LOAD are consistent with previous traditional observational studies suggesting that higher circulating levels of glutamine are protective against LOAD [31]. A recent study from Buergel and colleagues identified creatinine, albumin and glutamine as predictive risk factors for all-cause dementia [32]. These findings have been further substantiated in two recent MR analyses, both using the same smaller metabolite GWAS than the one we used in our study, the two of which do not overlap [10, 11]. Although we identified some evidence of MR associations for lipid metabolites, these typically displayed a bi-directional effect, leaving the causal direction of these markers uncertain. In contrast to previous MR studies, we found limited evidence of protective effects from higher concentrations of HDL particles. A recent study from Lorde and colleagues [33] identified protective effects against LOAD from free cholesterol in very large HDLs, total lipids in very large HDLs, phospholipids in very large HDLs, and concentration of very large HDL particles. However, we were unable to replicate these associations at any level of significance in our analyses, suggesting potentially limited generalizability of these previous findings.
Although it is not clear whether levels of glutamine in blood reflect levels in the brain [34], glutamine can be a precursor for the excitatory neurotransmitter, glutamate, and the inhibitory neurotransmitter gamma-amino butyric acid (GABA). Alterations in glutamate and GABA-ergic circuits may underlie neural network disruptions in LOAD [35]. Glutamine production in the brain, catalyzed by glutamine synthetase, is primary to the astrocytes and putatively controlled by feedback mechanisms based on the levels of ammonia and glutamate [36, 37]. Glutamine synthetase in astrocytes converts glutamate and ammonia to glutamine and maintains homeostasis, which might be altered in LOAD [38]. Autophagy, a mechanism through which cells recycle and degrade, diminishes with age, which may further help long-living neurons remove protein remnants. Evidence supports that glutamine-deficient cells could reduce autophagy and may thus contribute to LOAD [31]. There is also evidence to suggest that glutamine is connected to inflammation and beta-amyloid levels [39]. Although most studies find a potential protective effect of glutamine on LOAD or related traits, some have found that glutamine levels are associated with increased risk, such as a study that found increased levels of glutamine in the cerebrospinal fluid of patients with Alzheimer’s disease [40], and a study that found higher levels of glutamine associated with an increased risk of dementia, Alzheimer’s disease, and lower cognitive function [41]. These conflicting results suggest the need for further study into the role of glutamine in neurodegenerative disease.
Our study has several strengths, including the use of the largest set of GWAS summary statistics for blood metabolites to date. We performed analyses across two LOAD GWAS to identify consistent causal effects. Statistically significant associations were further required to meet an adjusted significance threshold (p < 2.0×10⁻⁴) to reduce the odds of Type I error. We additionally applied a broad suite of sensitivity analyses and identified a consistent protective effect against LOAD from glutamine levels. Our study is also subject to several limitations. Although we used two LOAD GWAS in our main set of analyses, the samples used in these GWAS overlap, and thus cannot be considered to provide independent replication. Differences that we observed in the MR estimates between the two LOAD GWAS are therefore attributable to the additional samples included in the Kunkle et al. GWAS. Second, we note that MR designs are inherently vulnerable to horizontal pleiotropy, which would violate the assumption of an independent effect on the exposure. Critically, sensitivity analyses did not identify a pleiotropic effect in analyses using glutamine as the exposure or outcome. We were additionally able to validate results across more conservative tests such as MR-EGGER, MR-RAPS, and MR-PRESSO, suggesting little evidence of directional pleiotropy biasing observed effects.
We have identified glutamine as a potential protective factor in the development of LOAD, confirming prior research. Further exploration of the mechanisms underlying this protection are warranted as they may enhance the clinical capacity to reduce the risk of cognitive decline and disease.
AUTHOR CONTRIBUTIONS
Yann Klimentidis (Conceptualization; Data curation; Investigation; Supervision; Writing – original draft; Writing – review & editing); Ferris A. Ramadan (Conceptualization; Data curation; Formal analysis; Investigation; Project administration; Software; Visualization; Writing – original draft); Gayatri Arani (Formal analysis; Writing – original draft); Ayan Jafri (Investigation; Writing – original draft); Tingting Thompson (Data curation; Formal analysis; Writing – original draft); Victoria L. Bland (Formal analysis; Investigation; Writing – original draft); Benjamin Renquist (Investigation; Writing – review & editing); David A. Raichlen (Investigation; Writing – review & editing); Gene E. Alexander (Investigation; Writing – review & editing).
Footnotes
ACKNOWLEDGMENTS
The authors would like to thank the participants and organizers of studies that make up the LOAD IGAP consortium, and the participants and organizers of the UK Biobank.
FUNDING
The authors would also like to acknowledge funding from NIH R01HL136528, NIH R56AG067200, and NIH R01AG072445, NIH P30AG019610, NIH P30AG072980, the State of Arizona and Arizona Department of Health Services, and the McKnight Brain Research Foundation.
CONFLICT OF INTEREST
The authors have no conflict of interest to report.