
Abstract
Alzheimer’s disease (AD), associated with abnormal accumulation of amyloid-β (Aβ), is the most common cause of dementia among older people. A few studies have identified substantial AD biomarkers in blood but their results were inconsistent. Here we screened gene expression alterations on Aβ-GFP SH-SY5Y neuronal model for AD, and evaluated the findings on peripheral leukocytes from 78 patients with AD and 56 healthy controls. The therapeutic responses of identified biomarker candidates were further examined in Aβ-GFP SH-SY5Y neuronal and APP/PS1/Tau triple transgenic (3×Tg-AD) mouse models. Downregulation of apolipoprotein E (APOE) and tropomyosin receptor kinase A (TRKA) were detected in Aβ-GFP SH-SY5Y cells and validated by peripheral leukocytes from AD patients. Treatment with an in-house indole compound NC009-1 upregulated the expression of APOE and TRKA accompanied with improvement of neurite outgrowth in Aβ-GFP SH-SY5Y cells. NC009-1 further rescued the downregulated APOE and TRKA and reduced Aβ and tau levels in hippocampus and cortex, and ameliorated cognitive deficits in streptozocin-induced hyperglycemic 3×Tg-AD mice. These results suggest the role of APOE and TRKA as potential peripheral biomarkers in AD, and offer a new drug development target of AD treatment. Further studies of a large series of AD patients will be warranted to verify the findings and confirm the correlation between these markers and therapeutic efficacy.
INTRODUCTION
Alzheimer’s disease (AD), the most common type of dementia among older people, is a progressive neurodegenerative disease that slowly destroys memory and thinking skills, and eventually the ability to carry out the simplest daily tasks [1]. Although the etiology of AD has not been definitively established, evidence suggests that accumulation of amyloid-β (Aβ) peptide, a 40 or 42 amino acid fragment of Aβ protein precursor, plays an important role in the pathogenesis of the disease [2]. Aβ aggregates to form oligomers and other high-order polymerized structures that cause neuronal death via a number of mechanisms including neuroinflammation, oxidative stress, excitotoxicity, energy depletion, and apoptosis [3]. In clinical practice, no neuroimaging or laboratory test is currently accurate for predicting the onset and progression of AD [4–6]. Although brain imaging findings, such as Aβ deposition and hippocampal atrophy, are associated with an increased risk of progression [7, 8], the specificities of these imaging markers are still unsatisfactory. Low Aβ42 level and elevated tau in cerebrospinal fluid (CSF) confer an increased likelihood of AD. However, the inconvenience to obtain CSF limits their clinical application [6, 10].
Given that a central nervous system sample from AD patients is still difficult to access, a biomarker in peripheral tissue, especially from blood, should be more practical in clinical application. The exploration of blood-based biomarkers begins with Aβ-related peptides. However, the results of these biomarker studies are inconsistent. Plasma levels of Aβ42 and Aβ40 may rise, drop or remain unchanged in AD patients [11, 12]. Apart from Aβ, inflammatory molecules in plasma, such as IL-8, TNFR1, clusterin, IL-1, IL-7, IL-6, serum amyloid A, CCL15, and CXCL9, are reported as biomarker candidates [13–17]. However, contribution of these molecules to the specific pathogenesis of AD remains controversial.
To identify biomarker candidates relevant to AD pathogenesis, approaches to incorporate laboratory and clinical studies are necessary. By combination of systemic screening and molecular analysis in AD cell and animal models, as well as clinical case-control study, we found two biomarkers, apolipoprotein E (APOE) and tropomyosin receptor kinase A (TRKA), were consistently downregulated in AD models and peripheral leukocytes of AD patients. In cell and mouse models for AD, the downregulation of these gene expressions can be rescued by the treatment with NC009-1, an in-house C-alkylated indole compound NC009-1 (C19H16N2O3) [18] reducing Aβ, tau, and polyQ toxicity in cell and/or mouse models of AD and spinocerebellar ataxia type 17 (SCA17) [19–21]. These findings strongly suggest the role of APOE and TRKA as peripheral biomarkers for AD, and offer a new drug development target of AD treatment.
Materials and methods
Patient population
We recruited 78 patients diagnosed with AD and 56 unrelated healthy adult volunteers matched for age, gender, ethnic origin and area of residences as controls from the neurology clinics of Chang Gung Memorial Hospital. The diagnosis of probable AD was made by consensus, according to the criteria of the NINCDS-ADRDA criteria [22]. Patients who have a previous significant clinical history of neurological, psychiatric, somatic, toxic, drug or other determined causes for neurodegenerative diseases, drug or alcohol abuse were excluded. All subjects received Mini-Mental State Examination (MMSE) [23] and Clinical Dementia Rating (CDR) [24]. This study was performed according to a protocol approved by the Institutional Review Board of Chang Gung Memorial Hospital (ethical license No: 104-2092B) in which the experiments were done in accord with the Helsinki Declaration of 1975.
Aβ-GFP construct and doxycycline-inducible Aβ-GFP SH-SY5Y cell line
As described in our previous study [19], GFP-tagged Aβ was cloned and Flp-In SH-SY5Y cell line with doxycycline-inducible Aβ-GFP expression was established. Cells were maintained in DMEM/F12 containing 10% FBS, 5μg/mL blasticidin and 100μg/mL hygromycin. SH-SY5Y cells were seeded at a density of 4×10⁵ cells/well (6-well plates for mRNA/protein analysis) or 3×10⁴ cells/well (24-well plates for neurite outgrowth analysis), with retinoic acid (10μM; Sigma, St Louis, MO, USA) added at seeding time. At day 2, cells were treated with NC009-1 (5μM) or vehicle (0.1% DMSO, untreated control) for 8 h before inducing Aβ-GFP expression (doxycycline, 2μg/mL). The cells were kept in the medium containing retinoic acid, doxycycline and NC009-1 for six days. In-house indole compound NC009-1 was synthesized and characterized by NMR spectrum as described [18].
AD-related gene expression analysis
Total RNA from un-induced, induced or NC009-1-treated Aβ-GFP SH-SY5Y cells was extracted using Trizol reagent (Thermo Fisher Scientific), DNase treated and quantified. Reverse transcription was then carried out using RT2 First Strand Kit (Qiagen, Hilden, Germany) and the resulting cDNA was submitted to real-time quantitative PCR reactions on the human AD RT2 Profiler™ PCR Array (Qiagen) to assay gene expression changes. Samples were added to the reaction plates following the manufacturer’s instructions and the experiment was performed in triplicate in each group on an ABI PRISM® StepOnePlus Real-Time PCR System (Applied Biosystems, Foster City, CA, USA). Analysis was carried out using the spreadsheet provided by Qiagen.
Real-time PCR analysis
Total RNA from Aβ-GFP SH-SY5Y cells was extracted using Trizol reagent (Invitrogen, Carlsbad, CA, USA). Leukocyte RNAs from the human subjects were extracted by Tempus™ Blood RNA Tube (Thermo Fisher Scientific, Waltham, MA, USA). The RNA was DNase treated, quantified, and reverse-transcribed to cDNA using the SuperScript™ III reverse transcriptase (Invitrogen). Real-time quantitative PCR (RT-PCR) experiments were performed in the StepOnePlus Real-Time PCR System. Amplification was performed using 100 ng cDNA with gene-specific TaqMan fluorogenic probes Hs00171168_m1 for APOE, Hs00263492_m1 for PLAT, Hs00153674_m1 for SERPINA3, Hs01021011_m1 for TRKA, Hs01059137_m1 for ABCA1, Hs00252848_m1 for CHAT and 4326321E for HPRT1 (endogenous control) (Applied Biosystems). Fold change was calculated using the formula 2ΔCt, ΔCT = CT (control) – CT (target), in which CT indicates cycle threshold.
Plasma APOE analysis
Plasma APOE levels were measured using human APOE ELISA kit (ab108813, Abcam, Cambridge, MA) by following the manufacturer’s instructions. Levels of APOE were determined from a standard curve.
Neurite outgrowth analysis
Differentiated Aβ-GFP SH-SY5Y cells were washed with PBS and fixed in 4% paraformaldehyde at 4°C for 15 min. After permeabilized with 0.1% Triton X-100 and blocked by 3% BSA, cells were stained with primary anti-TUBB3 (neuronal class III β-tubulin) antibody (1:1000; Covance, Princeton, NJ, USA) at 4°C overnight and secondary anti-rabbit Alexa Fluor ®555 antibody (1:1000, Invitrogen) at room temperature for 3 h. Nuclei were detected using 4’-6-diamidino-2-phenylindole (DAPI). The total neurite outgrowth was assessed by using Metamorph microscopy automation and image analysis software (neurite outgrowth application module; Molecular Devices, San Jose, CA, USA).
RNA interference
To knockdown the expression of specific genes in Aβ-GFP SH-SY5Y cells, lentiviruses with short hairpin RNA (shRNA) targeting APOE (TRCN0000004909, TRCN0000004910 and TRCN0000010913), TRKA (TRCN0000001992, TRCN0000001993 and TRCN0000001995) and a negative control scrambled shRNA (TRC2.Void) were obtained from National RNAi Core Facility, IMB/GRC, Academia Sinica, Taipei, Taiwan. Lentiviruses were prepared according to the standard protocol. Cells were plated in 6-well plates (for protein analysis) or 24-well plates (for neurite outgrowth analysis) in the presence of retinoic acid on day 1 as described. Cells were infected with lentivirus (multiplicity of infection, 3) in medium containing 8μg/mL polybrene (Sigma) on next day. At 24 h post-infection, the culture medium was changed and cells were pretreated with NC009-1 (5μM) for 8 h followed by inducing Aβ-GFP expression for 6 days. Cells were then collected for APOE and TRKA protein analysis or analyzed for neurite outgrowth as described.
Western blot analysis
Total proteins from Aβ-GFP SH-SY5Y cells were prepared using lysis buffer containing 50 mM Tris-HCl pH 8.0, 150 mM NaCl, 1 mM EDTA pH 8.0, 1 mM EGTA pH 8.0, 0.1% SDS, 0.5% sodium deoxycholate, 1% Triton X-100 and protease inhibitor cocktail (Sigma). Proteins (10μg) were separated on 10% SDS-PAGE and blotted on to PVDF membranes by reverse electrophoresis. After blocking, the membrane was probed with antibody against GFP (1:500; Santa Cruz Biotechnology, Santa Cruz, CA, USA), APOE (1:500; GeneTex, Irvive, CA, USA), TRKA (1:500; Santa Cruz Biotechnology), ERK1/2 (1:500; Cell Signaling Technology, Danvers, MA, USA), pERK1/2 (Thr202/Tyr204) (1:500; Cell Signaling Technology), AKT (1:1000; Abcam, Cambridge, MA, USA), pAKT (Ser473) (1:500; Cell Signaling Technology), GAPDH (1:1000; MDBio Inc., Taipei, Taiwan), β-tubulin (1:5000; Sigma), or β-actin (1:5000; Millipore, Billerica, MA, USA). Then the immune complexes were detected by horseradish peroxidase-conjugated goat anti-mouse or goat anti-rabbit IgG antibody (1:5000; GeneTex) and chemiluminescent substrate (Millipore).
In addition, isolated hippocampal and cortical tissues from transgenic mice (as described below in Animal studies) were homogenized and isolated proteins (20μg) were separated and blotted. After blocking, the membranes were probed with antibody against mouse APOE (1:500; Bioss Inc., Woburn, MA, USA), TRKA (1:500; Santa Cruz Biotechnology) or GAPDH (1:1000; MDBio Inc.), and the immune complexes detected as described above.
Animal studies
3×Tg-AD (harboring APPSwe, PS1M146 V, and TauP30IL transgenes) mice [25] were purchased from the Jackson Laboratory (004807; Bar Harbor, ME, USA). Six-month-old male homozygous 3×Tg-AD mice were group housed at 20–25°C and 60% relative humidity under a 12-h light/dark cycle (light turned on at 7 a.m.), with food and water available ad libitum. Mice were randomly divided into 3 groups: – streptozocin (STZ), STZ, and STZ/NC009-1 (n = 12 animals/group). Hyperglycemia was induced by STZ to accelerate the development of AD phenotype [26]. Briefly, mice were fasted for 12 h each day prior to intraperitoneal administration of STZ (100 g/kg; Sigma) or vehicle (0.1 M sodium citrate pH 4.5) for 4 times. Mouse body weight was measured and blood glucose concentration was quantified using blood glucose meter (Bioland Technology, Taipei, Taiwan). NC009-1 (40 mg/kg) or vehicle (DMSO:Cremophor EL:0.9% saline = 1:2:7) was intraperitoneally administrated every day for 22 days from days 15 to 36. All procedures were conducted in compliance with the ARRIVE (Animal Research: Reporting In Vivo Experiments) guidelines and approved by the Institutional Animal Care and Use Committee of National Taiwan Normal University, Taipei, Taiwan (Permit Number: 103002).
Open field test
An open field test was used for tracking autonomous locomotive activity of the mice. Mice were carefully placed in the center of white open field box (30×30×30 cm) and allowed to explore freely in the absence of an observer. A video camera (EDiMAX, Taipei, Taiwan) was mounted on the ceiling above the chamber and connected to an automated video tracking system. The total travel (exploratory) distance and rest (inactive) time in 10 min were automatically recorded and analyzed by PhenoTracker (TSE system, Thuringia, Germany).
Y-maze task
Mice were placed in the middle of Y-maze composed of three equally spaced arms (40×30×15 cm) placed at a 120° angle from each other. Mice were freely explored for 8 min and the number of entries and the sequence of arms entered were recorded. Spontaneous alternation behavior, which is regarded as a measure of spatial memory, was defined as entry into all three arms on consecutive choices in overlapping triplet sets. Percent alternation was calculated as: (number of successful alternations/total arm entries – 2)×100.
Morris water maze task
The water maze apparatus consisted of a circular pool made of white plastic (1 m diameter and 0.76 m high), a hidden platform made of white plastic (submerged 1 cm below the water surface), four cues of various types providing distal landmarks in the testing area of the room, and a video camera suspended 2.5 m above the center of the pool and connected to a video tracking system. The pool was filled up with opaque tap water (24–26°C, 0.35 m high) by the addition of nontoxic white paint. In opaque water, mice relied on external cues to find the hidden platform. One day before training, all mice underwent pre-training in order to assess their swimming ability and to acclimatize them to the pool. For pre-training, mice were placed in the pool without platform to swim for 60 s. After three 60-s trials, a platform was placed at the center of the pool and the mouse was allowed to stay there for 20 s. For training, the platform was placed at one quadrant and mice received four trials in the pool on each of 4 days, with a cue signaling platform location. The submerged platform remained stationary and entry points changed semi-randomly throughout the training period. The trial ended when an animal climbed onto the platform or when a maximum of 60 s elapsed, and the mouse was placed on the platform and faced the cue for 20 s, learning where the platform was. After 4 training days, mice were given three testing trials to assess the time taken to climb onto the hidden platform. After the last testing trial, the platform was removed from the pool, and all mice were given two probe trials after 2 and 48 h to record the time spent within the quadrant in which the platform was previously located over 60 s periods to evaluate the retrieval of the short-term and long-term memory regarding the platform. All the data were analyzed by PhenoTracker.
Immunohistochemistry (IHC) and image analysis
Mouse brains were removed and postfixed in the 4% paraformaldehyde solution overnight, and then immersed in 30% sucrose solution for cryoprotection at 4°C until sectioned. Coronal sections of 30μm thickness were made on a cryostat (Leica RM2125 RTS, Leica, Wetzlar, Germany). Before IHC staining, a heat-induced antigen retrieval buffer (pH 9.0, Thermo Fisher Scientific) was used to break methylene bridges formed during fixation and expose antigenic sites, allowing antibodies to bind. For IHC, free floating sections were pretreated with 1% H2O2 for 15 min to quench endogenous peroxidase, then incubated overnight at 4°C with primary antibody to NeuN (1:100; Bioss Inc.), Aβ (1:100; Bioss Inc.), or tau (1:100; Bioss Inc.). The sections were then washed and detected by using the UltraVision™ Quanto Detection System HRP (horseradish peroxidase) DAB (diaminobenzidine, chromogenic substrate) (Thermo Fisher Scientific). Sections were counterstained with hematoxylin to show nuclei (Lab Vision™ Autostainer 480S-2D, Thermo Fisher Scientific), dehydrated with ethanol and xylene, and mounted for microscopic examination. Image processing and analysis was conducted using the IHC toolbox plugin of ImageJ [27]. After removed all other stains except the DAB, image was converted into grayscale image and a threshold was applied to eliminate unwanted areas. Then gray-level intensity and area of the image were collected. The same threshold was applied to all images to ensure consistency between measurements.
Statistical analysis
For each set of values, three independent experiments were performed and data were expressed as the means±standard deviation (SD). Differences between groups were evaluated by Student’s t-test or ANOVA followed by LSD post-hoc test where appropriate. All p values were two-tailed, with values of p < 0.05 were considered significant. In addition, the χ2 test or Student’s t-test was utilized to compare demographic data between controls and patients. The p value of statistical significance was adjusted by Fisher’s exact test where appropriate. General linear model (GLM) was performed to determine the difference in the expression of each marker between patients and controls. Confounding factors including age, gender, education years, and APOE genotyping were adjusted in the models. Based on the previous data [28–30], it was calculated that when using a two-tailed t-tests with the significance level at 0.05, the total sample number in this study obtained a power greater than 0.8 to detect the difference of a marker with effect size > 0.49 between the groups of AD and controls. All the data analyses were performed using SAS software version 9.1.3 (SAS Institute).
RESULTS
Expression profiles of AD-related genes in Aβ-GFP SH-SY5Y cells
Previously we have established a Tet-On inducible Aβ-GFP neuronal model in which Aβ-GFP in SH-SY5Y cells is expressed under induction with doxycycline [19] (Fig. 1A–D). The expressed Aβ-GFP significantly reduced neurite outgrowth on neurons differentiated from SH-SY5Y cells (Fig. 1E, 86%, p = 0.001). We then applied RT2 Profiler PCR array targeting the expression of AD-related genes to this neuronal model with/without the induction of Aβ-GFP. As listed in Table 1, the PCR array revealed that out of the 84 tested transcripts, six AD-related genes showed more than 1.5-fold downregulation in their expression levels (–1.61 to –2.40-fold) upon induction of Aβ-GFP (Fig. 1F). Real-time PCR further confirmed the downregulation of ABCA1, APOE, CHAT, TRKA, and SERPINA3 genes by induced expression of Aβ-GFP (Fig. 1G, 86–58%, p = 0.012–0.005).

Biomarkers identification via RT2 Profiler™ PCR Array. A) Experiment flow chart. Tet-On Aβ-GFP SH-SY5Y cells were plated with retinoic acid (RA, 10μM) added at seeding time. Next day, Aβ-GFP expression was induced by treatment with doxycycline (Dox, 2μg/ml) for one week. B) Fluorescence microscopy images of differentiated SH-SY5Y cells with/without Aβ-GFP expression. TUBB3-positive cells and neurites were shown in yellow. Nuclei were counterstained with DAPI (blue). C) Induction of Aβ-GFP mRNA level relative to HPRT1 (internal control). D) Immunoblot analysis of induced Aβ-GFP protein. GAPDH was used as a loading control. E) Neurite outgrowth assay. To normalize, the relative neurite outgrowth of un-induced cells is set as 100% and p value between induced versus un-induced cells (n = 3). F) AD pathway-associated gene expression changes between induced/un-induced Aβ-GFP SH-SY5Y cells. Genes with 1.5-fold or greater changes are shown. G) Expression levels of APOE, PLAT, SERPINA3, TRKA, ABCA1 and CHAT analyzed by real-time PCR using HPRT1 as an internal control. To normalize, the expression levels of un-induced cells are set as 100% and p values between induced versus un-induced cells were compared (n = 3).
Genes identified in human AD PCR array showing< -1.5-fold expression changes in induced versus un-induced Aβ-GFP SH-SY5Y neuron-like cells
ABCA1, APOE, CHAT, TRKA, and SERPINA3 expressions in peripheral leukocytes of AD patients
To validate the potential of these altered gene expression as clinical biomarkers for AD, we examined the expression levels of ABCA1, APOE, CHAT, SERPINA3, and TRKA in peripheral leukocytes of 78 AD patients and 56 normal controls. The expression of CHAT and SERPINA3 could not be detected in peripheral leukocytes. After adjusting for confounding factors, we found that there was no significant difference in the expression level of ABCA1 between AD patients and controls. However, the expression levels of APOE and TRKA were significantly lower in AD patients compared with normal controls (Table 2). Nevertheless, there was no association between MMSE scores and the expression levels of APOE and TRKA. Consistent with above findings, APOE level in plasma was lower in AD patients compared to normal controls (160.0±34.5μg/mL versus 187.5±43.6μg/mL, p < 0.001; Table 2). Together with the observed downregulation of APOE and TRKA in the neurons differentiated from Aβ-GFP SH-SY5Y cells, our findings strongly suggested the potential of APOE and TRKA as peripheral biomarker candidates for AD.
Characteristics of the subjects, mRNA expression and plasma APOE in AD patients and normal controls
Comparisons between two groups were analyzed by χ2 test or at-test where appropriate. Data are expressed as percentage or mean±SD. aGLM, adjusting for age, gender, education years, and APOE ɛ4 carrier.
To explore the potential interaction between gene expression in leukocytes and APOE genotypes, we stratified our results according to APOE ɛ4 allele status (Table 3). In AD group, the expression levels of APOE and TRKA in APOE ɛ4 carriers were consistently higher than those in non-APOE ɛ4 carriers (APOE: 0.002 versus 0.0006, p = 0.025; TRKA: 0.005 versus 0.004, p = 0.035). In normal control, similar higher expression levels of APOE and TRKA were also observed in APOE ɛ4 carriers compared to non-APOE ɛ4 carriers (APOE: 0.006 versus 0.0009, p < 0.001; TRKA: 0.009 versus 0.005, p = 0.049).
The effect of APOE ɛ4 allele on the expression of the APOE and TRKA
p value1 GLM, adjusting for age, gender, education years, and AD. p value2 GLM, adjusting for age, gender, and education years.
Effects of indole compound NC009-1 on APOE and TRKA expression in Aβ-GFP SH-SY5Y-differentiated neurons
The ideal biomarker for AD may provide insight into established pathways associated with pathogenesis and monitor treatment response for potential disease modifiers. Previously we showed that an indole compound NC009-1 improved neuronal cell viability and neurite outgrowth in mouse hippocampal primary culture and ameliorated Aβ-induced inhibition of long-term potentiation in mouse hippocampal slices [19]. Thus we examined the effects of NC009-1 (5μM) on alternations of APOE and TRKA protein/mRNA levels and downstream targets in neurons differentiated from Aβ-GFP SH-SY5Y cells (Fig. 2A, B). The results showed that treatment with NC009-1 significantly rescued the Aβ-induced downregulation of APOE and TRKA mRNA (Fig. 2C, 106–109% versus 68–79%, p = 0.019–0.003) and proteins (Fig. 2D, 102–131% versus 78–82%, p = 0.009–0.008).
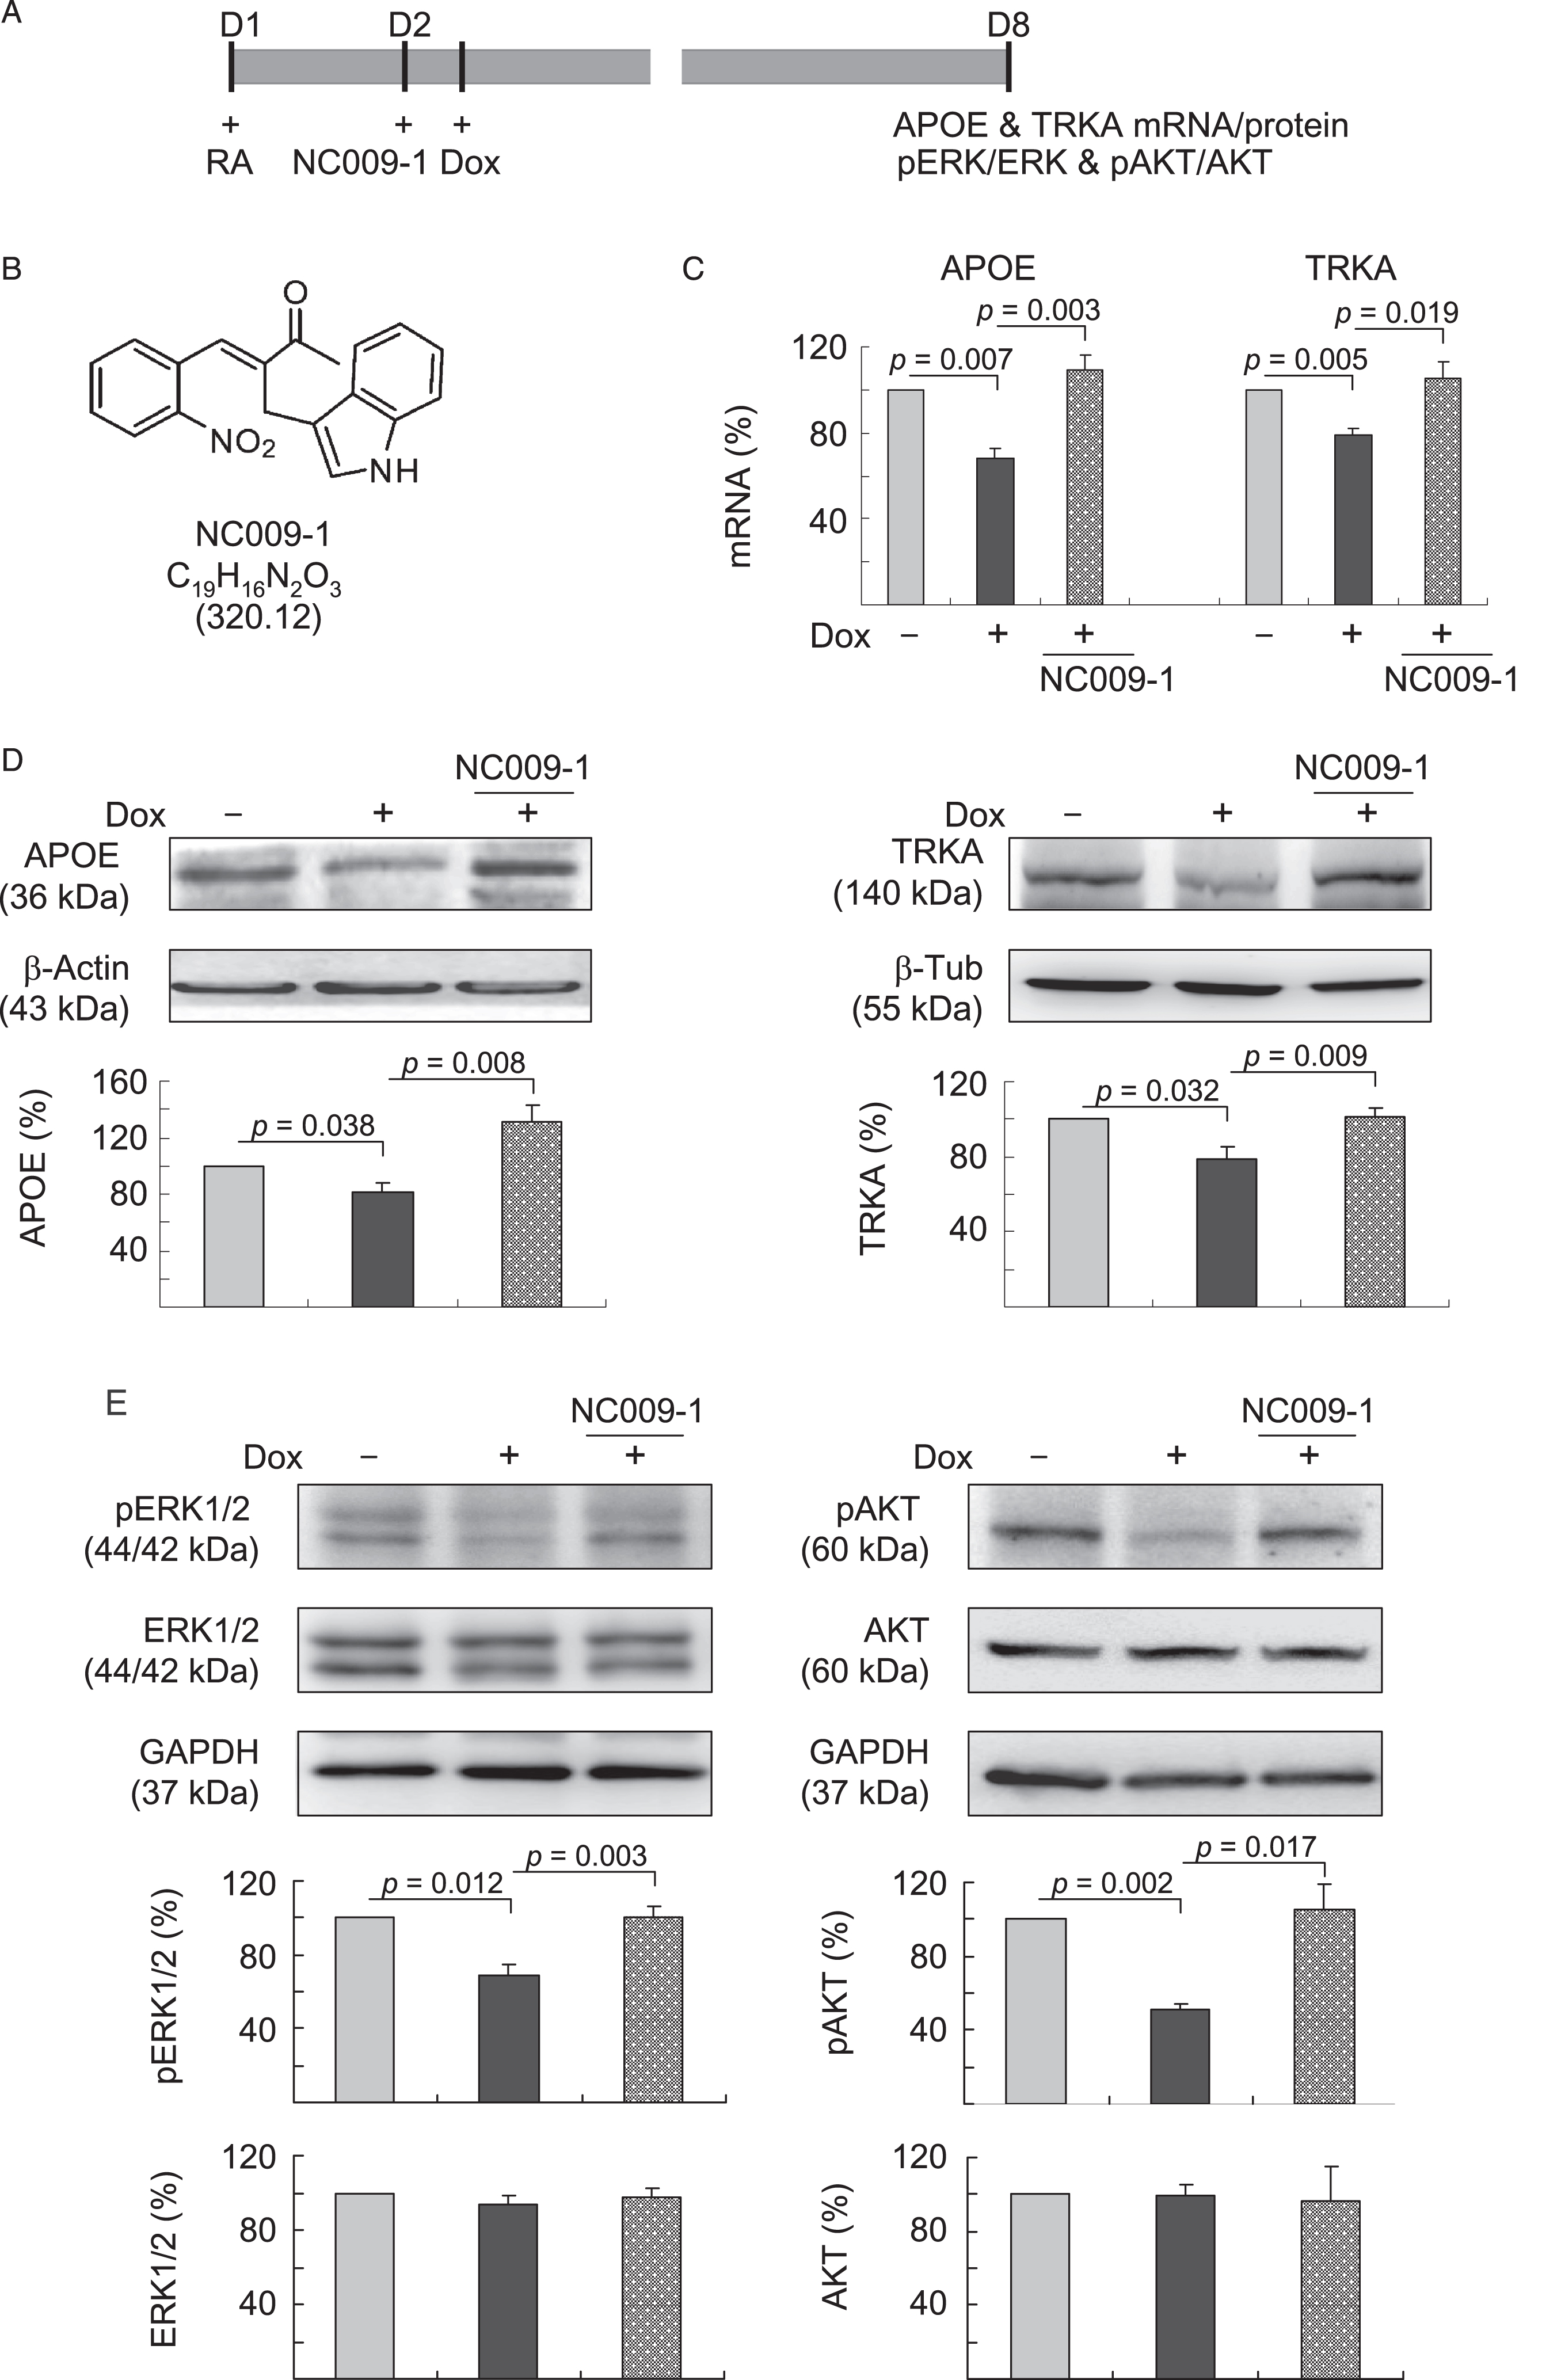
Indole compound NC009-1 augments APOE and TRKA and downstream pERK and pAKT expression in Tet-On Aβ-GFP SH-SY5Y cells. A) Experiment flow chart. Cells were plated with retinoic acid (RA, 10μM) added at day 1. Next day, NC009-1 (5μM) or vehicle (0.1% DMSO) was added to the cells for 8 h followed by inducing Aβ-GFP expression (+Dox, 2μg/ml) for 6 days. APOE and TRKA mRNA/protein and downstream pERK and pAKT were assessed. B) Structure, formula and molecular weight of NC009-1. C) Real-time PCR analysis of APOE and TRKA mRNAs. To normalize, the expression levels of un-induced cells are set as 100%. D) Western blot analysis of APOE and TRKA proteins using β-actin or β-tubulin as a loading control. E) Western blot analysis of pERK1/2 (Thr202/Tyr204), ERK1/2, pAKT (S473), and AKT proteins using GAPDH as a loading control. For C–E, p values between induced versus un-induced cells or compound-treated versus untreated cells were compared (n = 3).
APOE and TRKA activate ERK and/or AKT signaling pathways for neuroprotection [31–34]. Therefore, we examined the expression levels of ERK1/2, pERK1/2 (Thr202/Tyr204), AKT and pAKT (S473) following treatment with NC009-1 in Aβ-GFP SH-SY5Y neuronal model. As shown in Fig. 2E, while the levels of ERK1/2 and AKT were not affected, pERK1/2 (69%, p = 0.012) and pAKT (S473) (51%, p = 0.002) expression levels were attenuated with induction of Aβ-GFP for 6 days. Treatment with NC009-1 rescued the reduction of pERK1/2 (Thr202/Tyr204) (101% versus 69%, p = 0.003) and pAKT (S473) (105% versus 51%, p = 0.017) relative to un-induced control (100%).
APOE and TRKA as therapeutic targets in NC009-1-treated Aβ-GFP SH-SY5Y-differentiated neurons
We then explored the effect of gene silence of APOE or TRKA in neurite outgrowth by lentivirus-mediated RNA interference. Differentiated Aβ-GFP neuronal cells were infected with lentivirus carrying APOE or TRKA-specific shRNA or a negative control (scramble shRNA). The next day, cells were pretreated with NC009-1 (0.5μM) for 8 h followed by doxycycline-induced Aβ-GFP expression for 6 days (Fig. 3A). Treatment with NC009-1 significantly increased APOE/TRKA protein expression (93–100% versus 67–81%, p = 0.038–0.027; Fig. 3B) and improved neurite outgrowth (length: 114% versus 86%, p < 0.001; process: 105% versus 83%, p = 0.002; branch: 103% versus 73%, p < 0.001; Fig. 3C–D) in Aβ-GFP expressing cells, compared to the untreated cells. However, NC009-1-treated differentiated Aβ-GFP neuronal cells infected with APOE- or TRKA-specific shRNA revealed downregulated APOE or TRKA protein expression (51–11% versus 93–100%, p = 0.019–0.001; Fig. 3B) and reduced neurite outgrowth (length: 81–66% versus 114%, p = 0.016–<0.001; process: 86–78% versus 105%, p = 0.016–0.014; branch: 60–55% versus 103%, p < 0.001; Fig. 3C, D), compared to the scramble control. These findings indicated that APOE and TRKA participated in AD pathogenesis and enhancing APOE and TRKA expression may be a potent therapeutic pathway for neuroprotection in AD.
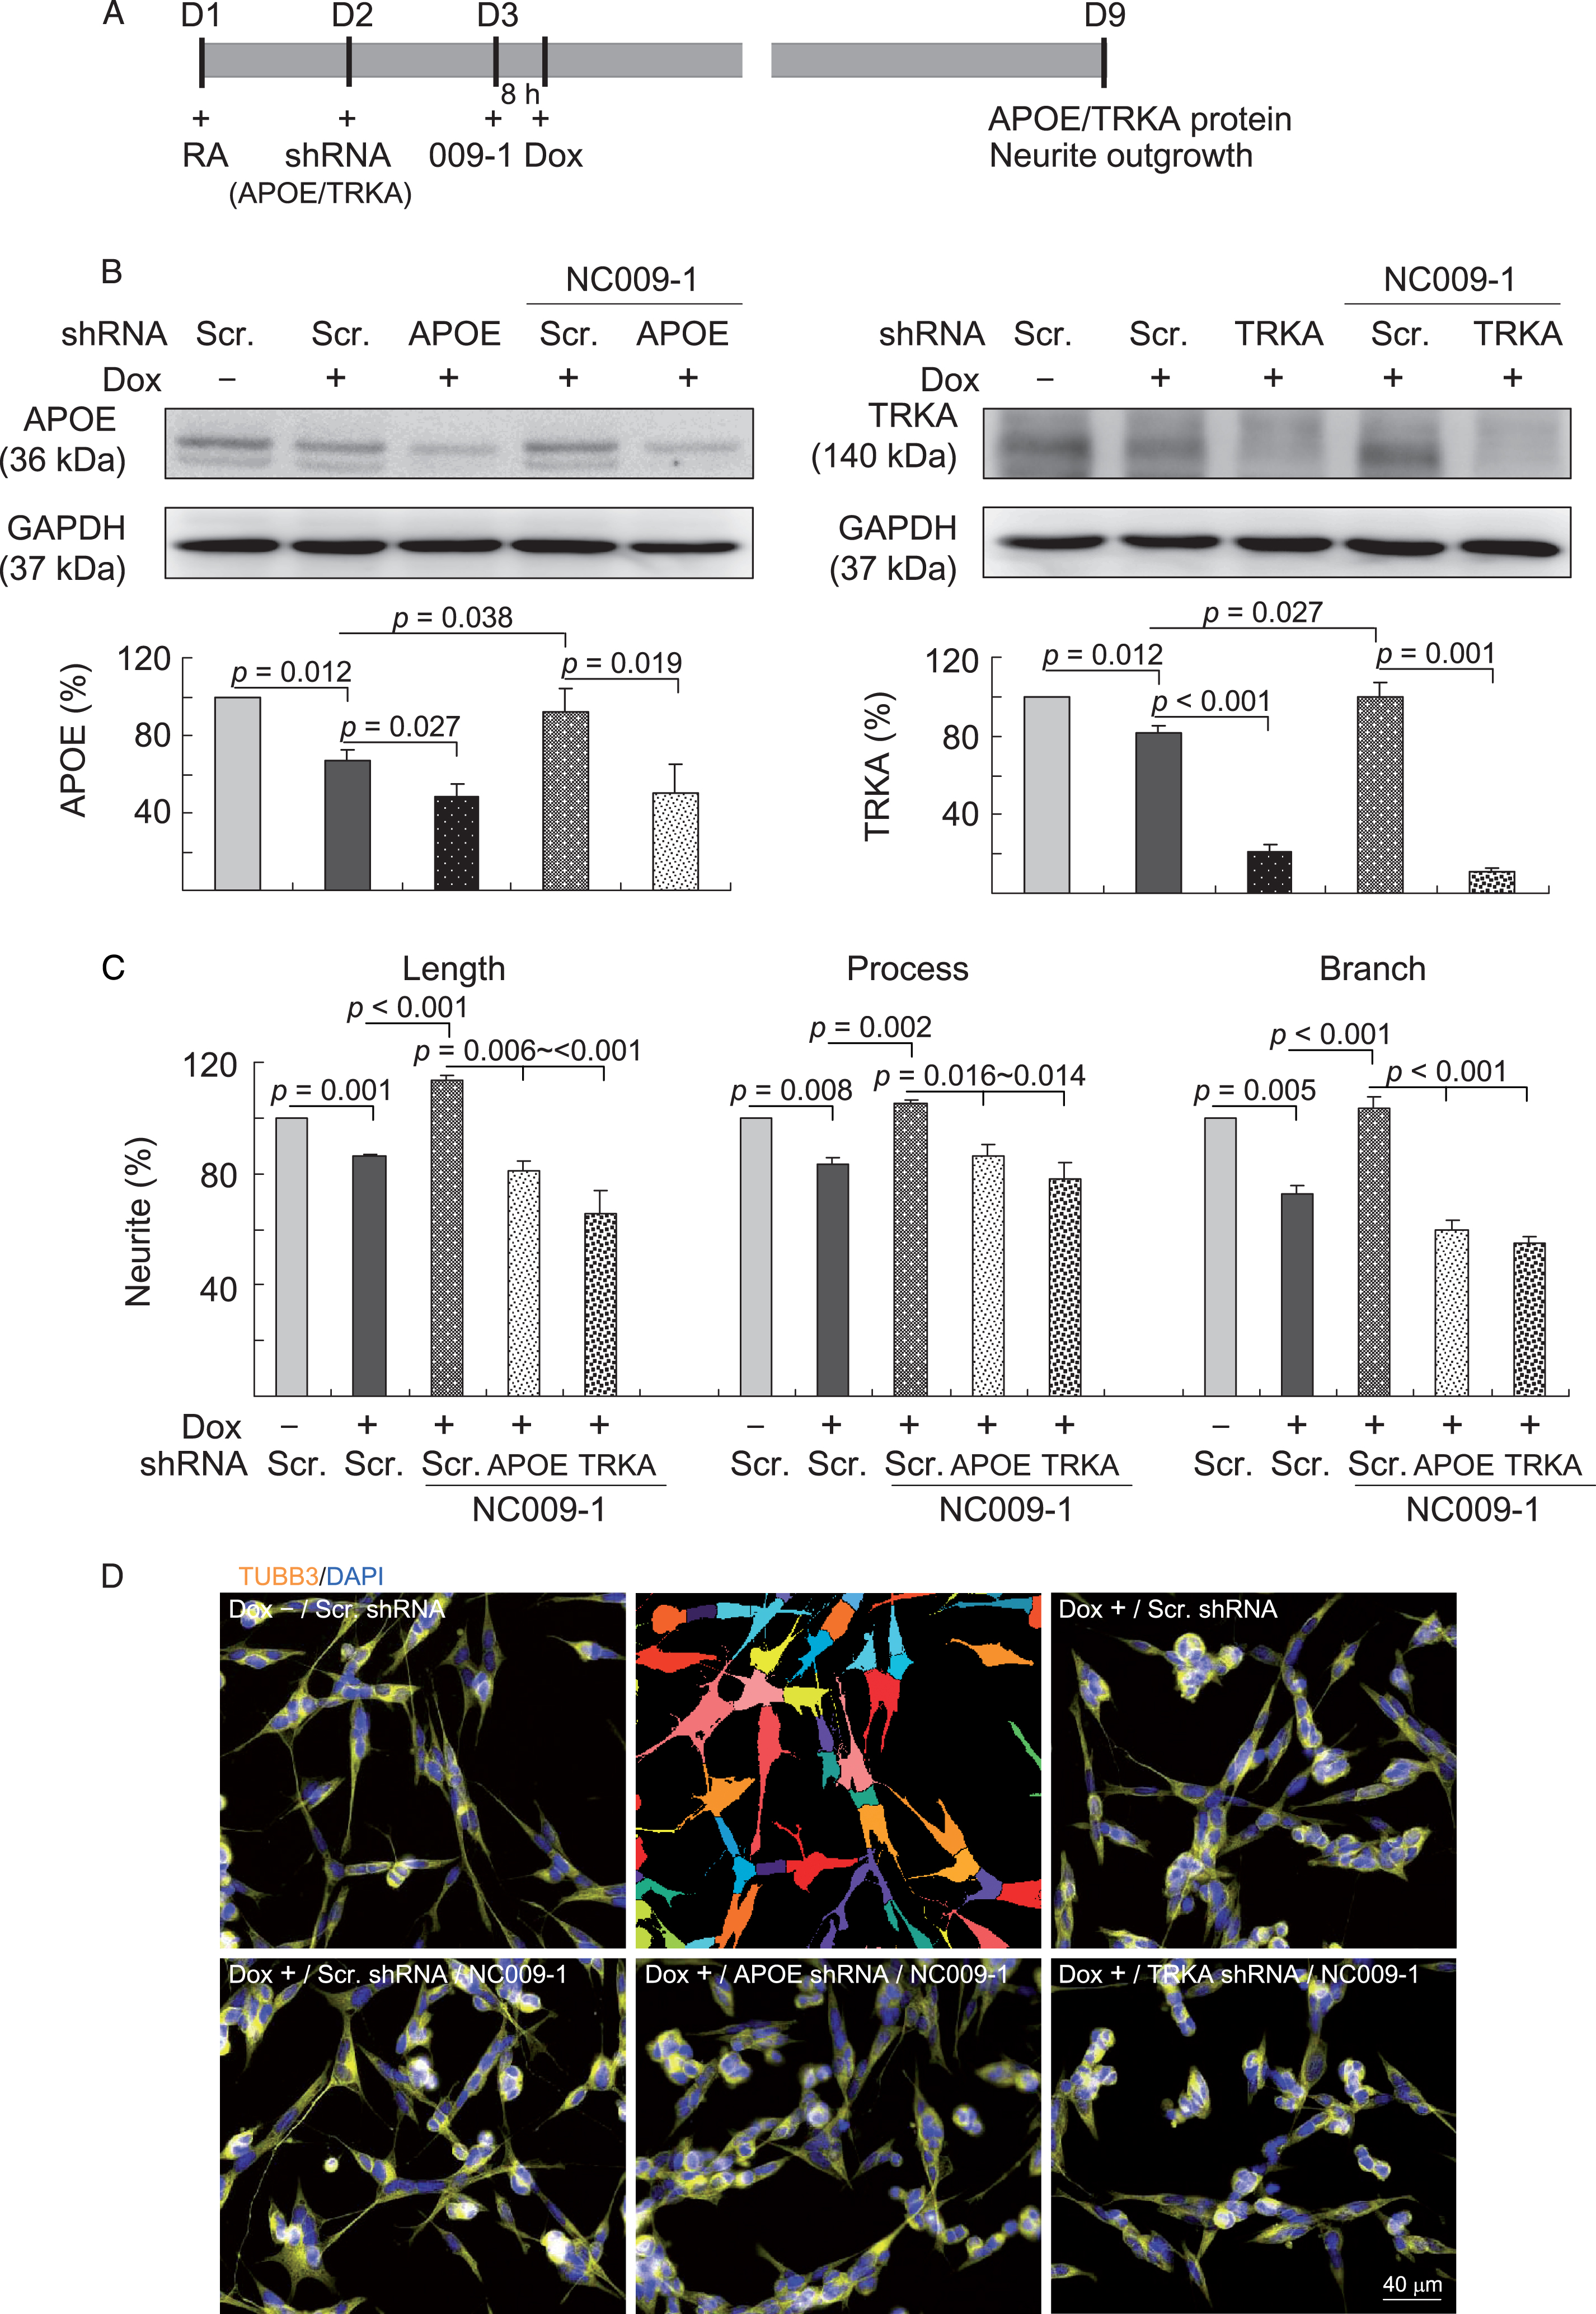
APOE/TRKA gene silence reduced neurite outgrowth in NC009-1-treated Aβ-GFP SH-SY5Y cells. A) Experiment flow chart. Cells were plated onto 6-well (for protein analysis) or 24-well (for outgrowth analysis) dishes with retinoic acid (RA, 10μM) added at day 1. Next day, cells were infected with lentivirus with short hairpin RNA (shRNA) targeting APOE, TRKA or a negative control scramble (Scr.) shRNA. At 24 h post-infection, NC009-1 (5μM) was added to the cells for 8 h followed by inducing Aβ-GFP expression (+Dox, 2μg/ml) for 6 days. Then, the cells were collected for APOE/TRKA protein analysis by immunoblotting and neurite outgrowth analysis by immunocytochemical staining. B) Western blot analysis of APOE and TRKA protein levels in NC009-1-treated cells with APOE/TRKA gene silence. GAPDH was used as a loading control. To normalize, the relative APOE/TRKA level of un-induced cells was set as 100%. C) Neurite outgrowth (including length, process and branch) assay of NC009-1-treated cells with APOE/TRKA gene silence. To normalize, the relative neurite outgrowth of un-induced cells was set as 100%. For B and C, p values between induced versus un-induced cells or compound/shRNA-treated versus untreated cells were compared (n = 3). D) Representative microscopic images of un-induced (Dox–), induced (Dox+)/scramble (Scr.) shRNA-infected, and induced (Dox+)/shRNA (scramble, APOE or TRKA)-infected/NC009-1-treated cells. TUBB3-positive cells and neurites were shown in yellow. Nuclei were counterstained with DAPI (blue). Shown next to the un-induced image is image segmentation of un-induced cells with multi-colored mask to assign each outgrowth to a cell body for quantification.
Effects of NC009-1 on spatial learning and memory in STZ-treated 3×Tg-AD mice
3×Tg-AD mice were used as an in vivo animal model to explore the role of APOE and TRKA in AD pathogenesis and the potential of NC009-1 for AD treatment. At 6 months of age, the homozygous triple transgenic mice were neuropathologically characterized by diffuse Aβ plaques in the neocortex, and intraneuronal Aβ buildup in pyramidal neurons of the hippocampus, cortex, and amygdale [25]. At this age, the mice were able to learn the Morris water maze task but required more training [35]. However, it was not until 12 to 15 months of age that conformationally altered and hyperphosphorylated tau became evident and accumulated tau proteins formed aggregates [25]. As impairment of brain glucose metabolism correlates well with the clinical symptoms in AD [36] and STZ exacerbated cognitive deficits in 3×Tg-AD mice [26], we induced hyperglycemia with STZ in 6-month-old 3×Tg-AD mice to accelerate the development of AD phenotypes (Fig. 4A). As shown in Fig. 4B, blood glucose measured at different time points remained relatively constant for the normoglycemic group (–STZ, 105–111 mg/dL). STZ injection increased blood glucose significantly, from 113 mg/dL (day 1) to 140 mg/dL (day 8, p = 0.021) and 294 mg/dL (day 29, p < 0.001) in STZ group. NC009-1 treatment significantly reduced blood glucose on day 22 (from 284 to 184 mg/dL, p = 0.002) and day 29 (from 294 to 191 mg/dL, p < 0.001) in STZ/NC009-1 group. No significant change of body weight was observed among the normoglycemic group (–STZ) and hyperglycemic groups without (STZ) or with NC009-1 (STZ/NC009-1) treatment. These results showed that STZ induced a hyperglycemic condition in 6-month-old 3×Tg-AD mice, and NC009-1 treatment could partially improve hyperglycemia.
An open field test was conducted on day 24 to explore the spontaneous motor activities and anxious mood in mice. No significant change was observed in distance traveled and time inactive of 3×Tg-AD mice with or without STZ or NC009-1 (Fig. 4C). On day 26, we tested 3×Tg-AD mice with or without STZ or NC009-1 treatment in Y-maze alternation test which is a spatial working memory task based on the natural tendency of the mice to alternate between the three arms. As shown in Fig. 4D, Y-maze spontaneous alternation rate was reduced in hyperglycemic (STZ) 3×Tg-AD mice as compared to normoglycemic group (–STZ) (54% versus 62%, p = 0.005). NC009-1 treatment enhanced working memory in hyperglycemic 3×Tg-AD mice (STZ/NC009-1 group) (from 54% to 73% spontaneous alternation rate, p < 0.001).

Indole compound NC009-1 rescues spatial working memory, spatial learning and memory in STZ-treated 3×Tg-AD mice. A) Experiment flow chart. Blood glucose (BG) and body weight (BW) and were measured on days 1, 8, 15, 22, and 29. Mice were ip injected by streptozocin (STZ, 100 mg/kg) or vehicle (0.1 M sodium citrate pH 4.5) at days 2, 3, 9, and 10, and then by NC009-1 (40 mg/kg) or vehicle (DMSO:Cremophor EL:0.9% saline = 1:2:7) from days 15 to 36. Open field, Y-maze and Morris water maze tasks were performed on days 24, 26 and 29–36, respectively. Mice in –STZ, STZ, and STZ/NC009-1 groups B–E received vehicle, STZ, and STZ+NC009-1, respectively during the course of the experiment. B) Body weight and blood glucose of the mice. C) Open field measurement of spontaneous motor activities (distance traveled) and anxious mood (time inactive) in 10 min of testing period. D) Y-maze measurement of spontaneous alternation rate in 8 min of testing period. E) Morris water maze testing of latency to find the hidden platform (latency) in training and testing and duration in target quadrant in probe trials (2 and 48 h). For B–E, p values between STZ versus – STZ mice or STZ/NC009-1 versus STZ mice (*) were compared. # and *: p < 0.05, # # and **: p < 0.01, # # # and ***: p < 0.001.
To study the effect of NC009-1 on hippocampal-dependent learning and memory retrieval in hyperglycemic 3×Tg-AD mice, we conducted Morris water maze test with training, testing and probe trials on days 29–36 (Fig. 4E). After pre-training for one day, the latency of the tested mice to find the hidden platform improved throughout the 4 following training days. When the performances of hyperglycemic (STZ) and normoglycemic (– STZ) 3×Tg-AD mice were compared, hyperglycemic 3×Tg-AD mice spent longer searching time for the platform as compared with the normoglycemic 3×Tg-AD mice in all 4 training days (day 1:54 s versus 46 s, p = 0.025; day 2:48 s versus 39 s, p = 0.044; day 3:43 s versus 31 s, p = 0.005; day 4:40 s versus 26 s, p = 0.006). NC009-1 treatment significantly reduced the latency of hyperglycemic 3×Tg-AD mice on training day 2 (from 48 s to 37 s, p = 0.010), day 3 (from 43 s to 34 s, p = 0.023) and day 4 (from 40 s to 28 s, p = 0.008). In the following testing on day 34, the latency in hyperglycemic 3×Tg-AD mice was significantly longer than that of the normoglycemic 3×Tg-AD mice (39 s versus 21 s, p = 0.001) and NC009-1 treatment significantly reduced the latency (27 s versus 39 s, p = 0.021). Our results demonstrated that STZ-induced hyperglycemia enhanced a deficit in the spatial learning ability and NC009-1 rescued the impairment of acquisition of spatial reference learning in 3×Tg-AD mice. In the probe trials on days 34–36, the duration in target quadrant of hyperglycemic 3×Tg-AD mice was markedly less than that of normoglycemic 3×Tg-AD mice (17 s versus 26 s for both 2 h and 48 h trials, p = 0.009–0.002). The reduced time spent in the target quadrant of hyperglycemic 3×Tg-AD mice was significantly increased by NC009-1 treatment (from 17 s to 22–24 s, p = 0.017–0.006). Thus NC009-1 treatment increased the retrieval of spatial memory in hyperglycemic 3×Tg-AD mice.
Effects of NC009-1 on NeuN, Aβ and tau levels in STZ-treated 3×Tg-AD mice
In addition to cognitive function, we examined NeuN [37], Aβ and tau levels in 3×Tg-AD mice with or without STZ or NC009-1 treatment. Immunohistochemically, STZ treatment reduced NeuN level in dentate gyrus (DG, 91%, p = 0.024) and Cornu Ammonis areas 1 (CA1, 90%, p = 0.011) and 3 (CA3, 92%, p = 0.023) of the hippocampus of 3×Tg-AD mice (STZ group), whereas NC009-1 treatment could reduce this decrease to 95% (DG, p = 0.031), 96% (CA1, p = 0.043) and 97% (CA3, p = 0.015) (STZ/NC009-1 group) compared to the normoglycemic control (– STZ group, 100%) (Fig. 5A). In addition, STZ treatment increased Aβ level (intensity: 108–113%, p = 0.008–<0.001; area: 131–182%, p = 0.023–<0.001) in the hippocampus and cortex of 3×Tg-AD mice (STZ group), whereas NC009-1 treatment decreased the level of Aβ (intensity: 102%, p = 0.025–<0.001; area: 98–121%, p = 0.019–<0.001) (STZ/NC009-1 group) compared to the normoglycemic control (– STZ group, 100%) (Fig. 5B). Furthermore, STZ treatment increased tau level (intensity: 114–116%, p < 0.001; area: 187–206%, p < 0.001) in the hippocampus and cortex of 3×Tg-AD mice (STZ group), whereas NC009-1 treatment could decrease the level of tau (intensity: 106–109%, p = 0.012–<0.001; area: 115–156%, p = 0.003–<0.001) (STZ/NC009-1 group) compared to the normoglycemic control (– STZ group, 100%) (Fig. 5C). Our findings confirmed neuronal loss and abnormal elevation of Aβ and tau in the hippocampus and cortex of hyperglycemic 3×Tg-AD mice and NC009-1 treatment could rescue these pathologic features.
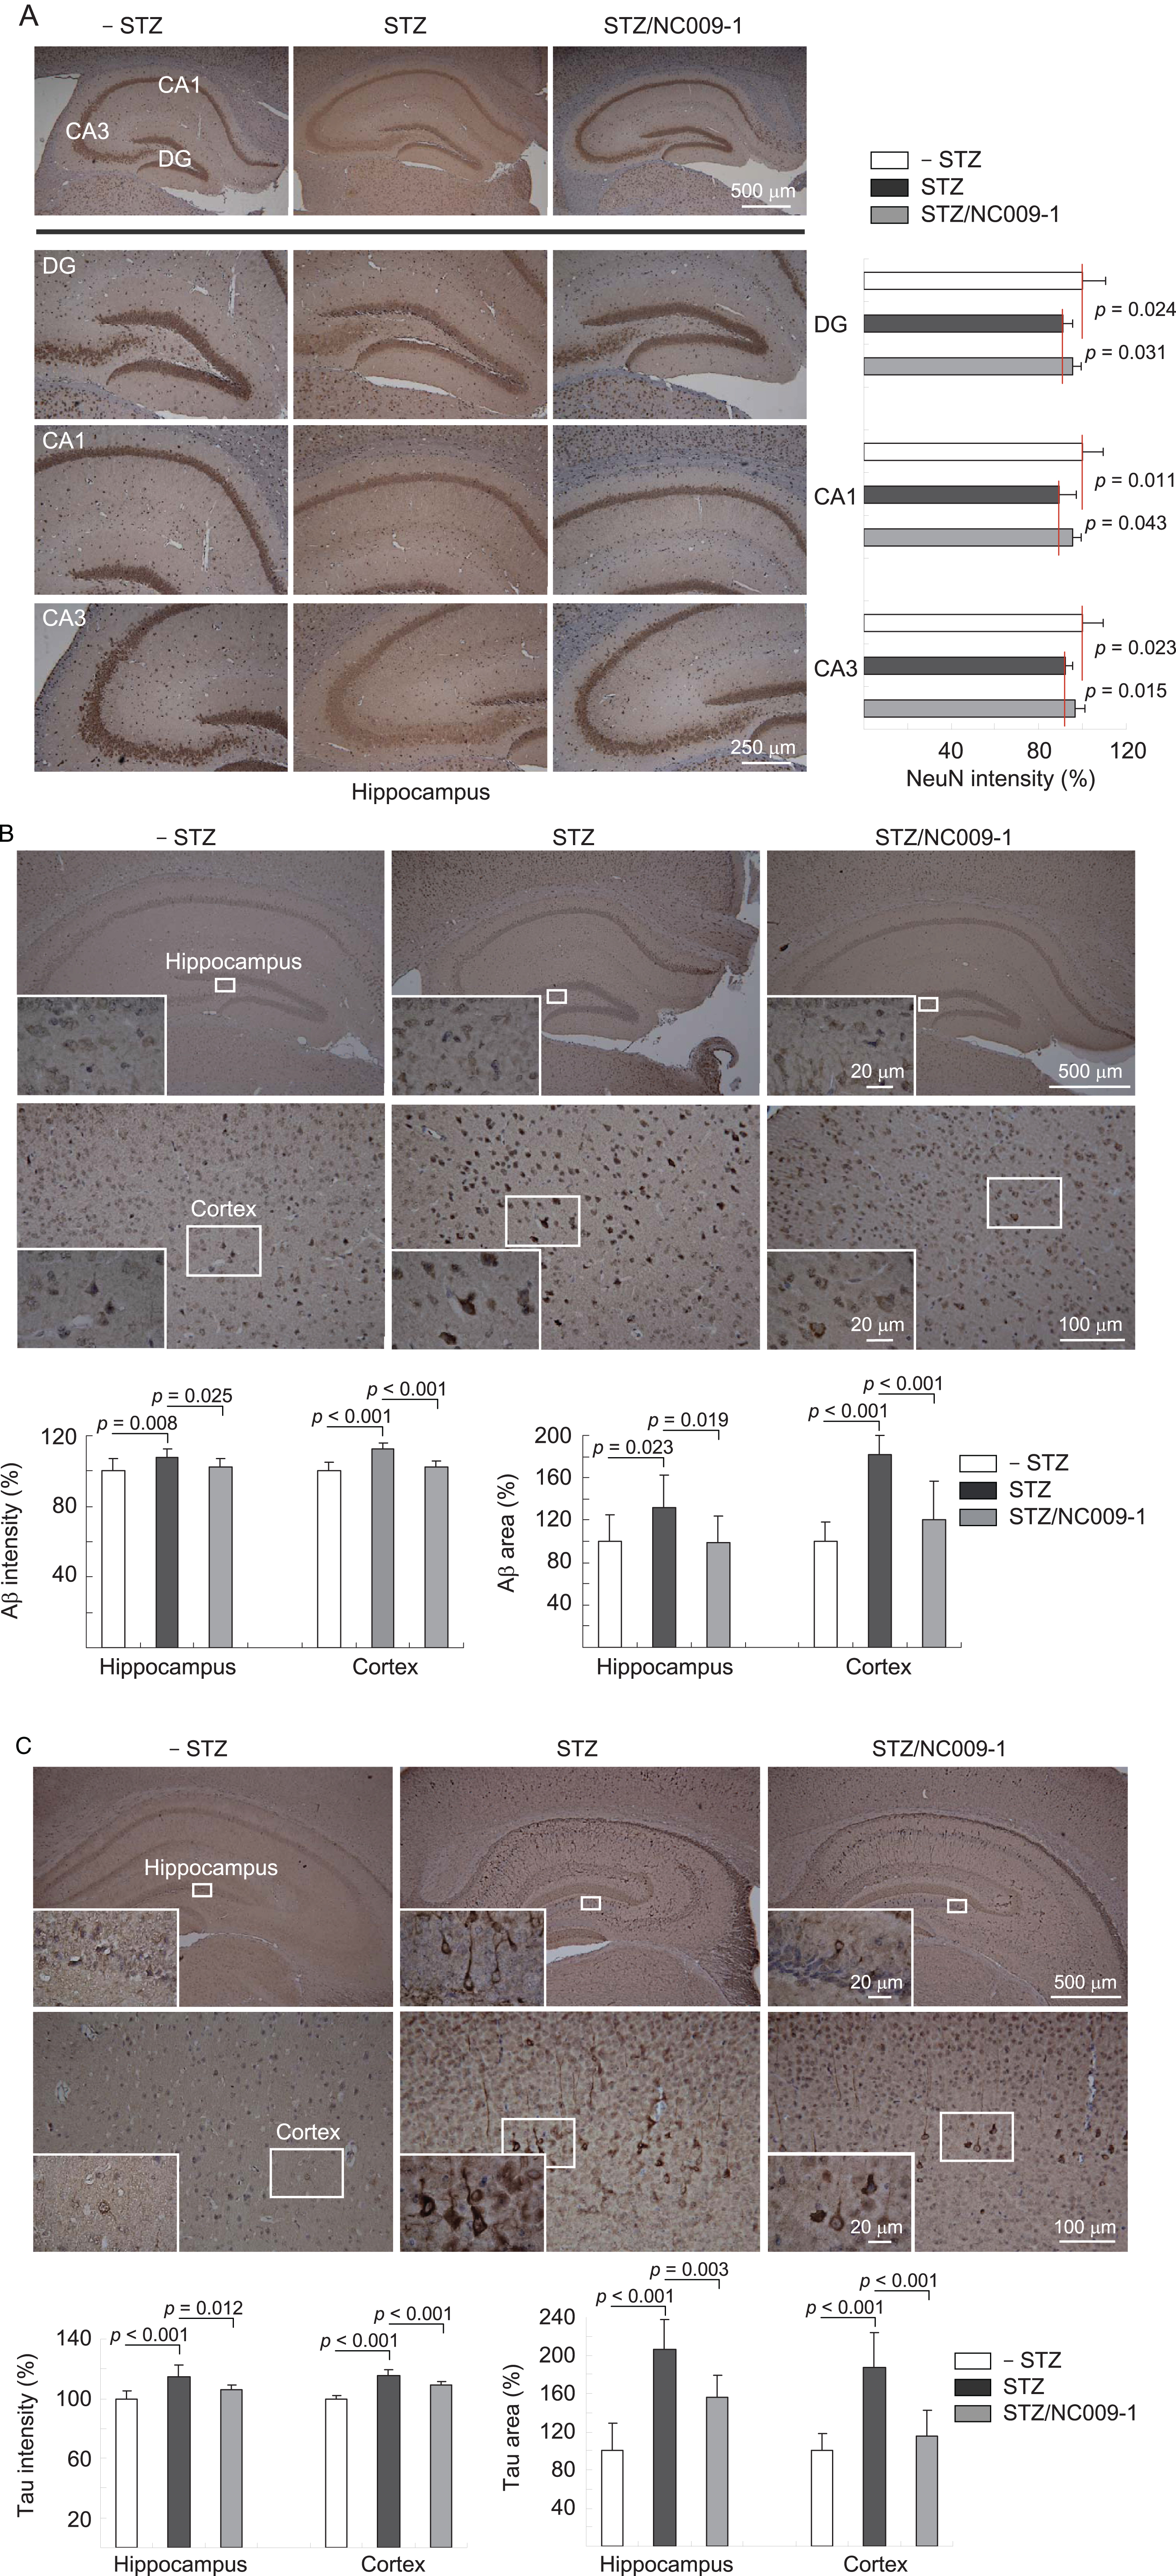
Indole compound NC009-1 increases NeuN and decreases Aβ and tau immunoreactivity in STZ-treated 3×Tg-AD mice. Mice in – STZ, STZ, and STZ/NC009-1 groups received vehicle, STZ, and STZ+NC009-1, respectively during the course of the experiment. A) Representative IHC images for NeuN and intensity quantification in the hippocampus of mice. DG, dentate gyrus; CA1 and CA3, Cornu Ammonis areas 1 and 3. B, C) Representative IHC images for Aβ and tau and intensity and area quantification in the hippocampus and cortex of mice and p values between STZ versus – STZ mice or STZ/NC009-1 versus STZ mice were compared.
Effects of NC009-1 on APOE and TRKA expression in STZ-treated 3×Tg-AD mice
Finally, we examined the effects of NC009-1 on alternations of APOE and TRKA levels in STZ-treated 3×Tg-AD mice (Fig. 6). STZ administration reduced APOE (65–51%, p = 0.006–0.003) and TRKA (71–69%, p = 0.012) levels in the hippocampus and cortex of 3×Tg-AD mice (STZ group), whereas NC009-1 treatment could reverse this reduction to 85–92% (APOE, p = 0.026–<0.001) or 95–106% (TRKA p = 0.024–0.001) (STZ/NC009-1 group) compared to the normoglycemic control (– STZ group, 100%). These results demonstrated the consistent alterations of APOE and TRKA in both AD animal model and patients. The normalization of downregulation of APOE and TRKA by NC009-1 further strengthened the potential of APOE and TRKA as molecular markers for treatment of AD.
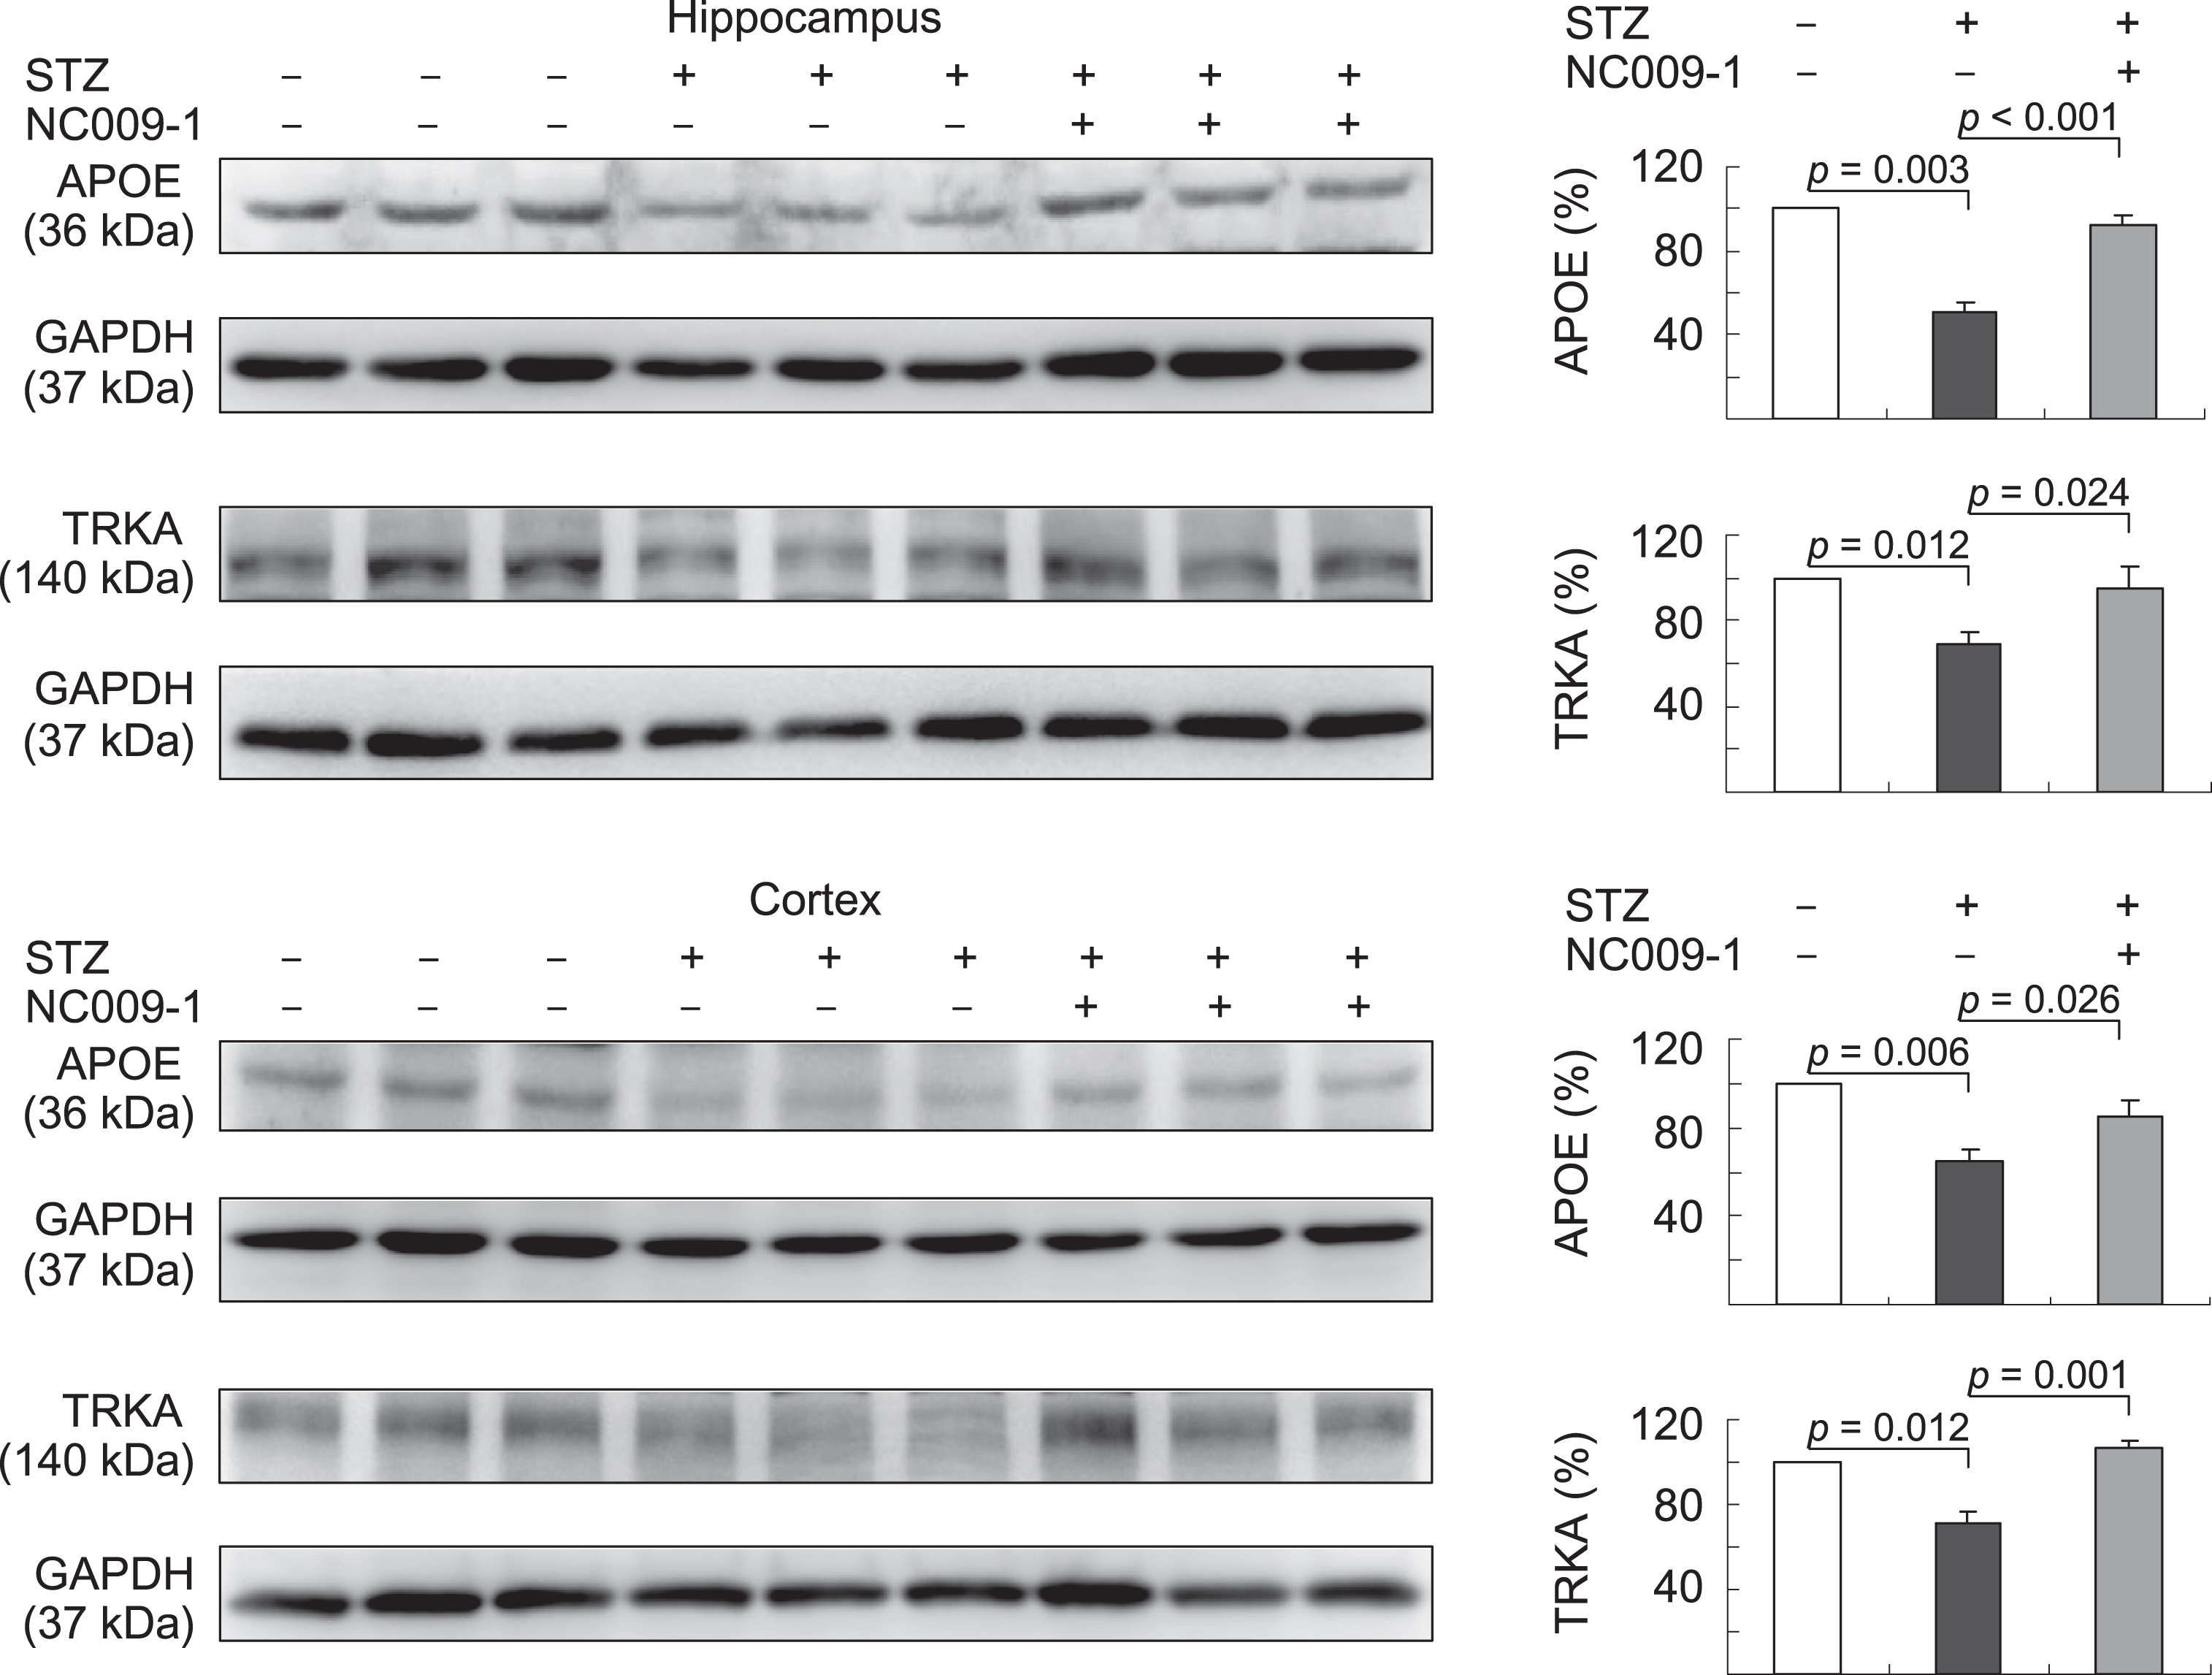
Indole compound NC009-1 augments APOE and TRKA expression in STZ-treated 3×Tg-AD mice. Expression levels of APOE and TRKA in hippocampus and cortex were analyzed by western blot using GAPDH as a loading control. To normalize, the relative APOE and TRKA of – STZ mice was set as 100% and p values between STZ versus – STZ mice or STZ/NC009-1 versus STZ mice were compared.
DISCUSSION
The application of biomarkers lies in the relevance of disease pathogenesis and treatment responses, as well as reproducibility in human samples. Here we found the downregulation of APOE and TRKA in Aβ-GFP SH-SY5Y neuron-like cells. These expression alterations were validated by peripheral leukocytes from AD patients. Upregulating APOE and TRKA expression by indole compound NC009-1 improved neurite outgrowth in differentiated SH-SY5Y cells expressing Aβ-GFP. Similar to cell model, treatment with NC009-1 improved memory deficits and hippocampal levels of APOE and TRKA in 3×Tg-AD mice. From the findings of SH-SY5Y cells, we speculate that the expression of APOE and TRKA could be presented in the neurons, which needs to be further characterized. These multi-discipline approaches consolidate the role of APOE and TRKA in the pathogenesis of AD, as well as potential biomarkers for disease diagnosis and therapeutic responses in AD subjects.
Human APOE is a glycoprotein highly expressed in the liver and brain. In the central nervous system, APOE is the principal cholesterol carrier protein and after binding to LDL receptor family members on neuronal cell surfaces, lipidated APOE facilitates synaptogenesis and modulates neurite outgrowth in an isoform specific manner [38, 39]. Through scaffolding the formation of HDL, APOE promotes the proteolytic degradation of soluble forms of Aβ [40, 41]. In addition, macrophages express and secrete APOE [42], and APOE-deficient macrophages markedly reduced the ability to degrade Aβ [43]. Therefore downregulation of APOE in peripheral leukocytes could be attributed to the impairment of Aβ clearance in AD patients. The expression of APOE is regulated by the peroxisome proliferator activated receptor gamma and liver X receptors [44]. Whether NC009-1 affecting APOE expression in the liver remains to be determined. It has been well-known that APOE ɛ4 allele increases the risk and reduces the onset age of AD [45]. In elder population, reduced APOE expression in brains increase risk of AD accompanied with pronounced Aβ deposition [40]. Consistent to these findings, our results demonstrated that APOE is downregulated in peripheral leukocytes of AD patients. Although our study and other meta-analysis [46] consistently demonstrate lower plasma level of APOE in AD patients, the incomplete correlation in APOE levels between peripheral leukocytes and plasma in the tested individuals (data not shown) suggests that the circulatory APOE is not solely contributed from the peripheral leukocytes. In addition, the results of stratification by APOE ɛ4 allele status further suggest that APOE ɛ4 allele has influence on APOE and TRKA expressions in leukocytes. As the ɛ4 carriers in AD may have approximate TRKA expression or higher APOE expression compared to non-ɛ4 normal control, APOE genotype should be taken into account if APOE and TRKA are considered as AD peripheral biomarker candidates in peripheral leukocytes. The reported no expressional change in peripheral APOE mRNA in Japanese AD and control subjects [28] and elevated APOE mRNA and protein expression in the hippocampus with cognitive decline [47] may be due to difference in study design, the sample size, gender, and adjustment for confounding factors to lead to the conflicting results.
TRKA encodes a member of the neurotrophic tyrosine kinase receptor (NTKR) family [48]. Binding of TRKA by nerve growth factor (NGF) modulates the metabolism of AβPP from amyloidogenic towards non-amyloidogenic processing and the loss of NGF/TRKA signaling could be linked to sporadic AD contributing to synaptic loss, Aβ deposition and tau abnormalities [49]. Significant reduction in TRKA level was noted in cortical regions of early-stage AD patients [50]. Scores on MMSE were also shown to be correlated with TRKA levels in the anterior cingulate, superior frontal, and superior temporal cortices [47]. Recently, Crispoltoni et al. reported increased TRKA expression in patients with mild cognitive impairment and mild AD but decreased TRKA expression in patients with severe AD on peripheral blood monocytes during disease progression [51]. Our results of downregulation of TRKA in peripheral leukocytes in AD add evidence to support the involvement of TRKA on monocytes during AD progression. Of interest, the peripheral leukocyte expressions of APOE and TRKA are even higher in APOE ɛ4 carriers in both AD patients and normal control patients (Table 3), suggesting that the expression alterations of these two biomarkers in AD patients are not regulated by APOE ɛ4 allele. In addition, whether subjects were APOE ɛ4 carriers or not, both APOE and TRKA were reduced in AD patients, supporting APOE and TRKA as peripheral leukocyte AD biomarkers.
To further explore the potential of APOE and TRKA as biomarkers for monitoring treatment responses in AD, we exposed our Aβ-GFP SH-SY5Y neuronal and 3×Tg-AD mouse models with indole compound NC009-1, and then examine the expression levels of APOE and TRKA in these models. By modulating the aromatic cores within amyloidogenic peptides, small aromatic molecules have demonstrated the potential to inhibit protein misfolding [52–54]. Indole compounds contain aromatic heterocyclic nuclei of indole with formula C8H7N which is present in a wide variety of biologically active compounds including Aβ and/or tau aggregation inhibitors [55–57]. By working as a chemical chaperone and/or a HSPB1 enhancing compound to reduce Aβ, tau, and polyQ misfolding, indole compound NC009-1 has demonstrated its potential to improve neurite outgrowth and neuronal viability in in vitro and ex vivo models for AD [19, 20] and in vitro and in vivo models for SCA17 [21]. Here we further demonstrated its potential to improve cognitive function in 3×Tg-AD mice. In addition to improve the downregulations of APOE and TRKA, NC009-1 could assist Aβ and tau folding directly or through enhancing HSPB1 expression in the hippocampus and cortex of 3×Tg-AD mice to help the cognitive improvement. These findings reinforce the potentials of APOE and TRKA as biomarkers to follow up therapeutic responses for AD.
According to the announcement by the Jackson Laboratory at February 2014 (https://www.jax.org/strain/004807), male 3×Tg-AD mice may not exhibit the phenotypic traits originally described by donating investigator. Of the 3×Tg-AD mice, the intraneuronal Aβ is firstly present within neurons at 3 weeks old [58], while extracellular aggregates are not observed until 12–14 months old [59]. In addition, many studies suggest that intraneuronal Aβ accumulation impairs axonal transport and synaptic transmission thereby playing a role in the cognitive impairment associated with AD [60, 61]. Furthermore, AD occurs as a result of complex interactions among genes and other risk factors [62]. Previous evidence has also suggested that impaired glucose metabolism in mild cognitive impairment is associated with increased progression to AD [63]. Furthermore, hyperglycemia has been shown to increase the prevalence of AD in APP/PS1 transgenic mice [64]. Therefore, hyperglycemia was used to accelerate the phenotypes of 3×Tg-AD mice in the study.
It is worth mentioning that the blood glucose in STZ/NC009-1 group from days 15–29 was maintained in a relative stable level (184–200 mg/dL), which reveals that NC009-1 did not reduce the blood glucose. On the other hand, without the administration of NC009-1, the blood glucose level in STZ group was increased during days 15–29 (220–294 mg/dL). The increased blood glucose level in STZ group could be further raised by the upregulated levels of Aβ and tau [65, 66]. Although the STZ/NC009-1 group was still hyperglycemic, the AKT activity upregulated by NC009-1 might play a role in the neuroprotection. The activated pAKT (S473) could inactivate GSK-3β by phosphorylation at S9, which further reduced the features of AD, including Aβ, tau, inflammation, and cognitive impairment [67, 68]. Therefore, 3×Tg-AD and STZ/NC009-1 group showed comparable behavior performance.
There are limitations in this study. Previous microarray analysis of peripheral leukocytes revealed a panel of biomarker candidates [29, 30], but did not detect expression alterations of APOE and TRKA. This discrepancy may be originated from small number of patients, disease severity, different technologies of screening, and individual biological status. Our RT2 Profiler PCR array screening platform may not cover enough gene candidates for AD biomarker as well. In addition, this study did not include patients with mild cognitive impairment without dementia, which otherwise may help illuminate the role of the markers for prediction of cognitive deteriorating process. Nevertheless, by multi-discipline approaches we clearly captured the novel peripheral biomarkers in AD, provide more potential avenues for investigating pathogenesis and therapeutic monitoring in future disease-modifying clinical trials such as antibody-based immunotherapy against Aβ [69]. Further validation in a larger series of patients will be of great importance to consolidate the potential applications of APOE and TRKA in AD researches.
In conclusion, APOE and TRKA mRNA/protein expression is lower in Aβ-GFP SH-SY5Y cells, AD subjects and hyperglycemic 3×Tg-AD mice. In-house indole compound NC009-1 upregulated the expression of APOE and TRKA to improve neurite outgrowth in Aβ cells and ameliorate cognitive deficits in AD mice. These results suggest the role of APOE and TRKA as potential peripheral biomarkers in AD, and offer a new drug development target of AD treatment.
Footnotes
ACKNOWLEDGMENTS
The authors thank the Molecular Imaging Core Facility of National Taiwan Normal University for the technical assistance. This work was supported by the grants 105-2325-B-003-001, 105-2325-B-003-003 and 106-2314-B-182-037-MY2 from the Ministry of Science and Technology, and CMRPG3E1502, CMRPG3G0962 and CMRPG3F1612 from Chang Gung Medical Foundation.