
Abstract
Background:
Alzheimer’s disease (AD) pathology and hypertension (HTN) are risk factors for development of white matter (WM) alterations and might be independently associated with these alterations in older adults.
Objective:
To evaluate the independent and synergistic effects of HTN and AD pathology on WM alterations.
Methods:
Clinical measures of cerebrovascular disease risk were collected from 62 participants in University of Kentucky Alzheimer’s Disease Center studies who also had cerebrospinal fluid (CSF) sampling and MRI brain scans. CSF Aβ1-42 levels were measured as a marker of AD, and fluid-attenuated inversion recovery imaging and diffusion tensor imaging were obtained to assess WM macro- and microstructural properties. Linear regression analyses were used to assess the relationships among WM alterations, cerebrovascular disease risk, and AD pathology. Voxelwise analyses were performed to examine spatial patterns of WM alteration associated with each pathology.
Results:
HTN and CSF Aβ1-42 levels were each associated with white matter hyperintensities (WMH). Also, CSF Aβ1-42 levels were associated with alterations in normal appearing white matter fractional anisotropy (NAWM-FA), whereas HTN was marginally associated with alterations in NAWM-FA. Linear regression analyses demonstrated significant main effects of HTN and CSF Aβ1-42 on WMH volume, but no significant HTN×CSF Aβ1-42 interaction. Furthermore, voxelwise analyses showed unique patterns of WM alteration associated with hypertension and CSF Aβ1-42.
Conclusion:
Associations of HTN and lower CSF Aβ1-42 with WM alteration were statistically and spatially distinct, suggesting independent rather than synergistic effects. Considering such spatial distributions may improve diagnostic accuracy to address each underlying pathology.
INTRODUCTION
Over 50% of individuals who develop dementia have mixed pathologies at autopsy [1–3]. The two most prevalent contributors to mixed pathology are Alzheimer’s disease (AD) and cerebrovascular disease (CVD), and intense efforts are being made to develop in vivo tests for early diagnosis [1, 3]. Antemortem identification of AD pathology has become easier since the development of in vivo markers of amyloid and tau using cerebrospinal fluid (CSF) or positron emission tomography (PET) scans [4–7]. Accurate identification and classification of CVD in vivo, however, remains challenging. Markers of CVD include areas of hyperintense signal in white matter (white matter hyperintensities, WMH) on T2-weighted MRI of the brain, and more recently, alterations in microstructural properties of white matter (WM) such as fractional anisotropy (FA) detected using diffusion tensor imaging (DTI) [8–10].
WMH also occur in the pre-dementia stage of familial AD, including in those with no appreciable CVD risks [11, 12]. It remains unclear whether these WM alterations should be attributed to AD, CVD, or both pathological processes. Further, it is unknown whether the effects of AD and CVD are independent or synergistic. The present study examined relationships between CSF amyloid-β (Aβ1-42) and CVD risk factors with both WMH volumes and FA values within regions of normal appearing WM. The central analysis of the study utilized multiple linear regression to determine whether AD pathology and CVD risk are independently or synergistically associated with WM alterations. An interaction term was used to explore potential synergistic effects, while main effects explored potential independent effects of AD pathology and CVD risk. Voxelwise analyses were then used to determine the spatial distribution of WMH changes associated with CSF Aβ1-42 levels and/or CVD risk factors.
METHODS
Participants
Participants enrolled in the University of Kentucky Alzheimer’s Disease Center (UK-ADC) cohort and affiliated clinical trials were included in the present study. All studies used identical imaging and CSF collection protocols, and all research protocols were approved by the University of Kentucky Institutional Review Board. All participants gave written informed consent.
Inclusion criteria for the current study included a classification of cognitively normal (CN) or mild cognitive impairment (MCI), which was based on Clinical Dementia Rating (CDR) [13] global scores: CN (CDR = 0) and MCI (CDR = 0.5). Additionally, all participants were required to have MRI data that met quality control standards for motion and artifacts, available CSF Aβ1-42 data, and clinical data regarding current or previous diagnosis of hypertension (HTN: 1 = yes, 0 = no), hyperlipidemia (HLD: 1 = yes, 0 = no), and diabetes mellitus (DM: 1 = yes, 0 = no). In addition, data on antihypertensive medication use, history of cardiovascular disease, atrial fibrillation, cigarette smoking, blood pressure, and lipid levels were used to calculate a modified Framingham 10-year Stroke Risk Score (mFRS) for each participant (FRS was modified because data on left ventricular hypertrophy were not available) [14].
MRI protocol and analysis
Data were collected on a Siemens 3 Tesla TIM TRIO scanner using a 32-channel head coil at the University of Kentucky Magnetic Resonance Imaging and Spectroscopy Center. Two high-resolution 3D T1-weighted images were obtained using a magnetization-prepared rapid acquisition gradient echo (MP-RAGE) sequence [repetition time (TR) = 2530 ms, inversion time (TI) = 1100 ms, echo time (TE) = 2.56 ms, Flip angle = 7 degrees, 1 mm isotropic voxels]. Fluid-attenuated inversion recovery (FLAIR) images were acquired using a 3D sequence [TR = 6000 ms, TI = 2200 ms, TE = 338 ms, 1 mm isotropic voxels]. DTI used an axial, double-refocused spin-echo, echo planar imaging sequence [TR = 8000 ms, TE = 96 ms, FOV = 224 mm2, 52 contiguous slices, 2 mm isotropic voxels] with 60 non-collinear encoding directions (b = 1000 s/mm2) and 8 images without diffusion weighting (b0, b = 0 s/mm2).
FLAIR sequence analysis and WMH mask generation
FLAIR image processing was performed using a previously described protocol [15]. Briefly, MP-RAGE and FLAIR images were radiofrequency inhomogeneity-corrected using the N3-correction algorithm provided in MIPAV (http://mipav.cit.nih.gov). The two MP-RAGE images were registered to each other using SPM12 (http://www.fil.ion.ucl.ac.uk/spm/software/spm12) and then averaged. The averaged MP-RAGE image was then registered to FLAIR image using SPM12. Next, the FSL (v5.0.9) brain extraction tool [16] was used to remove non-brain tissue from the average MP-RAGE image to create a binary mask of brain tissue. This mask was then applied to the FLAIR image to remove non-brain tissue. Multimodal segmentation was performed with SPM12 using the average MP-RAGE and FLAIR image. The brain was segmented into gray matter, two separate white matter segments, CSF, and other tissues segments using a previously validated segmentation method [17]. The two WM segments were combined to form a single WM mask, which was dilated and then multiplied with the FLAIR image to form a FLAIR WM mask. Matlab 2015b was then used to determine the mean and standard deviation (SD) of the FLAIR WM in each participant by fitting a Gaussian model curve to the histogram of WM voxels intensity. The FLAIR WM images were then thresholded at 3 SDs above each participant’s mean value to identify areas of WMH in that participant. The resulting WMH mask were then manually edited to remove artifacts around the interventricular septum and inferior slices [17]. The summed volume of remaining voxels in each participant was used as a measure of WMH volume.
DTI sequence analysis
The goal of the DTI analyses was to compute mean FA values within regions of normal-appearing WM (NAWM) in each participant’s FLAIR image. DTI image processing was performed using a previously described protocol [18]. Briefly, FSL (v5.0.9) was used to perform pre-processing for motion and eddy-current correction with outlier detection and replacement [19, 20]. Following brain extraction, the FMRIB Diffusion Toolbox (FDT v3.0) was used to fit a voxelwise diffusion tensor model, determine the eigenvalues, and calculate FA [21]. FA images were registered into FMRIB FA 1 mm space, averaged to form a mean FA image to then generate a common WM skeleton, and finally project each participants FA image onto the group skeleton using tract-based spatial statistics (TBSS) [21].
The same registration parameters were then used to project the FA image to standard (MNI152 T1 1 mm3) space. The common track skeleton was used together with the WMH images in the TBSS non-FA pipeline [21]. These WMH images were then subtracted from the TBSS skeleton in order to create a NAWM image for each participant that comprised only WM outside of WMH. The mean global FA was then extracted from each participant’s NAWM image using fslstats FSL statistical tool.
Cerebral microbleed analysis
Measures of cerebral microbleeds (CMBs) were collected from 62 participants who had CSF sampling. Gradient recalled echo (GRE) MRI sequence was obtained to assess CMBs. CMBs were visually rated using Microbleeds Anatomical Rating Scale (MARS) [22].
CSF collection and analysis
CSF collection and analysis was performed as previously described [23]. In brief, participants underwent lumbar puncture the same day as MRI scanning. CSF was collected in the morning after fasting since midnight and stored in a –80°C freezer prior to shipment on dry ice to the Alzheimer’s Disease Neuroimaging Initiative (ADNI) Biomarker Core laboratory at the University of Pennsylvania Medical Center. CSF levels of Aβ1-42 were measured using the multiplex xMAP Luminex Platform (Luminex Corp, Austin, TX) with Innogenetics (INNO-BIA, AlzBio3; Ghent, Belgium) immunoassay kit as previously described [24].
Statistical analyses
Independent samples t-tests and chi-square tests were used to assess differences between CN and MCI groups in demographic and clinical measures, CSF Aβ1-42, and measures of WM alteration. Bivariate relationships between CSF Aβ1-42, mFRS, HTN status, HLD status, DM status, smoking status, and quantitative measures of WMH volume and DTI-based FA measures were investigated using partial correlations controlling for age and sex.
As HTN was the only CVD risk factors associated with WMH volume, HTN was used as a marker of CVD risk in further analyses. Next, separate linear regression models were used to explore the association of HTN and CSF Aβ1-42 with WMH volume and NAWM-FA. Each model included main effects of HTN and CSF Aβ1-42, a HTN×CSF Aβ1-42 interaction, and age, sex, and cognitive status as covariates. The interaction term was included to explore any synergistic effects of HTN and CSF Aβ1-42 on WM alterations. If the interaction term was not significant, it was removed from the model and the model was refit to the data in order to explore the independent effects of HTN and CSF Aβ1-42. Finally, the above models were repeated with the mFRS included as additional covariate.
In order to assess potential contributions from cerebral amyloid angiopathy (CAA), bivariate relationships of CSF Aβ1-42 with CMBs in the frontal, parietal, temporal, occipital lobes and the basal ganglia were investigated using partial correlations controlling for age and sex. Next, linear regression was performed to explore whether WMH and significant CMBs predicted CSF Aβ1-42 independently after controlling for age, sex, and cognitive status. SPSS 23 (IBM, Chicago, IL) was used for all statistical analyses, and significance was set at 0.05.
Voxelwise regression analysis
FSL’s Randomise tool was used to perform exploratory voxelwise regression analyses to examine the spatial location of WM alteration associated with CSF Aβ1-42 and HTN. CSF Aβ1-42 (measured in pg/ml) was treated as a continuous variable, whereas the clinical diagnosis of HTN, systolic BP >139, or diastolic BP >89 were used as criteria indicating presence of HTN. Each analysis included either CSF Aβ1-42 or HTN as the predictor of interest and age, sex, and education as covariates. These models were then used to identify voxels where the presence of WMH were associated with CSF Aβ1-42 or HTN. Correction for multiple comparisons across all voxels was performed using the false-discovery rate (FDR) tool provided with FSL (https://fsl.fmrib.ox.ac.uk/fsl/fslwiki/FDR), which uses the distribution of p-values from every voxel in order to determine an appropriate threshold to reduce false-positives [25]. Results were then compared to the ICBM-DTI-81 WM labels atlas to identify the tracts that included significant voxels.
RESULTS
A total of 62 participants met all criteria for inclusion, including 26 CN (CDR = 0) and 36 MCI (CDR = 0.5). Demographic and clinical features of the participants are presented in Table 1. The MCI group had higher percentages of participants with HTN and HLD than the CN group (p < 0.001). In addition, CSF Aβ1-42 was significantly lower in the MCI group than the CN group (p = 0.005). There was no difference between CN and MCI groups in other clinical measures or in measures of WM alterations. Results of bivariate partial correlations controlling for age, sex, and cognitive status are shown in Table 2. The mFRS, HLD, and DM were not associated with either WMH volume or FA in NAWM. HTN and lower CSF Aβ1-42 (which is associated with higher amyloid plaque burden), however, were both correlated with higher WMH volume (r = 0.30, df = 57, p = 0.021 and r = –0.30, df = 57, p = 0.021, respectively). CSF Aβ1-42 but not HTN was associated with lower FA in NAWM (r = 0.40, df = 57, p = 0.002 and r = –0.23, df = 57, p = 0.08, respectively).
Demographics, clinical, imaging, and laboratory characteristics of the study cohort
CN, cognitively normal; MCI, mild cognitive impairment; mFRS, modified Framingham stroke risk score; SBP, systolic blood pressure; DBP, diastolic blood pressure; HLD, hyperlipidemia; NAWM-FA, fractional anisotropy values of the normally appearing white matter; Aβ1-42, cerebrospinal fluid amyloid-beta 1–42 levels; WMH, white matter hyperintensities. ‡Pearson Chi-square; ¥T test (2 sided).
Partial Correlation of hypertension, CSF amyloid β1-42 levels and imaging measures of micro and macrostructural white matter alteration in study subjects
Values are partial correlation coefficients adjusted for age, gender and cognitive status; HTN, hypertension; Aβ1-42, Cerebrospinal fluid amyloid beta 1–42 levels; HLD, hyperlipidemia; DM, diabetes mellitus; mFRS, modified Framingham stroke risk score; WMH, white matter hyperintensity; NAWM-FA, fractional anisotropy values of the normally appearing white matter. *p≤0.05; **p≤0.01; ‡p≤0.001.
Results of linear regression analysis examining the effects of CSF Aβ1-42, HTN, the CSF Aβ1-42×HTN interaction on WMH volume, controlling for age, sex, and cognitive status are shown in Table 3 (Model 1). Results after removing the non-significant interaction term are also shown (Model 2). Models 1 and 2 were repeated with the inclusion of mFRS as an additional covariate (Table 3; Models 3 and 4, respectively). Results of linear regression analysis examining the effects of CSF Aβ1-42, HTN, the CSF Aβ1-42×HTN interaction on NAWM-FA controlling for age, sex, and cognitive status are shown in Table 4 (Model 1). Results after removing the non-significant interaction term are also shown (Model 2). Models 1 and 2 were repeated with the inclusion of mFRS as an additional covariate (Table 4; Models 3 and 4, respectively).
Linear regression models to examine the effects of hypertension and cerebrospinal fluid amyloid beta 1–42 levels on white matter hyperintensity burden
Linear regression models using white matter hyperintensity (WMH) volume as the dependent variable. Values shown are standardized β-coefficients with p-values in parentheses. Predictors of interest were CSF levels of Aβ1-42, HTN, and Aβ1-42×HTN interaction (Models 1, 3). The analyses were repeated without the non-significant interaction term (Models 2, 4). aCovariates included in models 1 & 2 were age, sex, and cognitive status. bCovariates included in models 3 & 4 were age, sex, cognitive status, and mFRS.
Linear regression models to examine the effects of hypertension and cerebrospinal fluid amyloid beta 1–42 levels on white matter microstructural alterations
Linear regression models using the fractional anisotropy values of the normally appearing white matter (NAWM-FA) as the dependent variable. Values shown are standardized β-coefficients with p-values in parentheses. Predictors of interest were CSF levels of Aβ1-42, HTN, and Aβ1-42×HTN interaction (Models 1, 3). The analyses were repeated without the non-significant interaction term (Models 2, 4). aCovariates included in models 1 & 2 were age, gender, and cognitive status. bCovariates included in models 3 & 4 were age, gender, cognitive status, and mFRS.
Results from the voxelwise regression analyses demonstrated both HTN and CSF Aβ1-42 were primarily associated with WMH in different areas, with 95% of HTN-related WMH voxels and 90% of CSF Aβ1-42 -related WMH voxels being unique (i.e., non-overlapping) (Fig. 1). WMH associated with HTN were primarily located in the right inferior fronto-occipital fasciculus, right superior longitudinal fasciculus, and bilateral periventricular WM along the body of the lateral ventricles. In contrast, WMH associated with CSF Aβ1-42 were primarily located at the posterior corona radiata bilaterally and periventricular regions near the anterior horns of the lateral ventricles. The primary area of overlap was in the posterior portion of the right cingulum (Fig. 1).
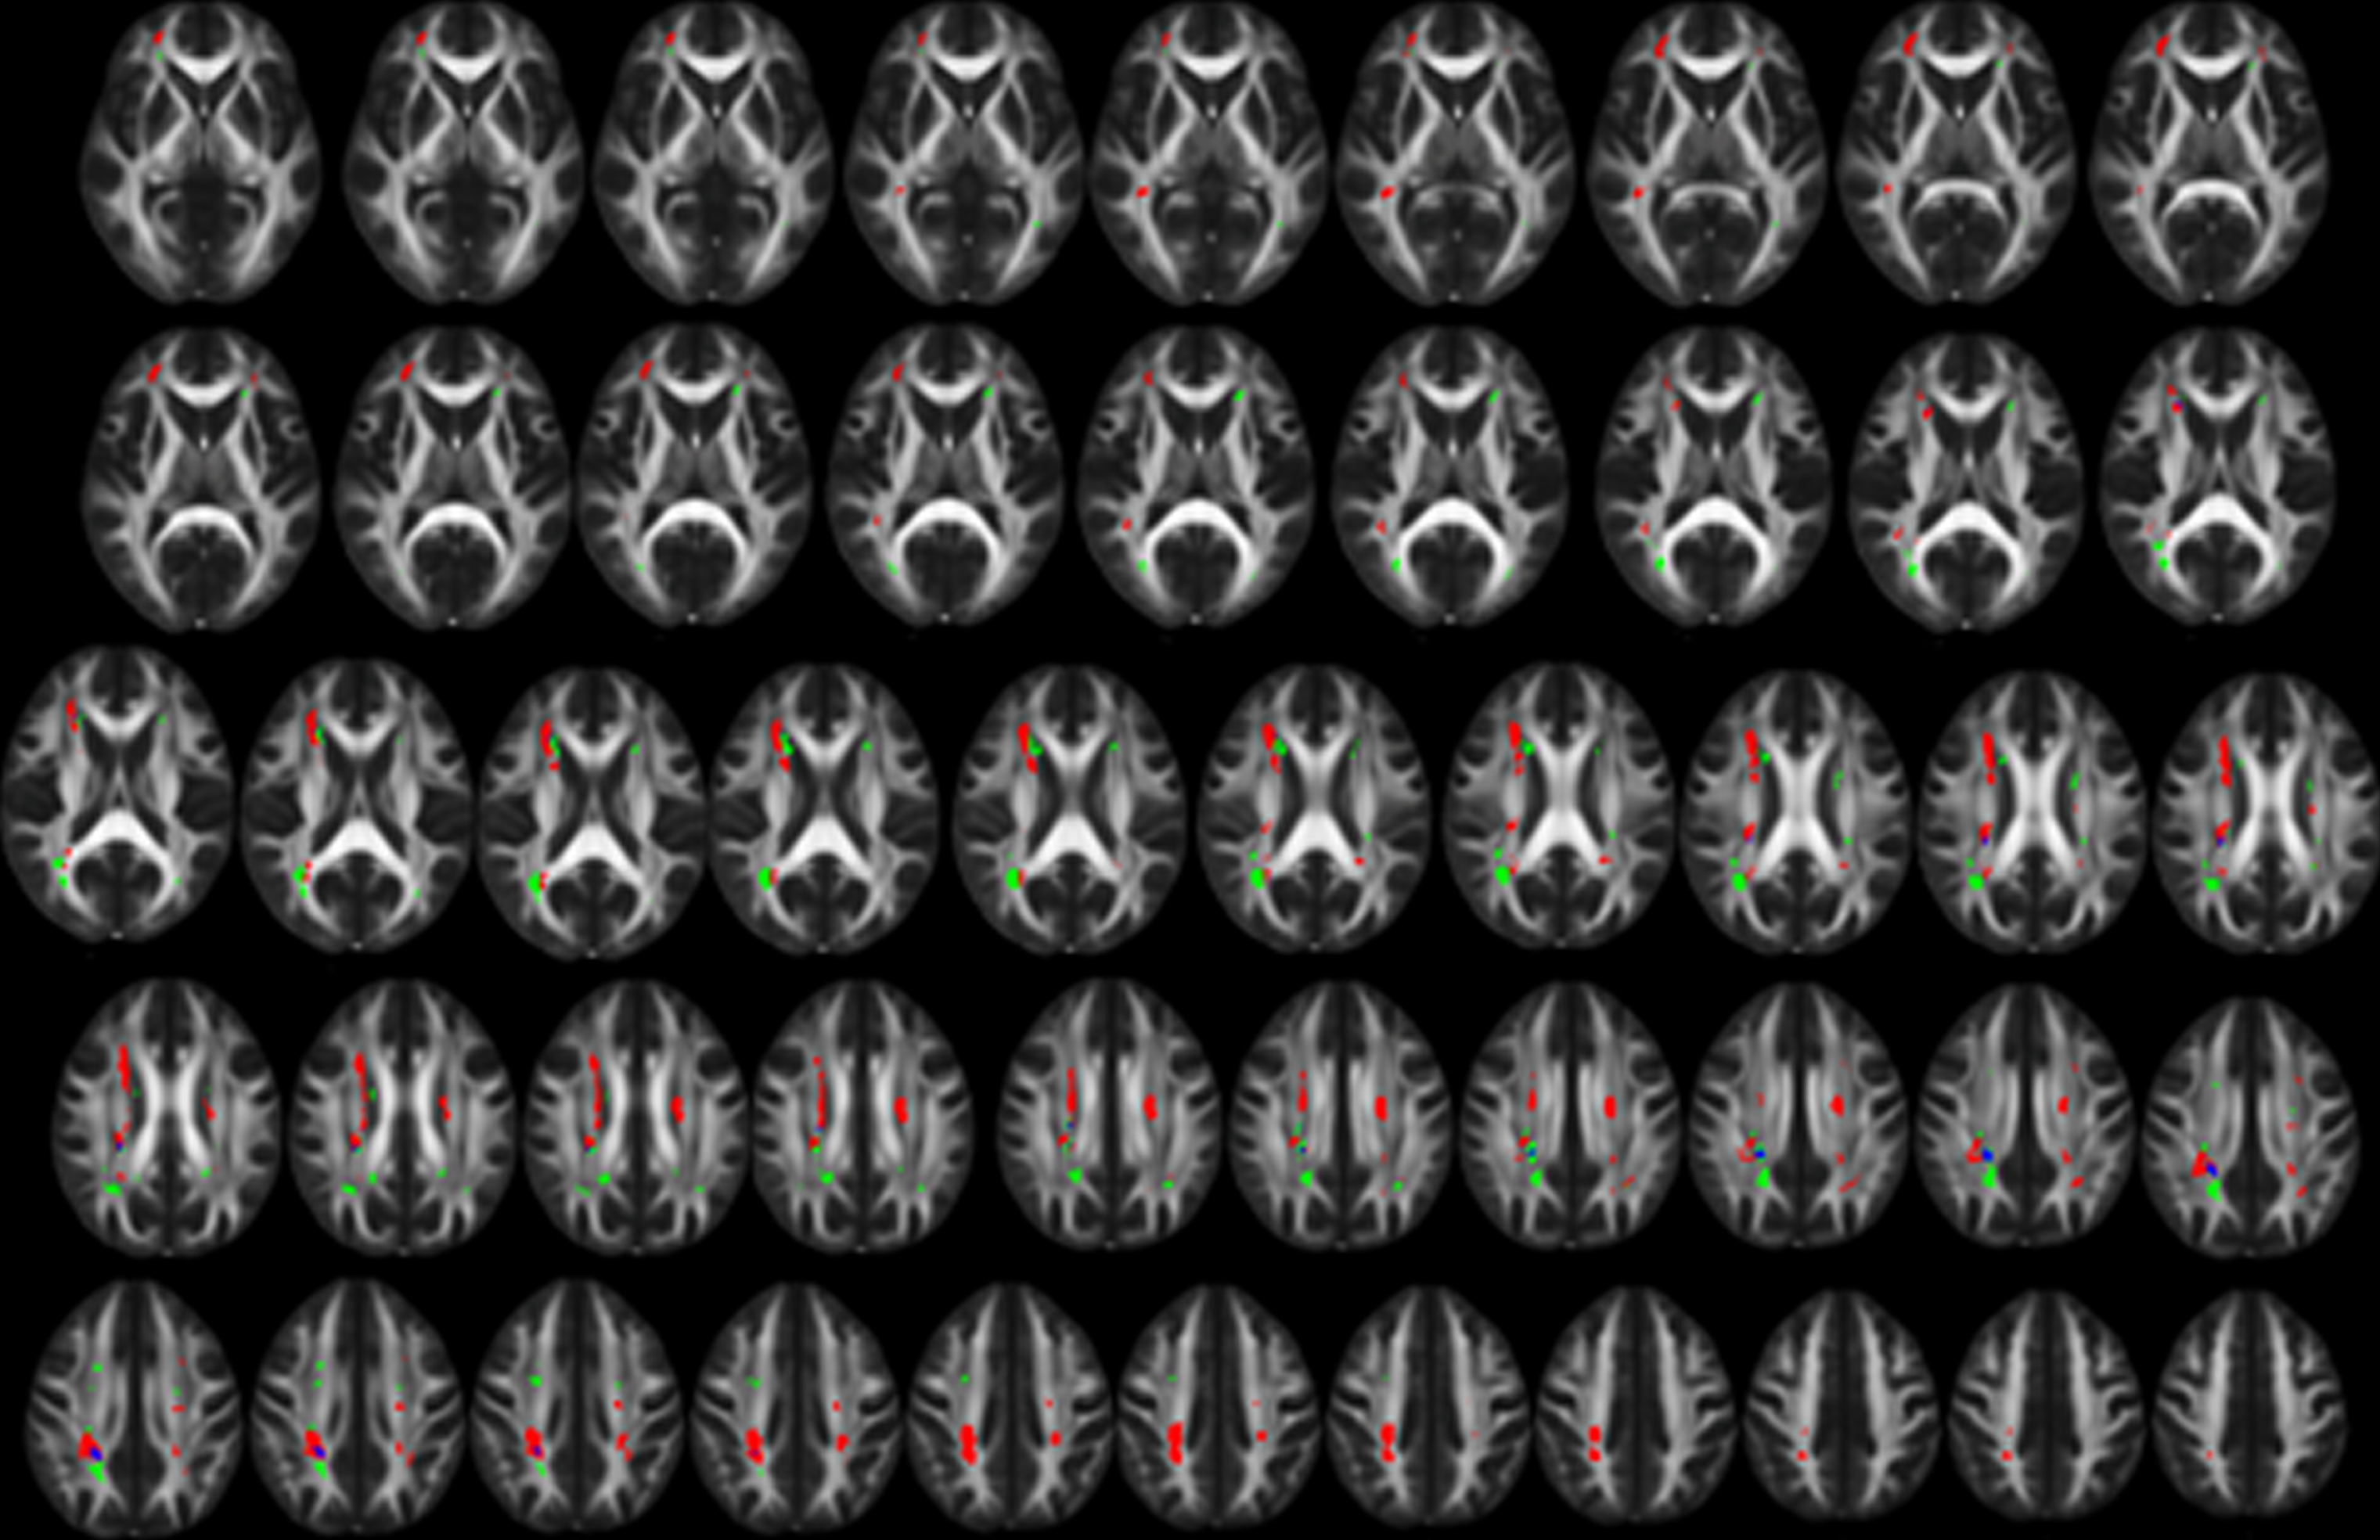
Distinct spatial distribution of white matter hyperintensities related to hypertension and CSF amyloid-β1- 42 levels. The spatial distribution of white matter hyperintensities (WMH) related to hypertension (HTN) (red) and CSF amyloid-β 1–42 levels (Aβ1-42) (green) shows primarily distinct distributions with minimal overlapping areas (blue). WMH associated with HTN occur primarily in deep cortical white matter and along the body of the lateral ventricles. WMH associated with Aβ1-42 occur primarily near the ventricular horns and the posterior corona radiata. Areas of WMH are displayed on the FMRIB58 FA 1mm3 brain. Contiguous 1 mm slices are shown starting from MNI z = 0 at the top left and MNI z = 48 at the bottom right. All images are shown in radiological orientation (anatomical right is on the left side of the image).
In order to assess the impact of CMBs on the relationships observed between CSF Aβ1-42 and WM alterations, partial correlations were performed to examine the relationships of Aβ1-42 with basal ganglia and lobar CMBs (in frontal, parietal, temporal, and occipital lobes separately). Results of the analyses demonstrated that Aβ1-42 was associated with parietal CMBs (r = –0.28, p = 0.037) but not with any other CMBs (p > 0.05). A linear regression analysis was then performed to examine whether parietal CMBs and WMH independently predicted CSF Aβ1-42. Results demonstrated that Aβ1-42 was significantly predicted by WMH volume (β=–0.32, p = .025) and only marginally predicted by parietal CMBs (β=–0.25, p = 0.06) while controlling for age, sex, and cognitive status.
DISCUSSION
Results from this study demonstrate that CSF levels of Aβ1-42 and HTN are each associated with WM damage, manifesting as both overt areas of WMH and microstructural alterations in NAWM. Importantly, these processes appear to independently contribute to WM changes and affect spatially distinct areas of WM. These data demonstrate that pathologies underlying or caused by CSF Aβ1-42 and HTN exert additive rather than synergistic effects on WM alteration. Our work also raises the question of whether the nature of white matter alteration associated with HTN is the same as that associated with CSF Aβ1-42. Since the spatial distributions of WM changes were distinguishable (HTN versus CSF Aβ1-42), equivalent underlying mechanisms should not be assumed, despite some similarities in their appearances on MRI. Assuming that both types of WM alteration are deleterious, it follows that treatment of mixed disease states may require interventions aimed at both processes to achieve maximal clinical efficacy.
Initial analyses sought to determine whether CVD risk factors and/or CSF Aβ1-42 levels were associated with WM alteration as assessed by overt WMH or subtler microstructural changes within NAWM that are not detectable at the macrostructural level. The modified Framingham CVD risk score was not associated with either marker of WM alteration. Previous studies examining the relationship between the mFRS and WM alterations have been equivocal with one study finding a relationship [26] and another failing to find such a relationship in older adults [27]. These discordant findings may be due to differences in the cohorts, including clinical, environmental, and cultural characteristics. In addition, the Framingham CVD risk score is intended to predict future CVD, which may account for the lack of cross-sectional relationship between mFRS and WM alterations. Of note, a recent study failed to find a relationship between mFRS and WM but did find that mFRS predicted future cognitive decline [27].
HTN was associated with both WMH volume and FA in NAWM, which is consistent with previous reports [28, 29]. The potential mechanisms underlying the association between HTN and WM alteration are unclear, but several explanations have been proposed. It is possible that that reduced cerebral blood flow could contribute to transient ischemic injury or that HTN-induced endothelial damage could result in extravasation of blood products into WM tissue resulting in injury [30–32]. WMH may represent areas of reduced vascular integrity, [33] whereas alteration in NAWM may include decreased myelin organization, lower axonal coherence, or decrease in axonal numbers otherwise related to reduced vascular integrity [34].
Lower CSF Aβ1-42 levels were also associated with both higher WMH volume and lower FA in NAWM. These findings are consistent with previous studies, which found that WMH volume is higher [11, 12] and FA is lower [35, 36] in AD brain compared to healthy controls. The exact mechanism underlying these relationships also remains unclear, but several possibilities exist. First, we noted that soluble Aβ1-42 oligomers were present in WM and were associated with loss of axons as well as breakdown in myelin content [37, 38]. Further, soluble Aβ1-42 is toxic to oligodendrocytes and inhibits formation of new myelin sheaths in vitro. It is also possible that Aβ1-42 may indirectly influence WM through increased inflammation, [41] decreased cerebral blood flow secondary to a hypocholinergic state, [42] or damage to blood vessels secondary to cerebral amyloid angiopathy [12, 43].
The most important finding of the present study is that a history of HTN and CSF Aβ1-42 levels are independently associated with WM alterations and have additive effects. Of note, AD and HTN often coexist in older adults [44]. However, linear regression analyses demonstrated that there was no significant interaction between CSF Aβ1-42 levels and HTN on WM changes. Further, the main effect of CSF Aβ1-42 and HTN were both significant when assessed simultaneously, indicating that these measures constitute independent predictors of WM changes. Several studies suggest that Aβ amyloidosis and HTN are independent predictors of cognitive outcomes, [45, 46] but this is the first evidence that CSF Aβ1-42 levels and HTN are independently associated with WM alterations in older adults. These findings suggest that WM alterations could be viewed as the sum of effects from both AD and CVD pathology, rather than thought of as either AD or CVD modifying the effect of the other on WMH burden. This has important implications for therapeutic interventions, since treating one pathology will only address WM alteration from that disease mechanism but may have no significant impact on WM changes related to the other condition.
After identifying statistically independent relationships of CSF Aβ1-42 levels and HTN with WM alteration, we sought to determine if this independence was due to spatially distinct patterns of WM alteration associated with each pathology. We found minimal overlap between areas of WM alterations associated with CSF Aβ1-42 and HTN; 95% of HTN-associated WMH and 90% of Aβ-associated WMH were unique. Consistent with previous studies in familial AD, CSF Aβ1-42 was primarily associated with WM alteration in posterior regions [11, 43]. Although much of the evidence for the relationship between Aβ1-42 and posterior WM alteration comes from studies of dominantly-inherited AD, the present study provides support for a similar relationship in sporadic late-onset AD. In contrast to Aβ1-42-associated WM alterations, HTN-associated WM change was primarily observed in deep WM. Many of these areas are near watershed regions between the middle cerebral artery and posterior cerebral artery distributions. These findings are consistent with previous studies that found CVD risk is associated with greater WM alteration in the watershed regions and deep WM [30, 31].
An important possibility that must be considered is that the association between the Aβ1-42 and WM alterations in these posterior regions is mediated by CAA, which has a predilection for parietal-occipital cortex [47]. In our study, we found a relationship between CSF Aβ1-42 and CMBs in the parietal lobe, which is consistent with extensive previous work [48, 49]. However, regression analyses demonstrated that these amyloid-associated CMBs did not account for the significant relationship between amyloid and WMHs. These results suggest that CAA is likely one of multiple mechanisms that contribute to WM alterations associated with increasing amyloid in the brain.
There are several limitations to the present study. The cross-sectional design allowed for measurement of correlations among HTN, CSF Aβ1-42 levels and WMH/FA in NAWM, but we did not assess the temporal sequence of these changes, precluding causal inferences. In addition, the sample size may have led to insufficient power to detect small effects. Further, cardiovascular risk measures were assessed using dichotomous variables (either present or absent) and did not account for medication control or adherence, disease duration, and/or severity. This may mask potential relationships that exist between these cardiovascular risk measures and WM alterations. Additionally, our sample included only those without dementia. It is unclear whether these relationships are present in individuals with severe disease(s). Also, the present study did not examine relationships with cognition. Despite independent effects on WM, CVD risk, and AD pathology may have a different relationship with cognition as demonstrated by a recent study reporting synergistic effects of CVD risk and AD pathology on cognitive decline [26]. Finally, amyloid PET scans were not collected as part of this study. Previous work has demonstrated spatial overlap between CAA and PET amyloid binding [51, 52]. Therefore, future studies should seek to include PET imaging to examine whether these areas of WM alteration found in the present study share overlap with these same regions of increased amyloid-PET binding in CAA.
In conclusion, the present study demonstrates that the effects of HTN and CSF Aβ1-42 levels on WM alteration may be additive rather than synergistic, with each associated with distinct spatial distributions of WM alteration. Considering such spatial distributions may improve diagnostic accuracy and optimal development of treatment paradigms that address CVD and AD, either separately or in combination. It is unclear whether the underlying pathophysiology and injurious mechanisms of these alterations are the same in the different brain regions. Further studies are needed to explore whether these distinct spatial patterns of WM alteration are associated with different cognitive processes and/or clinical outcomes.