
Abstract
Background:
Exercise training has been associated with greater cerebral blood flow (CBF) in cognitively normal older adults (CN). Alterations in CBF, including compensatory perfusion in the prefrontal cortex, may facilitate changes to the brain’s neural infrastructure.
Objective:
To examine the effects of a 12-week aerobic exercise intervention on resting CBF and cognition in CN and those with mild cognitive impairment (MCI). We hypothesized individuals with MCI (versus CN) would exhibit greater whole brain CBF at baseline and that exercise would mitigate these differences. We also expected CBF changes to parallel cognitive improvements.
Methods:
Before and after a 12-week exercise intervention, 18 CN and 17 MCI participants (aged 61–88) underwent aerobic fitness testing, neuropsychological assessment, and an MRI scan. Perfusion-weighted images were collected using a GE 3T MR system. Repeated measures analyses of covariance were used to test within- and between-group differences over time, followed by post-hoc analyses to examine links between CBF changes and cognitive improvement.
Results:
At baseline, individuals with MCI (versus CN) exhibited significantly elevated perfusion in the left insula. Twelve weeks of aerobic exercise reversed this discrepancy. Additionally, exercise improved working memory (measured by the Rey Auditory Verbal Learning Test) and verbal fluency (measured by the Controlled Oral Word Association Test) and differentially altered CBF depending on cognitive status. Among those with MCI, decreased CBF in the left insula and anterior cingulate cortex was associated with improved verbal fluency.
Conclusions:
Exercise training alters CBF and improves cognitive performance in older adults with and without cognitive impairment. Future studies must evaluate the mediating effects of CBF on the association between exercise training and cognition.
Keywords
INTRODUCTION
Mild cognitive impairment (MCI), a condition involving subtle, yet noticeable, deficits in memory and thinking abilities, affects 15% to 20% of older Americans [1–3] and precedes the onset of dementia. Although the cause of MCI remains uncertain, emerging evidence suggests that vascular pathology and perfusion abnormalities play central roles in the pathophysiology of Alzheimer’s disease (AD) [4–6]. Vascular risk factors such as hypertension, hypercholesterolemia, and diabetes often occur early in AD progression, damaging the neurovascular unit and disrupting oxygen delivery/exchange [5, 8]. Altered perfusion rates and hypoxemia facilitate the aggregation of neurotoxic substances such as amyloid-β (Aβ) and tau-containing neurofibrillary tangles (NFT) [9, 10], further promoting vascular inflammation and endothelial decay [11].
Despite consistent evidence of hypoperfusion among individuals with dementia [12], cerebral perfusion in those at increased risk of AD is not reliably diminished [13–15]. In fact, several studies have found that APOE ɛ4 carriers [16, 17] and those with MCI [13, 15] often display augmented cerebral blood flow (CBF) in the temporal, prefrontal, and insular cortices [16, 18]. While hypoperfusion is a characteristic feature of advanced AD, hyperperfusion in MCI is hypothesized to reflect a compensatory response by the neurovascular system to support compromised neural networks in the face of neurodegenerative disease [19, 20]. Currently, however, no treatments strategies are known to reduce hyperperfusion in older adults diagnosed with MCI.
Exercise training induces physiological adaptations that enhance aerobic fitness and vascular health [21, 22]. Chronic exercise not only mitigates cardiovascular and metabolic disease [23–26], but likely enhances memory performance [27] and executive control [28] through improved cerebrovascular function [29–31]. Animal studies have revealed that chronic exercise upregulates various neurovascular growth factors [32], which stimulate angiogenesis [31] and enhance cognitive performance [31, 33], thus providing a potential mechanistic pathway by which these adaptations occur.
A small number of studies have demonstrated that the cerebral benefits of exercise are not limited to CN, but extend to those with MCI [34–39]. However, the effects of exercise training on CBF in this high-risk population remain unclear. Therefore, the aim of the current study was to measure resting CBF before and after 12 weeks of aerobic exercise training in both CN and those with MCI, and to assess the relationship between CBF changes and changes in cognitive performance. We hypothesized that individuals with MCI (versus CN) would exhibit greater whole brain CBF at baseline and that exercise would mitigate these differences. Additionally, we expected exercise-induced CBF alterations to parallel improved cognitive performance.
MATERIALS AND METHODS
Participants
Thirty-five community-dwelling older adults (aged 61–88) were enrolled in this exercise intervention. Recruitment methods included study fliers, newspaper advertisements, physician referrals, and in-person informational sessions at local retirement communities and recreation centers. To determine preliminary eligibility, participants underwent a structured telephone interview to identify preclusive health conditions and MRI contraindications. Qualified participants provided written informed consent, obtained physician’s approval for moderate-intensity exercise, and underwent a neurological assessment to establish definitive eligibility. Prior to commencing the exercise intervention, participants were familiarized with the scanning procedures at the neuroimaging center. This study was approved by the Institutional Review Board of the Medical College of Wisconsin in accordance with the Helsinki Declaration.
Eligibility criteria
For a complete list of exclusionary criteria and prohibitive medication, see our previous study [35]. Briefly, study volunteers were excluded if they reported or presented signs of the following: neurological disorders including, Parkinson’s disease, Huntington’s disease, multiple sclerosis, cerebral palsy, epilepsy, carotid artery disease, transient ischemic attack (>4 on the modified Hachinski Ischemic Scale [40]), brain tumor, or head trauma with a loss of consciousness (>30 min); psychiatric disorders, including any untreated Axis I diagnosis (as defined by the DSM-IV [41]), a substance abuse disorder, or severe depressive symptoms (>12 on the Geriatric Depression Scale [42]); and cardiometabolic or pulmonary disorders including cardiovascular disease, untreated hypertension, chronic obstructive pulmonary disease, and asthma. Eligible participants reported low physical activity (<3 days/week during the previous 6 months), were right-handed (≤50 on the Edinburgh Handedness Inventory [43]), could independently complete tasks of daily living (IADLs; measured by the Lawton and Brody Self-Maintaining and Instrumental Activities of Daily Living Scale [44]), and presented no absolute contraindications to exercise stress testing or MRI.
Over the course of the recruitment process, a total of 407 individuals responded to in-person solicitations or study advertisements. Of these, 92 eligible individuals signed informed consent and underwent neurological examination. Of these, six did not meet inclusion/exclusion criteria and another 18 declined to continue beyond the initial screening. Of the 68 remaining, 29 were withdrawn from the study before commencing the exercise intervention, for various reasons: nine due to discomfort in the MRI environment, five due to excluded medications, and 15 due to unwillingness to commence the intervention. The remaining 39 participants started the exercise program. Of these, four were withdrawn because of a later diagnosis of exclusionary medical condition, leaving a final sample of 35 participants (17 MCI and 18 CN) [35].
Cognitive status and neuropsychological testing
Cognitive status (normal or MCI) was determined using the Core Clinical Criteria for the diagnosis of MCI as set forth by the National Institute on Aging-Alzheimer’s Association workgroup on diagnostic criteria for the symptomatic predementia stages of AD [2]. Namely, these criteria include 1) subjective concern related to changes in cognition, 2) objective impairment in at least one cognitive domain, 3) preserved functional independence, and 4) absence of dementia (exhibited by intact social and occupational abilities) [2]. To appropriately make this determination and ultimately stratify the sample, each participant was evaluated by a team of clinical investigators (including KAN). Participants with probable MCI were further assessed by a neurologist to exclude other possible causes of cognitive decline.
A comprehensive battery of neuropsychological tests was used to assess performance across the cognitive domains before and immediately after the 12-week exercise intervention. The battery consisted of seven tests to evaluate several aspects of cognition, including: 1) Mattis Dementia Rating Scale-2 [45] (DRS-2; global cognitive function and risk of dementia), 2) Mini-Mental State Exam [46] (MMSE; global cognitive function and risk of dementia), 3) Symbol Digit Modalities Test [47] (SDMT; attention and processing speed), 4) Controlled Oral Word Association Test [48] (COWAT; verbal fluency), 5) Semantic Fluency Test [49] (Animals; semantic fluency), 6) Logical Memory and Letter-Number Sequencing subtests of the Wechsler Memory Scale-III [50] (WMS-III; working memory, delayed memory, and attention), 7) Rey Auditory Verbal Learning Test [51] (RAVLT; verbal working memory and delayed-recall). Alternate test forms were used for each test at each time point, where possible, including for the RAVLT and DRS-2. An extensive description of each assessment (including test materials and procedures) can be found in our previous paper [35].
O2peak testing
Exercise intervention
The 12-week exercise intervention included four 30-min sessions of moderate-intensity treadmill walking per week. Exercise sessions occurred at local recreation centers, were conducted independently or in groups of two, and were always supervised by a certified exercise trainer. During the first four weeks, exercise intensity progressively increased, with all participants ultimately reaching target intensity (50–60% of HRR) by the fifth week. This target intensity was maintained for the remainder of the exercise training program (8 weeks). Participants engaged in 10 min of light activity (e.g., stretching and walking) as a warm-up and cool-down; and during the training sessions, HR (using a Polar® monitor) and RPE (using the Borg RPE 6–20 Scale [55]) were measured to track training intensity and accommodation. Treadmill speed and grade were tailored to match baseline fitness levels and were progressively modified, by session, to promote increases in aerobic fitness.
MRI acquisition
During the MRI scan, participants were instructed to remain still, keep their eyes open, and focus their gaze towards a fixation cross projected directly in front of them. All MRI data were acquired using a GE 3.0 Tesla MR system (Waukesha, WI, USA) with a quad/split head coil for radio frequency transmission and reception. A high-resolution T1-weighted anatomical brain image was collected using a 3D Spoiled Gradient Recalled at steady state (SPGR) protocol for coregistration and included the following sequence parameters: matrix = 256, field-of-view (FOV) = 240 mm, voxel size = 0.94×0.94×1.00 mm, number of excitations = 1, slice thickness = 1 mm, repetition time (TR) = 9.6 ms, echo time (TE) = 3.9 ms, inversion time (TI) = 450 ms, flip angle = 90°, and sequence duration = 6 min.
Perfusion-weighted images were collected using a multi-slice pseudo-continuous arterial spin labeling (PCASL) protocol for perfusion quantification and included the following sequence parameters: matrix = 64, FOV = 240 mm, voxel size = 3.75×3.75×5.00 mm, number of excitations = 1, slices = 12 (axial, ascending order), slice thickness = 5 mm, gap between slices = 1 mm, single slice acquisition time = 33.75 ms, label duration (bolus) = 1480 ms, post-label delay (PLD) = 1575-1980 ms, TR = 4000 ms, volumes = 90, number of label/control pairs = 45, flip angle = 90°, RF blocks = 80, block duration = 18.5 ms, and sequence duration = 6 min.
MRI data processing
Preprocessing
AFNI’s Dimon program was used to convert the DICOM image files into 3D space [56]. Once reconstructed, the first four volumes of the image time-series were discarded to avoid magnetization disequilibrium. The truncated time series were realigned to reduce the spurious effects of head motion (using AFNI’s 3dvolreg), and runs with excessive motion (>2.5 mm) were excluded from further analysis. The motion-corrected undifferenced PCASL image was coregistered with the T1-weighted anatomy (using AFNI’s align_epi_anat.py) and visually inspected for proper alignment. A proton density (PD) image for perfusion calibration was created by extracting the first 10 control volumes from the coregistered time series [57], and was spatially smoothed (6 mm Gaussian kernel) to enhance signal-to-noise ratio and improve perfusion calibration [58].
Segmentation
Partial volume estimates, which are proportional estimates of gray matter (GM) and white matter (WM) per voxel, were derived using the tissue sensitivity and probability distributions of the coregistered T1-weighted anatomy utilizing FSL’s Fully Automated Segmentation Tool (FAST; FMRIB Software Library version 5.0.9, Oxford, UK) [59]. These high-resolution maps served several key purposes including partial volume correction, nuisance regression, and tissue-specific perfusion quantification. Additionally, cortical parcellation maps were created using FreeSurfer’s (Version 5.3.0) automated processing stream to anatomically isolate regional CBF.
Perfusion quantification
FSL’s Bayesian Inference for Arterial Spin Labeling (BASIL, FMRIB Software Library version 5.0.9, Oxford, UK) was used for perfusion quantification [57, 60]. A perfusion image was generated from the coregistered PCASL time series using pairwise subtraction (control-labeled volumes) and adjusted for slice-time delay. A T1 correction was used on the PD image to adjust for potential errors in the blood-brain partition coefficient (TR <5000 ms) [58]. Once corrected, a ventricular reference mask from the T1-weighted anatomy was used to isolate and compute the magnetization equilibrium (M0) of brain tissue, which was further used to approximate the M0 of arterial blood (M0a).
Buxton’s General Model for Kinetic Inversion was implemented to estimate absolute cerebral perfusion (ml/100 g/min) and included the following parameters: ΔM (proportional magnetization change represented by the perfusion image), T1 blood (longitudinal relaxation time of blood = 1650 ms), T1 tissue (longitudinal relaxation time of tissue = 1300 ms), α (labeling efficiency = 0.85), M0a (magnetization equilibrium of arterial blood), BAT (bolus arrival time: GM = 1300 ms, WM = 1000 ms), Bolus (label duration = 1480 ms), PLD (post label delay = 1575-1980 ms), and λ (blood-brain partition coefficient of gray matter (GM) = 0.98 ml/g and white matter (WM) = 0.82 ml/g) [57, 60]. The rendered CBF map was adaptively smoothed using a spatial regularization technique and partial volume corrected to improve the accuracy of CBF estimation [59, 61]. Relative CBF was derived by dividing absolute CBF by the GM mean on a per subject basis.
Normalization
To preserve the heterogeneity of the individual brain anatomy, the T1-weighted image and anatomical followers (FAST-rendered gray matter segmentations) were warped to MNI space using AFNI’s non-linear transformation [62]. The resulting transformation matrices were then used to normalize and isotropically resample (2 mm3) the corrected CBF maps to standard space.
Group-level processing
Sufficient perfusion data were available for 32 participants at baseline (15 MCI and 17 CN) and 31 participants post-intervention (15 MCI and 16 CN). Before normalizing to MNI space, individual GM and WM segmentations from each participant were used to isolate and extract mean CBF from the PVC maps. Once normalized, GM segmentations (from each participant at both time points) were combined to create a group-level mask, within which the voxel-wise analysis was restricted. Voxels containing signal from less than 95% of the overall dataset were deleted from the group mask and not included in the analysis (see Fig. 1).
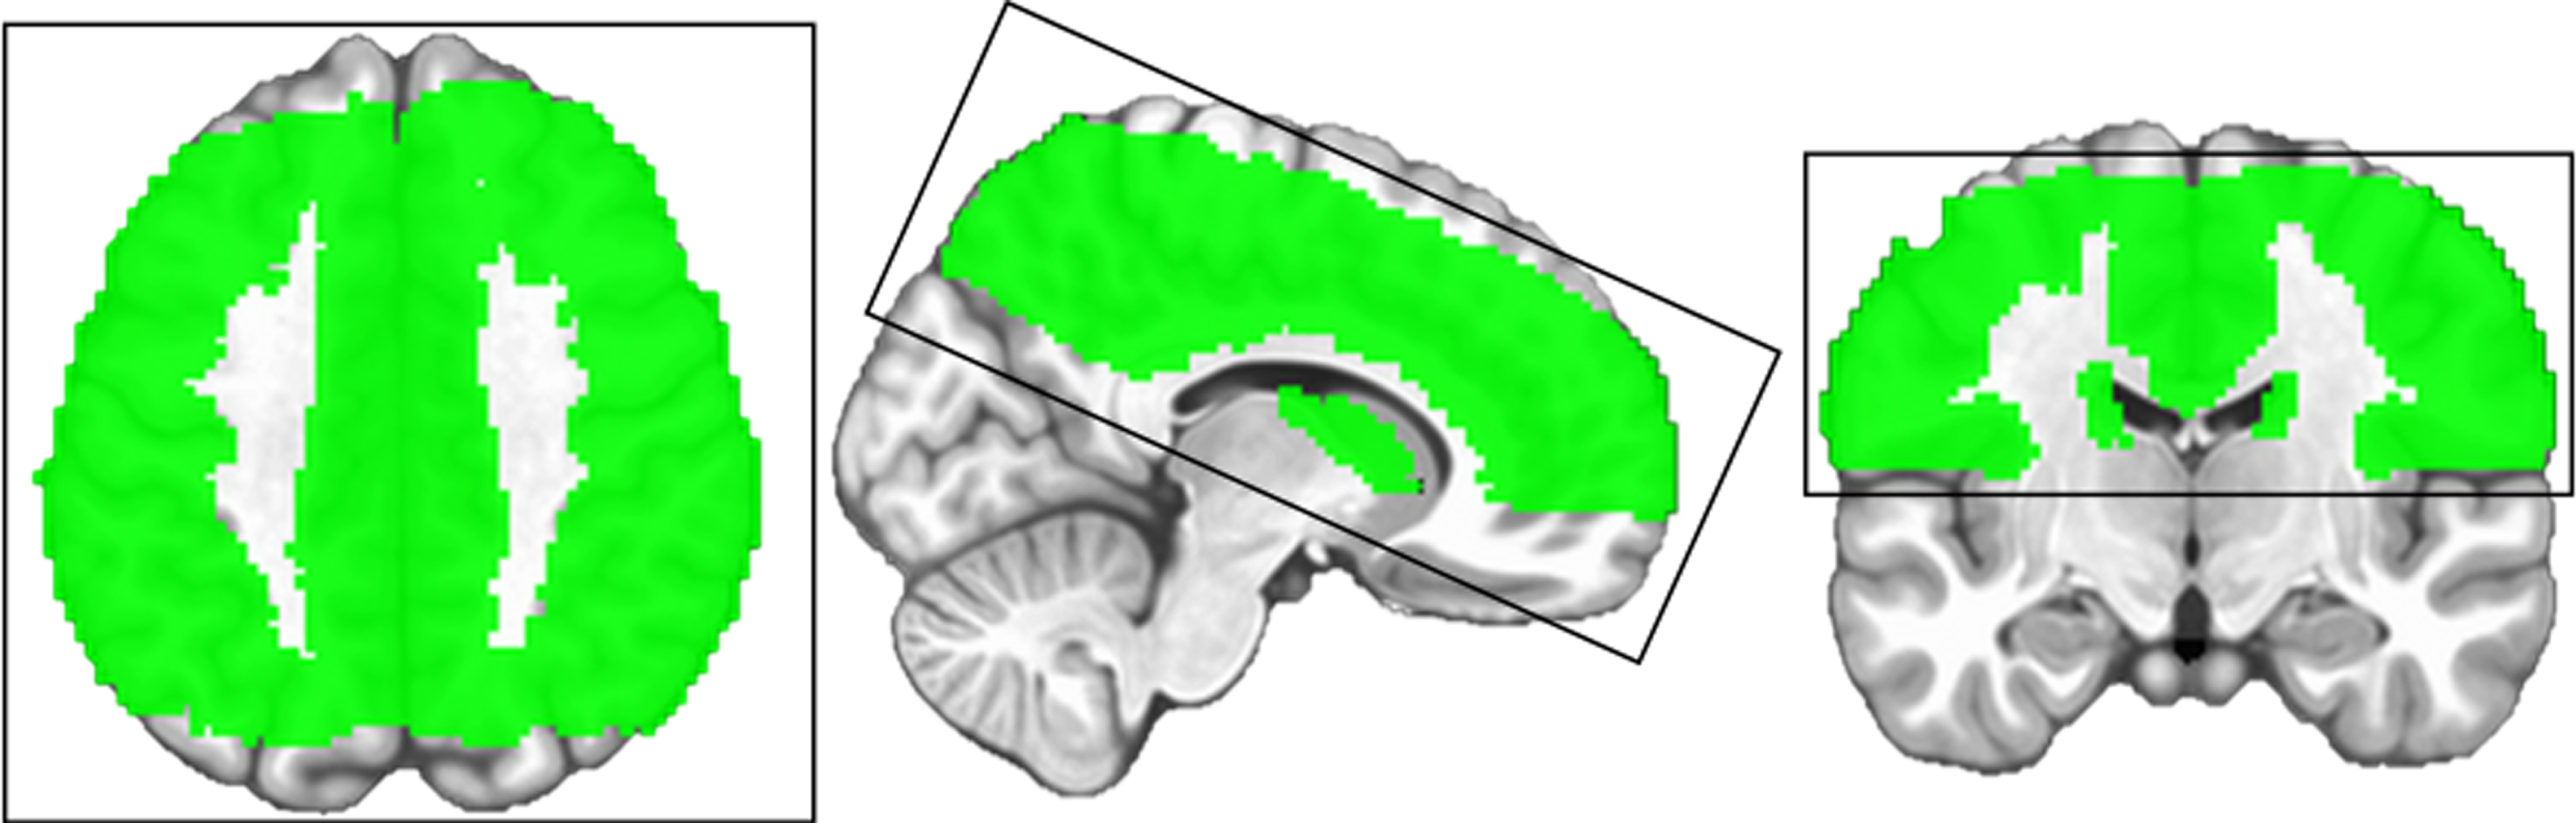
The box encompassing the brain maps above represents the field of view (FOV) that was used for image acquisition during this study. The green colored area illustrates the standardized gray matter mask within which the voxel-wise analysis was restricted. The brain mask was generated using AFNI’s 3dMerge program and included only those voxels in which ≥95% of the study sample had data. Data from voxels not meeting this threshold were excluded from the group analyses.
Statistical analyses
Relative CBF was the primary neuroimaging outcome, because of its high resistance to physiological noise and enhanced sensitivity to regional variation [29, 63]. Using the relative maps, a voxel-wise analysis, without additional covariates, was performed using AFNI’s 3dLME to identify within- and between-group differences over time (see Supplementary Table 2 for regional absolute CBF values and Supplementary Figure 1 for an example perfusion map from the current study). We chose to use 3dLME for its capacity to execute repeated measures analyses while accommodating missing data [64]. Given effective smoothness (ACF estimates) and first-order nearest neighbor clustering, AFNI’s 3dClustSim program was used to control for multiple comparisons and reduce the risk of Type-I error [65]. A family-wise error (FWE) corrected significance threshold was set at p < 0.05 (voxel-level p < 0.05, cluster-level α= 0.05), which maintained clusters ≥428 contiguous voxels (3424 mm3). Mean CBF values were extracted from these significant clusters from each participant at both time points. Between-group differences in demographic characteristics were assessed using independent samples t-tests (or Wilcoxon rank sum tests) and chi-squared tests for continuous variables and categorical variables, respectively. Adjusting for age and education, multiple linear regression and repeated measures analysis of covariance were utilized to evaluate both baseline CBF differences and changes over time using Stata software (version 15; StatCorp, College Station, TX). The same statistical methods were used to test for exercise-induced changes in mean GM CBF, neuropsychological performance, aerobic fitness, and blood pressure. For post-hoc correlation analyses, significant clusters (from the voxel-wise analysis) and representative cortical parcellations (from FreeSurfer) were used to isolate regional CBF at both time points. Residualized CBF, RAVLT Trial 1, and COWAT performance were independently derived from linear regression models predicting post-intervention from baseline values. The residualized change scores were used to minimize both practice effects and regression to the mean [66, 67]. Adjusting for age and education, partial correlation analyses were utilized to evaluate the correlation between CBF changes and cognitive improvements [68]. Unless otherwise stated, significance was determined using a two-tailed alpha <0.05.
RESULTS
Demographic characteristics and aerobic fitness
At baseline, those diagnosed with MCI and CN did not significantly differ by age, sex, education, APOE genotype, functional abilities, depression score (missing data n = 3 MCI, 1 CN),
Participant characteristics at baseline
Unless otherwise indicated, values reflect means with standard deviations in parentheses. P-values from chi-square tests for categorical variables and t-tests (or Wilcoxon rank sum tests) for continuous variables. Bold p-values indicate significant between-group differences, p < 0.05. MCI, mild cognitive impairment; CN, cognitively normal; IADL, Instrumental Activities of Daily Living; GDS, Geriatric Depression Scale;
Neuropsychological performance
Aside from RAVLT Trial 1, individuals with MCI (versus CN) performed significantly worse on all neuropsychological assessments at baseline (see [35]). After the exercise intervention, both groups exhibited significantly improved RAVLT Trial 1, F(1, 30) = 7.6, p = 0.010 and COWAT performance, F(1, 30) = 5.6, p = 0.024, and
Neuropsychological performance, aerobic fitness, and blood pressure changes over time
After adjustment for age and education, p-values and effect sizes
Voxel-wise CBF analyses
At baseline, relative CBF within the left insula (L insula) was significantly greater among those with MCI (β= 0.7, p = 0.008), but after the exercise intervention no such difference was present (Fig. 2). There were no significant group-by-time interactions or main effects of time. However, post-hoc analyses revealed that chronic exercise engendered different responses within each group. After adjustment for age and education, exercise training decreased CBF among those with MCI in the L anterior cingulate cortex (ACC), F(1, 14) = 6.8, p = 0.021 and the R inferior frontal gyrus (IFG), F(1, 14) = 5.5, p = 0.034, and increased CBF in the R ACC among CN, F(1, 15) = 9.6, p = 0.007 (Fig. 3 and Supplementary Table 1). Note, the brain regions mentioned above reflect the location of peak perfusion differences or changes; figure legends contain a complete list of brain regions overlapped by significant clusters (Figs. 2 and 3).

Bold p-value indicates a significant between-group difference, family wise error corrected p < 0.05. A) Brain maps and corresponding strip plots showing significant difference at baseline (CN < MCI) in the left insula (the location of peak difference). B) Demonstrates the comparison after the exercise intervention (CN = MCI). The baseline difference (shown in red) spans several brain regions including the left insula (BA 46), putamen (BA 25), inferior frontal gyrus (BA 47), and medial frontal gyrus (BA 10). There was no significant between-group difference in the left insula, or any other brain region, after the exercise intervention.
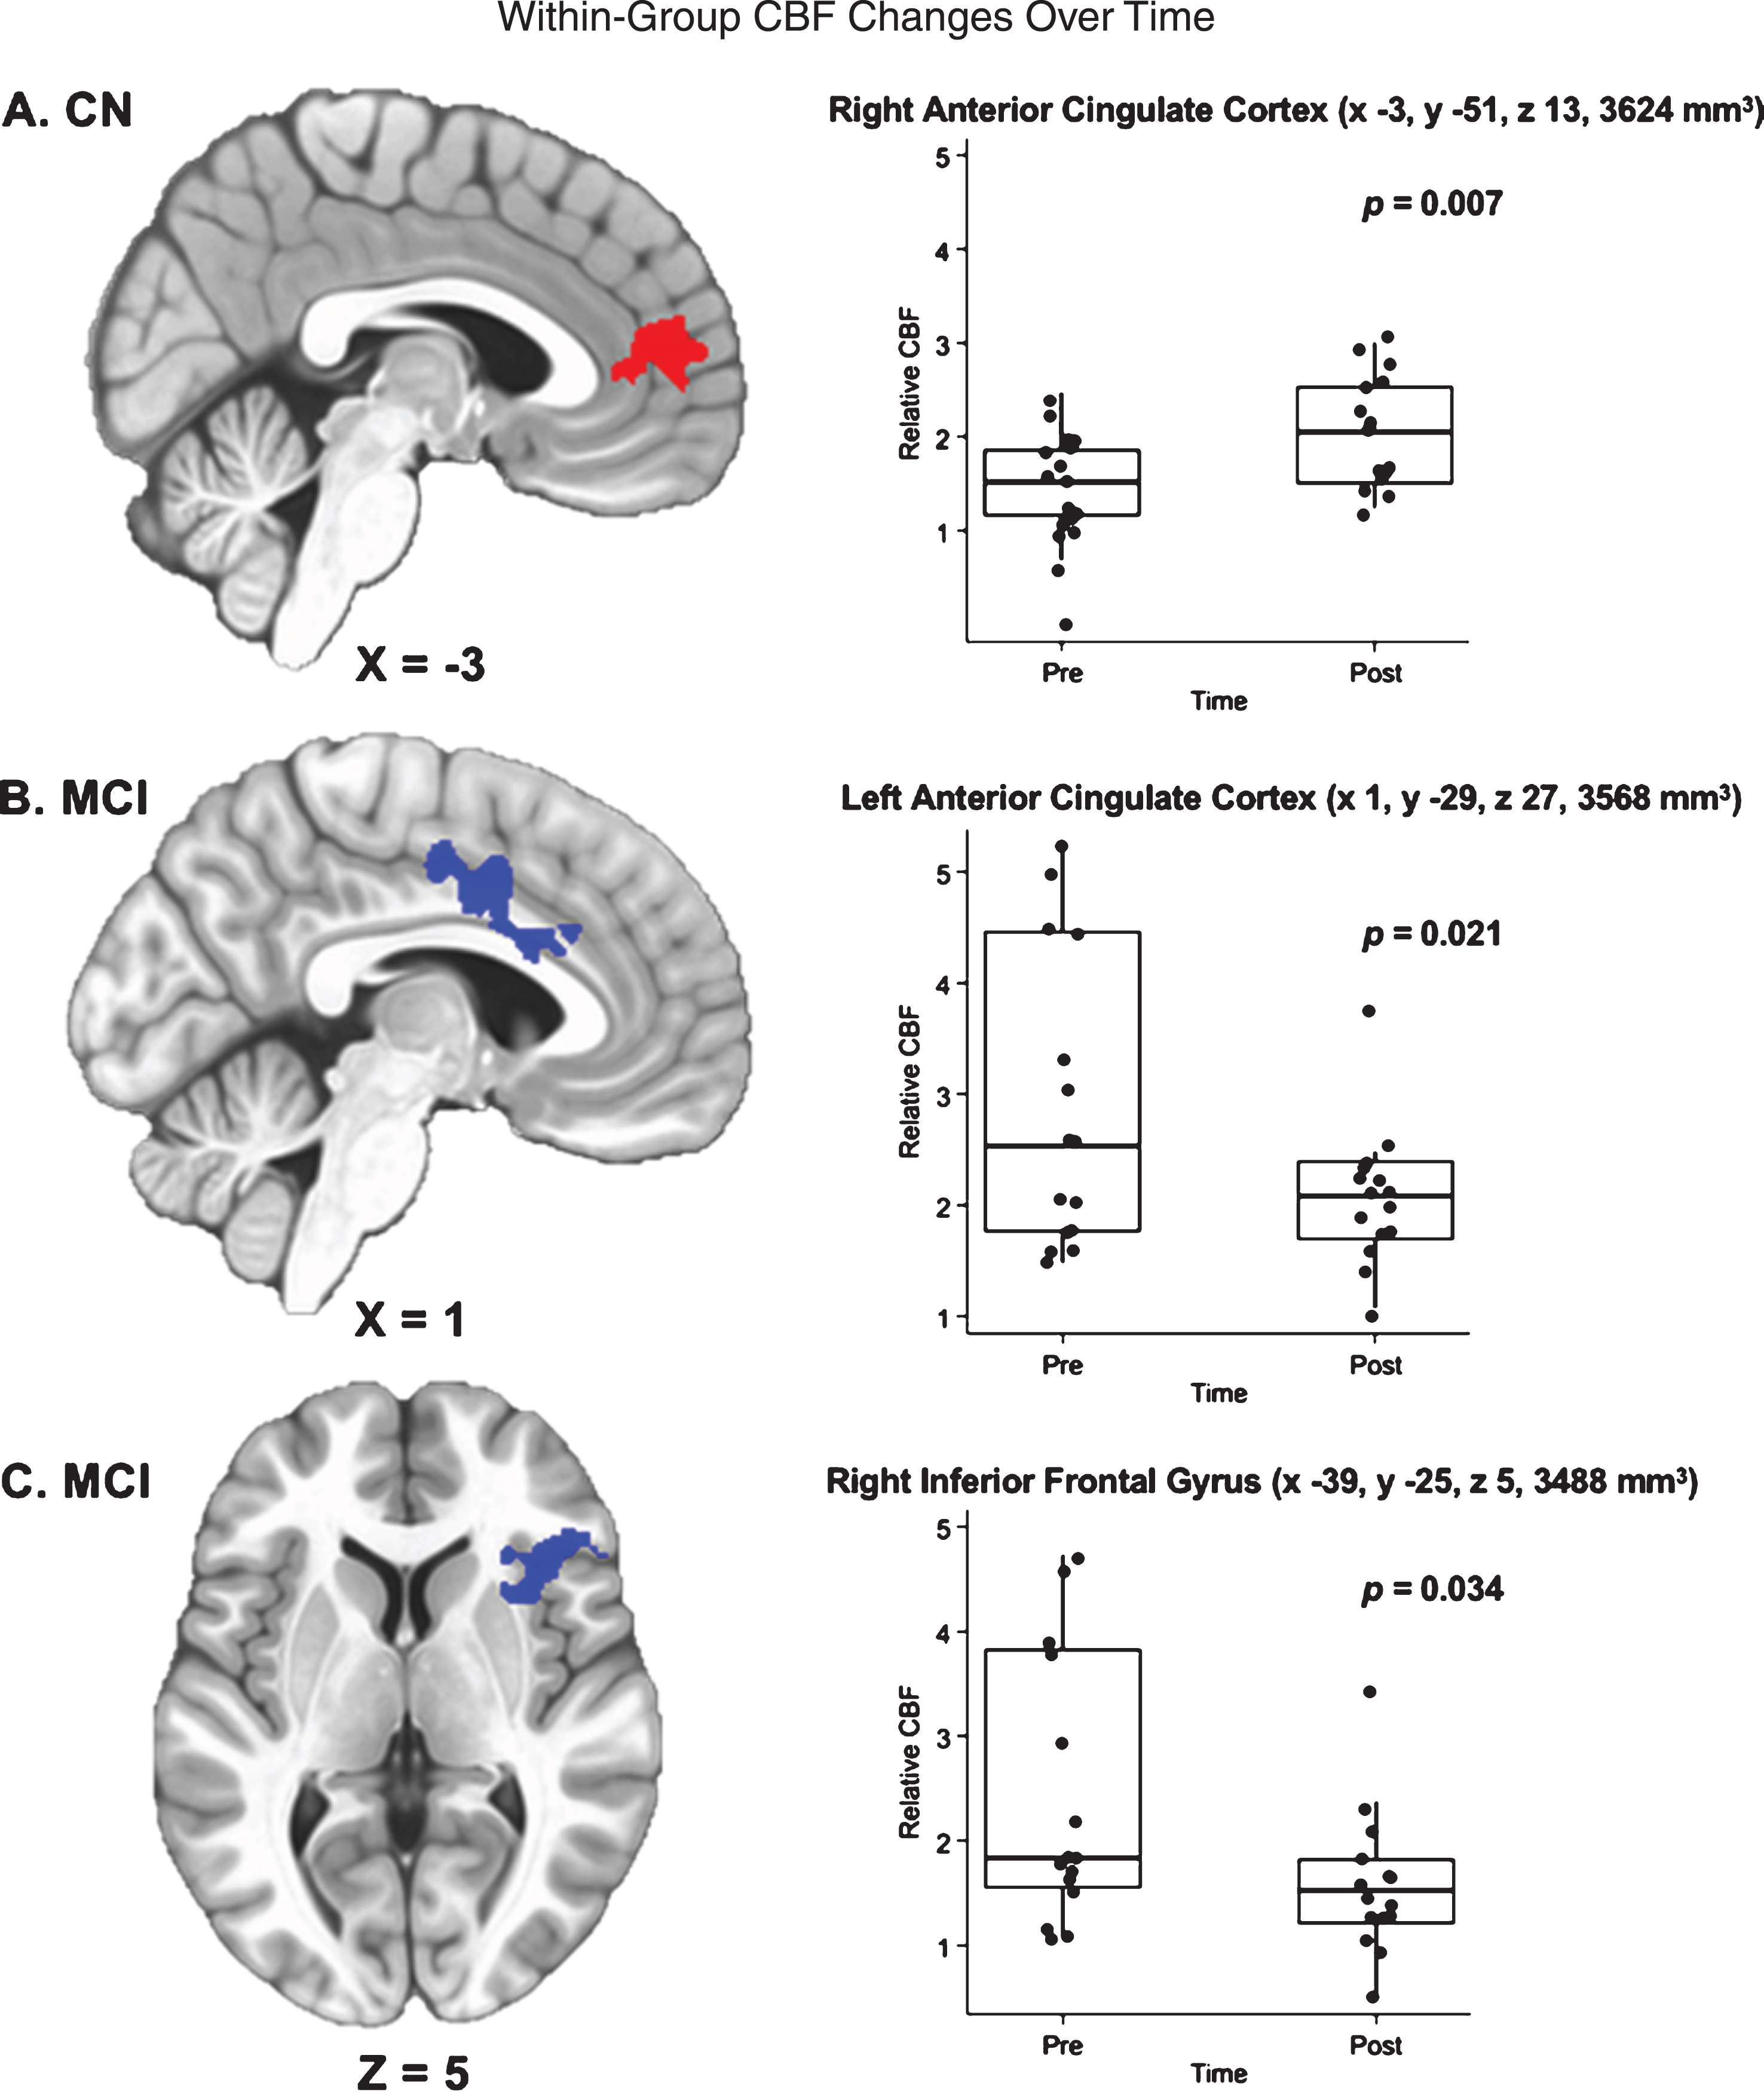
Bold p-values indicate significant within-group changes over time, family-wise error corrected p < 0.05. A) Brain map and corresponding strip plot show significant changes over time for CN. Red area indicates significantly increased CBF in the right anterior cingulate cortex (location of peak change), but also spans the left/right anterior cingulate cortices and the left/right superior medial gyri (BA 10). B) Shows significant changes over time for MCI, with the blue area indicating decreased CBF in the left anterior cingulate cortex (location of peak change). C) Also shows significant changes over time for MCI, with the blue area indicating decreased CBF in the right inferior frontal gyrus (location of peak change). Significant CBF changes in those with MCI span several brain regions including the left/right anterior cingulate cortex (BA 24), left/right middle cingulate cortex (BA 32), right inferior frontal gyrus (BA 47), right insula (BA 46), and right putamen (BA 25).
Associations of within-group changes in CBF and cognitive performance
Mean CBF values were extracted from the left and right ACC for MCI and CN, respectively, and the right IFG and left insula for those with MCI. After adjustment for age and education, results demonstrated partial correlations between improved COWAT performance and decreased CBF within the L insula (as defined by the voxel-wise analysis; r = – 0.79, p = 0.001) and L ACC (as defined by cortical parcellation; r = – 0.82, p < 0.001) (Fig. 4). No additional correlations were identified between changes in regional perfusion and improvements in cognitive performance for either group and there were no significant associations between systolic/diastolic blood pressure changes and within-group CBF changes over time.

After adjustment for age and education, scatterplots depict the partial correlations between residualized change in COWAT performance and residualized change in CBF among individuals diagnosed with MCI. Improved COWAT performance was associated with (A) decreased left insula CBF and (B) decreased left ACC CBF among individuals with MCI. No such associations were found among CN individuals.
DISCUSSION
Key findings
Although no significant interactions were found at the p < 0.05 level, 12 weeks of exercise training significantly improved aerobic fitness (
Post-hoc tests were also used to determine whether CBF changes were coupled with improved cognitive performance. In support of our hypotheses, we found that those with MCI (versus CN) exhibited more diffuse exercise-induced changes in perfusion within the prefrontal cortex (7056 mm3 versus 3624 mm3), which were directionally dependent on cognitive status. Specifically, among those with MCI, exercise training decreased CBF in the L ACC and R IFG, while in CN, exercise increased CBF in the R ACC. Moreover, among those with MCI, decreased CBF in the L insula and L ACC was correlated with improved COWAT performance. No additional associations were identified between perfusion changes (within the R IFG or R ACC) and improvements in cognitive performance for MCI or CN. No between-group differences or within-group changes in whole-brain CBF were observed.
In the present study, individuals with MCI demonstrated significantly elevated CBF in the L insula at baseline, but not immediately after 12 weeks of aerobic exercise. The insula is a unique and complex brain region involved in numerous functions (e.g., autonomic regulation, motor control, higher order cognitive-emotional processing) and is believed to be a primary component of the salience network [69–71]. Like the temporal and prefrontal cortices, the insula appears to be affected early along the AD continuum, with previous investigations demonstrating insular atrophy and disrupted intrinsic connectivity among individuals with MCI [72, 73]. Our findings align with prior reports of insular hyperperfusion in individuals at increased risk of AD [16], but also suggest exercise training may help normalize a struggling and perhaps diseased neurovascular system. While few studies have used neuroimaging to examine the effects of exercise in MCI, investigations pursuing this objective have revealed promising results. In 2015, ten Brinke et al. examined the effects of a 6-month exercise intervention (participants were randomized to either: aerobic exercise, resistance training, or balance/toning exercise) in 86 older women with MCI using structural MRI. After 6 months of exercise, those who engaged in aerobic exercise had preserved hippocampal volume compared to the balance/toning group [36]. In 2015, Doi et al. used tri-axial accelerometry and structural MRI to identify associations between physical activity (PA) and white matter lesions/brain atrophy in 323 individuals with MCI. Findings revealed lower levels of PA were linked to more severe white matter lesions and greater levels of moderate-to-vigorous PA were related to less whole brain atrophy [37]. Finally, using the same sample analyzed in the current study, our group has shown 12 weeks of exercise training in those with MCI leads to improvements in neural efficiency [35], functional connectivity [74], and cortical thickness [34].
Theories and potential mechanisms
Cerebrovascular disease and AD share many of the same risk factors (e.g., hypertension, hypercholesterolemia, and diabetes) and most AD cases present some signs of vascular pathology [8, 76]. Stroke and silent infarcts, including transient ischemic attacks and hypoxic events (e.g., during sleep disordered breathing) increase the risk of AD [77–79]. “The Two-Hit Vascular Hypothesis for Alzheimer’s Disease” postulates that vascular risk factors compromise the blood-brain barrier and reduce CBF (i.e., the first “hit”), which leads to a cascade of neurotoxic events [7, 8]. According to this theory, microvascular damage increases arterial transit time (ATT) heterogeneity and concomitantly augments Aβ deposition (i.e., the second “hit”). In cyclical fashion, increased Aβ further promotes hypoperfusion and neuronal dysfunction, which stimulates the formation of NFT, ultimately accelerating neurodegenerative disease [7, 8].
Although we did not measure ATT directly, our findings suggest that consistent aerobic exercise may reduce hyperperfusion (in MCI) by normalizing ATT variability. While the mechanisms remain unclear, prior research indicates that exercise decreases Aβ deposition [80], and stimulates new cerebrovascular growth [33], which would help normalize blood flow and oxygen availability [19]. Additional analyses revealed no significant group-by-time interaction or main effect of time for blood pressure (measured in the scanner immediately before each scan). Moreover, we found no significant associations between systolic/diastolic blood pressure changes and within-group CBF changes over time, further indicating that the exercise-induced alterations in cerebral perfusion were likely unrelated to changes in blood pressure.
We further propose that our previous findings of increased cortical thickness and functional connectivity within the default mode network, as well as reduced activation during memory retrieval, may implicate these effects of exercise training on cerebral perfusion in MCI participants. Supporting this proposition, seminal research in animal models suggests exercise training improves brain function through a series of stepwise processes, such that exercise-altered CBV triggers increases in neuro- and angiogenesis and leads to an expansion of the cerebral microvasculature [33, 81]. In humans, exercise interventions in cognitively normal older adults have demonstrated analogous improvements in cerebrovascular function, which are often accompanied by improvements in memory and executive control [29, 82].
“The Scaffolding Theory of Aging and Cognition (STAC-r),” originally proposed in 2009, and revised in 2014, may partially explain the patterns of cerebral perfusion observed in this study [83]. While STAC-r does not specifically address changes in CBF, it does propose a plausible relationship between neural resource depletion (e.g., vascular damage, NFT, and Aβ deposition) and compensatory scaffolding (prefrontal functional activation), which aligns well with the between-group CBF differences we identified in the L insula at baseline (MCI > CN). Moreover, STAC-r recognizes exercise as a neural resource enrichment that improves brain function directly (e.g., exercise-altered cortical thickness, functional connectivity, synaptogenesis, etc.) and indirectly by facilitating complementary neuronal networks. Increased CBF in the R ACC among CN may reflect such exercise-induced neural resource enrichment, providing alternative pathways to circumvent the toxic pathology (NFT, Aβ, neuroinflammation) that likely precedes cognitive impairment.
Strengths and limitations
The present study makes several valuable contributions to the existing literature. We examined older adults with normal cognition and MCI, who have been underrepresented in the exercise-related neuroimaging literature. We used perfusion-weighted MRI, which is a non-invasive and cost-effective method, accessible on most MRI systems, but seldom utilized. Our study included a battery of neuropsychological assessments, which allowed us to explore potential links between CBF changes and changes in cognition. While our sample was small and homogenous (n = 32, women = 72%, education = 16.1±2.6 years), it was similar in size and composition to other investigations of this nature. And although we likely lacked the power to detect significant interactions, our within-group CBF findings suggest that exercise training may mitigate perfusion abnormalities resulting from AD pathology.
Constrained by contemporary imaging methods, the scanning protocol used in this study limited our FOV to the superior half of the brain, precluding the analysis of subcortical brain regions such as the hippocampus. Although our perfusion-weighted images were partial volume corrected and visually inspected for quality assurance, ASL voxels are large and inherently susceptible to partial volume effects. Finally, the lack of a non-exercise control group is a limitation of this study, warranting some caution in the interpretation of effects. Although we cannot rule out other interpretations of the findings, pretest-posttest designs are commonly used to examine intervention effects over time and it is unlikely the passage of time or other nonspecific intervention effects would be responsible [74]. Although it is possible that improvement in verbal fluency performance could reflect a practice effect, we computed residualized change scores for our analyses, which adjusts for baseline performance, practice effects, and regression to the mean.
Summary and future directions
In the present study, aerobic exercise training mitigated baseline CBF differences between CN and MCI participants. Furthermore, exercise-induced decreases in CBF were linked to improved verbal fluency among those with MCI. To better understand how aerobic exercise might be used to prevent or postpone the onset of dementia, future intervention studies should evaluate other known risk factors, including poor sleep quality and sleep disordered breathing, and must target individuals with a known family history of AD. Moreover, to more appropriately measure CBF and other important parameters of cerebrovascular physiology (e.g., ATT and CBV), future ASL studies should include longer and multiple post label delay times and whole brain coverage. While participants in the current study showed fitness and cognitive improvements after just 12 weeks, we do not know how long these changes will last, or how much training might be necessary to sustain them. Therefore, high-powered, randomized controlled trials are necessary to further evaluate the potential modifying effects of CBF (and other indices of brain function) on the relationship between exercise training and cognition.
Footnotes
ACKNOWLEDGMENTS
We thank the participants for their time and effort while participating in this study. We also thank Piero Antuono, Alissa Butts, Nathan Hantke, Sarah Evans, and Michael Chappell for their clinical, technical, and analytical assistance. This study was supported by the University of Wisconsin-Milwaukee Graduate School Research Growth Initiative; and the National Center for Advancing Translational Sciences, National Institutes of Health grant numbers 8UL1TR000055, 8KL2TR000056. AJA was supported during manuscript preparation by T32-AG027668. The content is solely the responsibility of the authors and does not necessarily represent the official views of the National Institutes of Health.