
Abstract
LY2599666 is a humanized, affinity-optimized monoclonal antibody antigen-binding fragment linked to a PEG molecule and targets soluble amyloid-β (Aβ) monomers. This first-in-human dose ascending study assessed pharmacokinetics (PK) (measured as serum free LY2599666 concentration) and pharmacodynamic (PD) effects (measured as plasma total soluble Aβ40 and Aβ42) after a single subcutaneous (SC) dose of 10, 25, 100, and 200 mg LY2599666 in healthy subjects. As LY2599666 binds to multiple soluble Aβ monomers, a two-target mediated drug disposition model (TMDD) was developed to simultaneously fit serum LY2599666 concentration and Aβ monomer levels. Four Alzheimer’s disease patients completed 25 mg once-weekly dosing of LY2599666 for 12 weeks. In addition, single cerebrospinal fluid samples were collected to assess penetration capability across the blood-brain barrier. PK and PD data collected from the multiple dose cohort aligned with model predictions, suggesting the established TMDD model predicted suppression of soluble Aβ40 and Aβ42 in plasma after SC dosing of LY2599666.
Keywords
INTRODUCTION
Alzheimer’s disease (AD) is a neurodegenerative disorder characterized by a progressive decline in cognitive function with age. Evidence from preclinical, clinical, and genetic studies suggest that the production and deposition of Aβ is an early and necessary event in the pathogenesis of AD [1 –3]. Therefore, treatments that halt the synthesis and deposition of Aβ, or increase its clearance, might have therapeutic benefits for the patients and slow the progression of AD. LY2599666 is a humanized, affinity optimized monoclonal antibody (mAb) antigen-binding fragment (Fab) linked to a polyethylene glycol molecule (PEG), and is expected to bind the mid-domain epitope of the soluble Aβ peptide. Preclinical studies suggest that LY2599666 mediated reduction of soluble Aβ and may slow the progression of AD. This first-in-human, multicenter, Phase I, double-blind, randomized, placebo-controlled study (NCT02614131) was designed to explore safety, tolerability, pharmacokinetics (PK) and pharmacodynamics (PD) effects of a single subcutaneous (SC) dose of LY2599666 (10, 25, 100, 200 mg) in healthy subjects (Part A), and PKPD of multiple doses of LY2599666 in AD patients (Part B). The single ascending dose part (Part A) was completed while the multiple ascending dose part (Part B) was stopped based on the lack of efficacy results of another compound (solanezumab) directed against the same target. Nonlinear PK was observed based on single dose PK data, suggesting that LY2599666 may undergo target mediated drug disposition. Accordingly, a two-target mediated drug disposition model (TMDD) was developed to simultaneously fit PK (free serum LY2599666 concentrations) and PD (total soluble Aβ40 and Aβ42 monomer levels) data from Part A. Four AD patients completed 25 mg SC once-weekly (QW) dosing before Part B was stopped, and the PK PD data were used as external validation for TMDD model. Cerebrospinal fluid (CSF) samples were also collected at a single time point post 12 weeks of 25 mg QW SC administration of LY2599666 to assess its penetration capability across the blood-brain barrier (BBB).
METHODS
Study design
This Phase I study was conducted in two parts. Part A included four cohorts (Cohorts 1 to 4, dose: 10, 25, 100, 200 mg), with 11 subjects in Cohorts 1 and 2 (8 LY2599666:3 placebo) and 10 subjects in Cohorts 3 and 4 (8 LY2599666:2 placebo). After a single SC administration, serum samples for PK and PD analysis were collected for each patient at 0, 2, 4, 8, 12, 24, 48, 72, 96, 120, 168, 216, 264, 336, 504, and 672 h. For Part B, it was intended that 12 patients would be enrolled in the 25 mg SC QW Cohort. However, following the enrollment of 7 patients, a decision was made to stop the development of LY2599666. PK and PD samples in 25 mg QW multiple dose cohorts were collected for each patient at: 0, 2, 4, 8, 12, 24, 48, 72, 96, and 120 h after the first dose, and 0, 2, 4, 8, 12, 24, 48, 72, 96, 120, 168, 216, 264, 336, 504, and 672 h after the last dose on day 85 (13th dose). Lumbar punctures was performed at baseline and before the last dose (Day 84) of study treatment to access trough concentration.
Bioanalytical methods
Human serum samples obtained during this study were analyzed for LY2599666 using a validated ELISA method (Pharmaceutical Product Development, Richmond, VA, USA). The lower limit of quantification was 125 ng/mL, and the upper limit of quantification was 3000 ng/mL.
Human CSF samples obtained during this study were analyzed for LY2599666 using a validated high-performance liquid chromatography method using tandem mass spectrometry detection (Algorithme Pharma, Laval, Québec, Canada). The lower limit of quantification was 0.500 ng/mL and the upper limit of quantification was 100.000 ng/mL.
Aβ peptides in human plasma were first extracted using a solid phase extraction (SPE) method, and were subsequently measured using a validated enzyme-linked immunosorbent assay (ELISA) method. During the SPE procedure, 300μL of plasma with or without LY2599666 was mixed with 700μL of 6.4 M guanidine-HCl to denature proteins and to separate Aβ peptides from LY2599666. The samples were incubated at room temperature with shaking for 1 h, and then were acidified using H3PO4 to a final concentration of 1.2% before being applied to an Oasis HLB (60 mg sorbent) 96-well plate (Waters, Milford, MA) with the aid of a Waters Positive Pressure-96 Processor (Waters). During the SPE process, the Low Flow Regulator on the processor was set to 3 psi to ensure slow passage of samples through the plate to maximize Aβ peptide binding. Before the denatured and acidified samples were loaded to the plate, the plate was first conditioned using 1 mL of methanol, and then was equilibrated with 1 mL of 5% methanol with 4% H3PO4. After sample loading, the plate was washed twice using 1 mL of 5% methanol with 4% H3PO4 and then with 1 mL of 10% acetonitrile. The bound peptides were eluted twice using 400μL of 75% acetonitrile/3% ammonium hydroxide solution. The elute was dried at room temperature using a SpeedVac system for at least 8 h. To minimize nonspecific binding loss of Aβ peptides to the 96-well plate, sucrose was added to a final concentration of 1% before the samples were dried. Control samples with Aβ40 and Aβ42 spiked into plasma pooled from healthy donors, at concentrations of 0.5, 1, and 5 ng/mL, were also processed in parallel. Before ELISA analysis, Aβ peptides were first solubilized using 300μL of cold assay buffer composed of 50 mM 4-(2-hydroxyethyl)-1-piperazineethanesulfonic acid (HEPES), 5 mM ethylene-diamine-tetraacetic acid, 5 mM ethylene glycol tetraacetic acid, 30 mM NaCl, 1% Triton X-100, pH 7.4 with 0.1% bovine serum albumin (BSA), and then were further diluted 2-fold using assay buffer with 100μg/mL of heterophilic blocking reagent 1 (Scantibodies Laboratory, Inc. Santee, CA) added.
For ELISA measurement, anti-Aβ antibody 2G3 (specific for Aβ40) or 21F12 (specific for Aβ42) were used as capture antibodies, and ruthenium-labeled anti-Aβ 3D6 was used as detection antibody in a Meso Scale Discovery (MSD) format. The capture antibody was coated on an MSD plate for 16 to 24 h at a concentration of 10μg/mL. After coating, the plate was blocked using a cold phosphate buffered saline with 1% BSA. Aβ peptide standard curves were generated by diluting Aβ40 and Aβ42 in the assay buffer from 0.68 pg/mL to 40 ng/mL with a 3× dilution between neighboring points, plus the background control. Overall, 50μL of standards, diluted controls, and diluted samples was added to respective MSD plates for Aβ40 and Aβ42. After incubation for 2 h at 4°C with shaking, the plates were washed using a washing buffer of 1× TBS-Tween, pH 7.4, and 50μL of detection antibody at a concentration of 1μg/mL was added to each well, and the plates were further incubated at 4°C for 1 h with shaking. The plates were washed again using the washing buffer, and 150μL of freshly prepared 2× MSD Read Buffer (Meso Scale Discovery, Rockville, MD) was added to each well. The response data were collected on a Meso Scale Sector Imager SQ120 within 5 min from the addition of the Read Buffer. The data were analyzed using a 5-parameter logistic algorithm. The averaged recovery yield from the control samples was used to correct the Aβ peptide concentrations in the unknown samples.
Non-compartmental PK and PD analysis
Serum PK parameters for free LY2599666 were calculated using standard noncompartmental methods of analysis using Phoenix WinNonlin 6.4. The PK parameters calculated included maximum observed drug concentration (Cmax), area under the concentration versus time curve (AUC), and half-life associated with the terminal rate constant (λz) in noncompartmental analysis (t1/2). The actual venous blood sampling times were used in the calculation of PK parameters. For sampling time points with concentrations below the limit of quantification (BQL) that occurred before the first quantifiable concentration, the LY2599666 concentration was set to zero. All other postdose BLQ values were excluded from non-compartmental analyses.
Plasma PD biomarkers (total Aβ40 and total Aβ42) parameters were calculated using standard noncompartmental methods of analysis using Phoenix WinNonlin 6.4. The plasma PD parameters calculated included maximum Aβ40 and Aβ42 level (Cmax), area under the PD responses versus time curve (AUC), and t1/2.
Total (free + bound) LY2599666 concentration from available CSF samples from the 25 mg multiple dose cohort was quantified and the ratio of CSF total concentration to serum free concentration was computed for LY2599666.
Pharmacokinetic and pharmacodynamic model development
Nonlinear mixed-effect population analyses described in this section were conducted using NONMEM (version VII; ICON Development Solutions, Ellicott City, Maryland). The method used was ADVAN6 subroutine and the first-order conditional estimation with interaction. A two target-mediated drug disposition model was used to simultaneously fit free serum LY2599666 concentration and total plasma biomarkers (Aβ40 and Aβ42) from Part A data (Fig. 1). The key PK parameters estimated were first-order absorption rate constant from a depot (Ka), central elimination rate (Ke), and central volume (V1). Since human IV data are not available, bioavailability was assumed to be 1; hence CL/F equals Ke multiplying V1 (Ke*V1), and apparent volume (V1/F) equals V1. It is assumed that after binding, the complex of Aβ-LY2599666 was eliminated at the same rate (Ke) as LY2599666 mAb. The key PD parameters estimated were baseline plasma Aβ40 (BS1) and Aβ42 (BS2) level, the elimination rate of Aβ40 (Kot1) and Aβ42 (Kot2), and the binding affinity (Kd) of LY2599666 to biomarker (assumed to be the same between Aβ40 and Aβ42). The synthesis rate of Aβ40 (Kin1) and Aβ42 (Kin2) equal to BS1* Kot1 and BS2* Kot2, respectively.
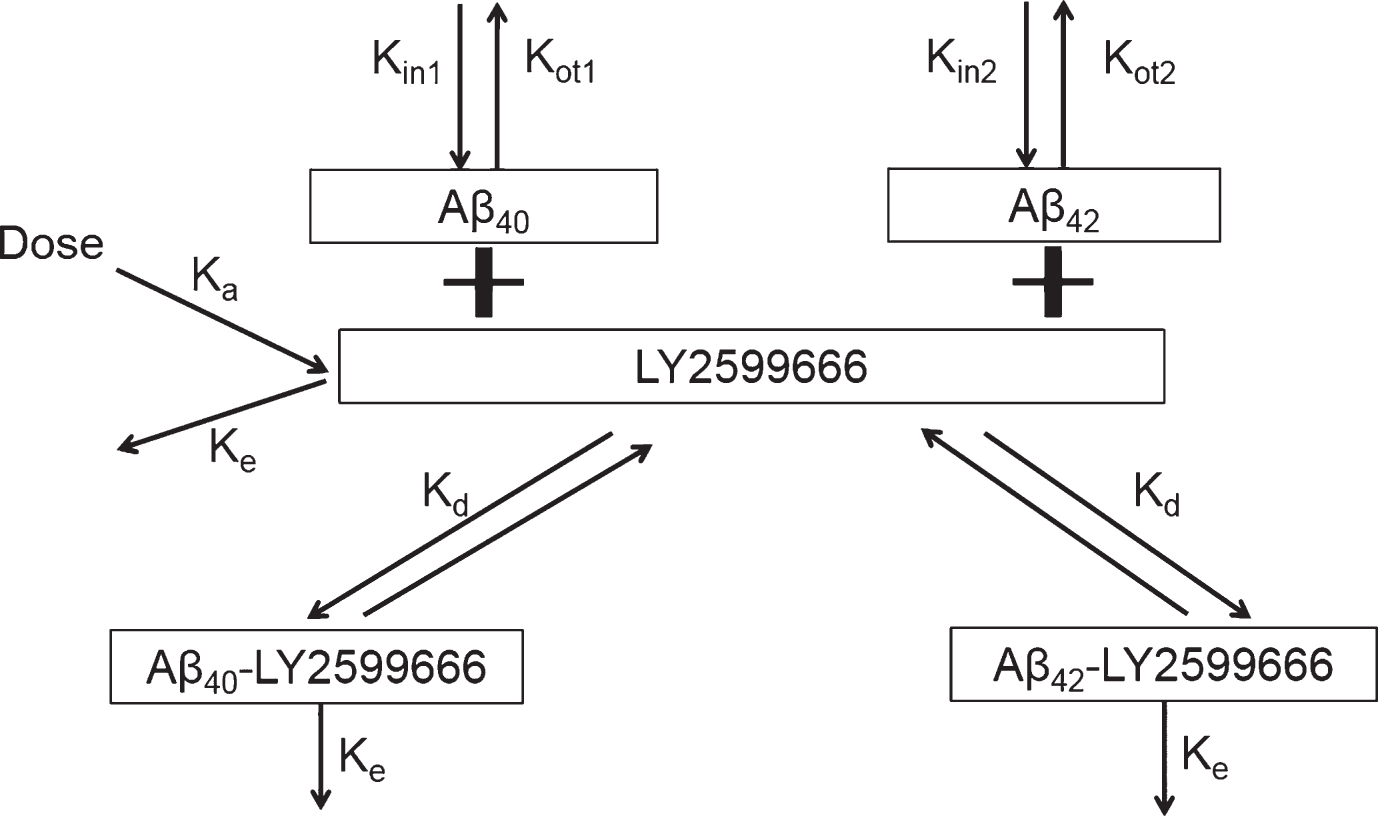
Model scheme of two-target mediated drug disposition model for LY2599666.
Inter-patient variability was tested separately on each of the PK parameters using an exponential error structure (that is, log-normal distribution of individual parameter values) or additive error structure. Covariance between model parameters (CL and V1) in the PK model was examined by the application of omega blocks. A combined proportional and additive error structure was used to describe the residual error.
Selection of the most appropriate PK base model structure was based upon agreement between predicted and observed serum concentrations, lack of pattern (that is, randomness) in the weighted residuals versus the predicted values, magnitude of inter-patient variability, and significant decreases in the minimum objective function.
A visual predictive check (VPC) was performed on the model to ensure that the model maintained fidelity with the data upon which it was developed. The VPC approach entailed simulating PK and PD data with the developed model, taking into account variability in all parameters as given by the between-subject variability and residual error terms. The distribution of simulated concentrations was then compared to the observed distributions to ensure concordance. Simulated and observed distributions were compared by calculating the median, 5th, and 95th percentiles for each.
Additional, simulations were performed to predict PK and PD data after multiple doses of 25 mg SC QW of LY2599666. The distribution of simulated concentrations was then compared to the observed PK and PD data from Part B.
RESULTS
Demographics and sample disposition
In Part A, a total of 43 healthy subjects (17 Japanese and 26 non-Japanese subjects), 33 males and 10 females, between the ages of 23 and 65 years, were enrolled in the US and randomly assigned to receive single dose of the study treatment (32 received LY2599666; 11 received placebo). In Part B, a total of 7 patients with AD, 3 males and 4 females, between the ages of 58 and 76 years, were recruited in the US (3) and Japan (4) (5 LY2599666; 2 placebo). One of 7 patients did not complete the study and was withdrawn due to worsening of pre-existing AE of anemia after receiving 3 LY2599666 doses. Therefore, PKPD data from only 4 patients were included in evaluation of LY2599666.
A total of 512 serum samples from 32 healthy subjects treated with LY2599666 were collected in Part A single SC dose cohorts (10 mg to 200 mg). At 10 mg LY2599666, 112 of the 128 samples collected were BQL prior to the first quantifiable or after the last quantifiable sample. At 25 mg LY2599666, 50 of 128 samples collected were BQL prior to the first quantifiable or after the last quantifiable sample. At 100 mg, 10 of 128 samples collected were BQL prior to the first quantifiable or after the last quantifiable sample, and at 200 mg LY2599666, 26 of 128 serum samples were BQL prior to the first quantifiable or after the last quantifiable or had no result. A total of 162 serum samples were collected from 5 patients that received QW SC doses of 25 mg LY2599666 in Part B, in which 35 samples were BQL. Plasma total Aβ40 and Aβ42 samples were collected from 50 subjects in Parts A and B of the study that received either LY2599666 or placebo. Four CSF samples were collected from AD patients that received 25 mg LY2599666 QW and one sample was excluded due to blood contamination.
Non-compartmental PKPD analysis results
Following a single SC dose of LY2599666, mean concentration versus time profiles by treatment group for LY2599666 is shown in (Fig. 2). Since there were only 16 quantifiable serum samples collected following a single SC dose of 10 mg LY2599666, no data from 10 mg were included in the non-compartmental (NCA) analysis. A summary of NCA PK parameters is presented in Supplementary Table 1. It should be recognized that the terminal t1/2 calculated by NCA PK analysis may not represent the true terminal t1/2 due to impacts from the quantification limit. For example, most PK samples at 240 h were BQL following a single dose of 25 mg LY2599666, suggesting that quantifiable concentrations only represented less than three half-lives of its PK profile. Individual Cmax and area under the concentration versus time curve from zero to infinity (AUC[0–∞]) values from the Japanese and non-Japanese populations were compared (not reported), suggesting no significant difference in exposures between the two populations.
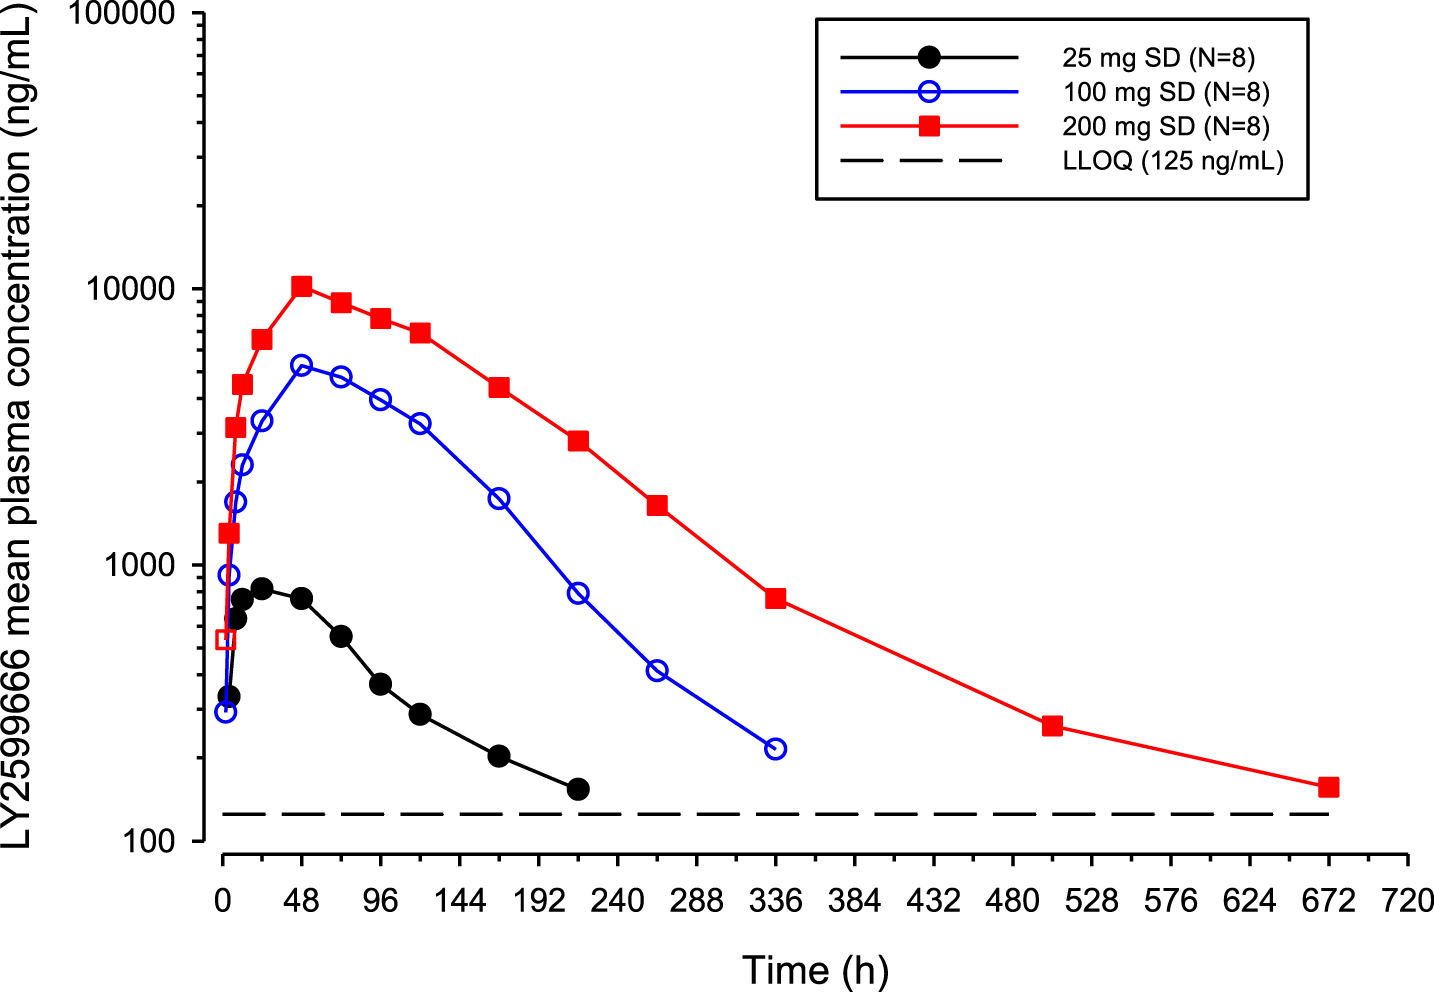
Arithmetic mean LY2599666 plasma concentration versus time profiles following a single subcutaneous dose of LY2599666.
The plasma Aβ40 and Aβ42 response (geometric mean [% CV]) in healthy subjects who received placebo sustained at 213 (19) pg/mL and 52 (19) pg/mL with a range of 143 to 567 pg/mL, and 33 to 91 pg/mL, respectively. Following a single SC dose of LY2599666, both total plasma Aβ40 and Aβ42 showed dose-dependent increases (Fig. 3). Noncompartmental analyses were performed with plasma total Aβ40 and Aβ42 concentration versus time profiles (Supplementary Table 2).
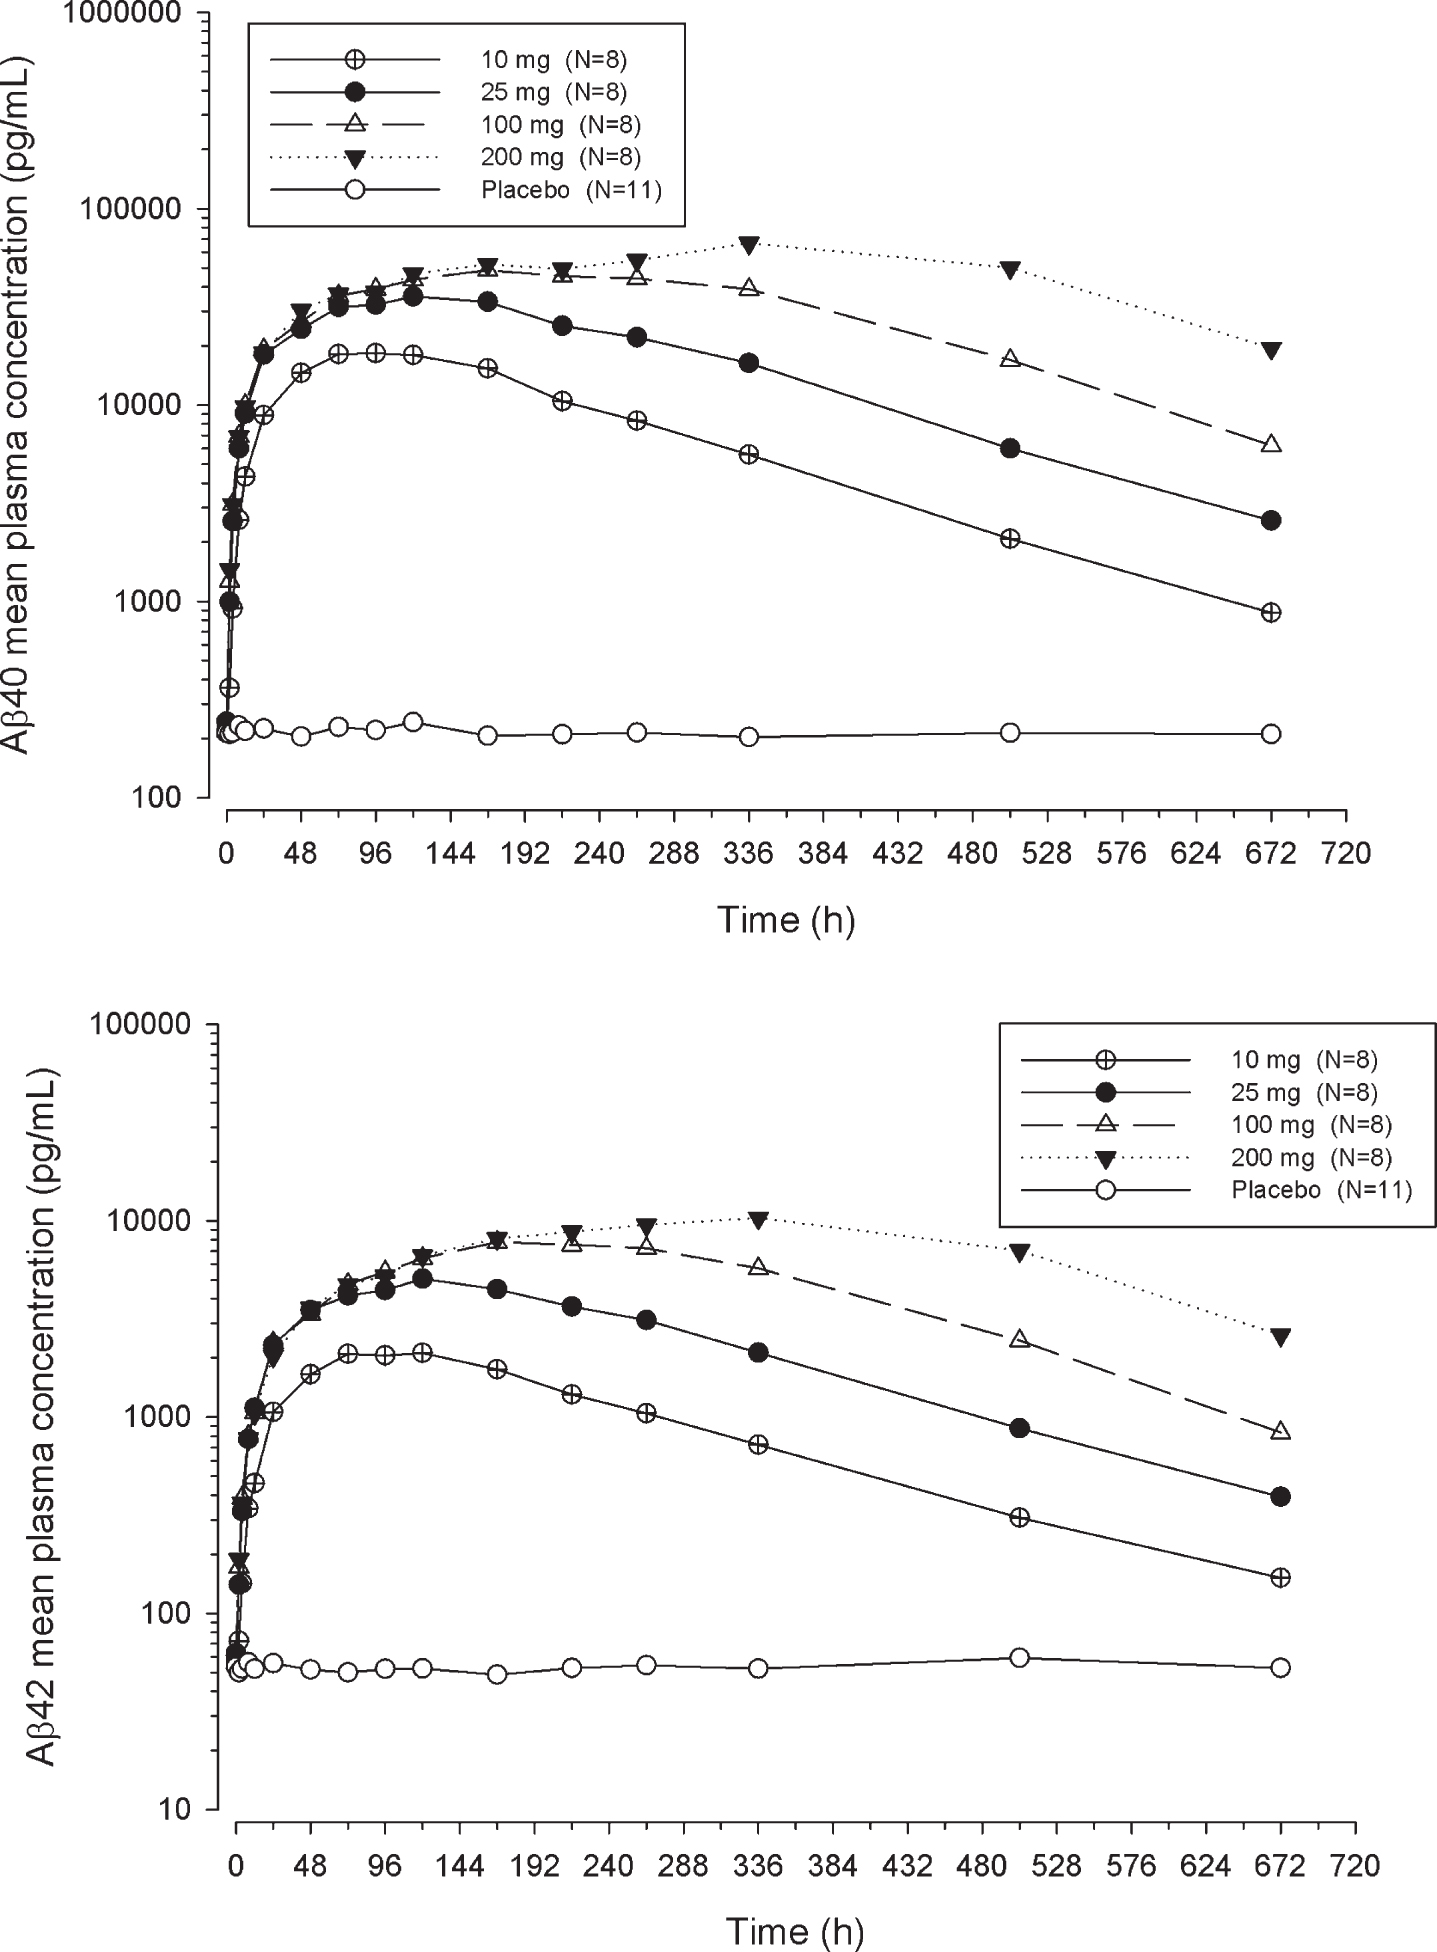
Arithmetic mean Aβ plasma concentration versus time profiles following a single subcutaneous dose of LY2599666.
Supplementary Figure 1 presents all the PK data collected from 25 mg SC QW dose of LY2599666. The accumulation ratio was 1.27-fold based on geometric mean Cmax and 1.39-fold based on geometric mean Ctrough. The steady state appeared to be achieved around Day 22 based on Ctrough.
The plasma Aβ40 and Aβ42 response (geometric mean [% CV]) in the 2 AD patients who received placebo for 12 weeks sustained at 247 (15) pg/mL and 50 (12) pg/mL with a range of 162 to 309 pg/mL and 41 to 66 pg/mL, respectively. Following the first dose of 25 mg LY2599666, total plasma Aβ40 and Aβ42 showed immediate increases, and maintained at high levels with steady state being achieved around Day 21 (Supplementary Figure 1).
Total LY2599666 concentrations in CSF are listed in (Table 1), with the time-matching serum free LY2599666 concentration from the same subject. The ratio between “total CSF” and “free serum” concentration was about 1% or higher. However, the molecule’s penetration capability may be overestimated by using “total CSF/free serum” ratio, as most LY2599666 in serum will bind to plasma Aβ40 and Aβ42, thus cannot be quantified by an antigen binding ELISA assay.
LY2599666 cerebrospinal fluid concentrations for three patients administered 25 mg LY2599666 QW
CSF, cerebrospinal fluid; CV, coefficient of variation.
Population PKPD modeling results
Due to the prevalence of BQL samples in 10 mg/kg dose group, multiple BQL handling method was tested (M1, M3, M4) [4]. There were no significant difference in final parameter estimates and VPC across different BQL handling methods. Due to the longer computation time by using M3 and M4 methods, the final model was developed after omitting the BQL samples (M1 method).
The two-target mediated disposition model well described the free LY2599666 concentrations and total Aβ40 and Aβ42 levels of LY2599666 after a single SC administration. PK and PD parameters are summarized in Table 2. The population estimates were well characterized with adequate precision (≤18.9% relative standard error of estimate). The terminal t1/2 was estimated as 7.3 days (175 h) at high doses when binding is saturated and PK becomes linear. Between-subject variability was small for central elimination rate constant (Ke) and central volume (V1), and high for the absorption rate (Ka). The interactions between Ke and V1 was moderate and also well estimated. The proportional and additive residual error for PK was relatively low (5.51% and 22.5 ng/mL, respectively).
Pharmacokinetic and pharmacodynamic parameters for TMDD model
Aβ, amyloid-β; CV, coefficient of variation; % RSE, relative standard error of estimation. a% CV = (SQRT(EXP(OMEGA(N))–1))*100%. bCovariance between ω 2.
The estimated plasma baseline Aβ40 and Aβ42 was 265 pg/mL (0.0614 nM) and 49.2 pg/mL (0.0109 nM), respectively. The estimated plasma t1/2 for Aβ40 and Aβ42 was 17 min and 25 min based on Kot1 and Kot2. The binding affinity (Kd) of LY2599666 to plasma Aβ40 and Aβ42 was assumed to be the same, which was estimated as 3.27 ng/mL (0.0218 nM). Low-moderate between-subject variability was also identified for plasma baseline Aβ40 and Aβ42, and plasma Aβ42 elimination rate constant. All omega shrinkages were less than 30%. The proportional residual error for plasma Aβ was relatively low (<5%).
The final model was selected based upon goodness-of-fit plots demonstrating good comparability between predicted and observed, as well as demonstrating the randomness of the individual weighted residuals.
Population PK/PD model validation
A VPC was performed on the model to ensure that the model maintains fidelity with the data used to develop it. The VPC approach entails simulating PK, plasma Aβ40 and Aβ42 data 1000 times with the developed model, taking into account variability in all parameters, as given by the between-subject variability and residual error terms. The distributions of simulated concentrations were then compared to the actual concentration distributions to ensure concordance. The VPC plots are provided as Supplementary Figures 2–4.
The model built with Part A data was used to simulate 25 mg QW multiple dose PK, plasma Aβ40 and Aβ42 data, taking into account variability in all parameters, as given by the between-subject variability and residual error terms. The distributions of simulated concentrations were then compared to the actual individual data observed in Part B. Both total plasma Aβ40 and Aβ42 showed immediate increases following the first dose of 25 mg LY2599666, and are maintained at high levels with QW dosing frequency, with steady state being achieved around Day 21. As shown in Supplementary Figure 1, most observed PK and plasma Aβ40 and Aβ42 data from Part B distributed evenly on both sides of the predicted median from Part A model, and fell into 90% prediction interval, suggesting that the PK/PD model developed based on Part A data and predicted Part B data.
DISCUSSION
The target mediated drug disposition (TMDD) model has been utilized by pharmacometricians for more than two decades [5, 6] to describe the scenario when a pharmacological target impacts the apparent pharmacokinetics of a drug (typically a monoclonal antibody). About a decade ago, this TMDD model was expanded to describe scenarios when drugs bind to two targets, with a variety of assumptions [7 –9]. LY2599666 is expected to specifically bind to the mid-domain epitope of multiple soluble Aβ monomers, with similar affinity based on in vitro data (not reported). Multiple soluble Aβ isoforms present not only in the interstitial fluid of brain and CSF, but also in peripheral, for example, plasma [10]. Although numerous other isoforms exist in plasma, Aβ40 and Aβ42 are the primary isoforms present (∼80% – 90% for Aβ40 and ∼5% – 10% for Aβ42) [11] and therefore were collected in present Phase 1 study to confirm target engagement of LY2599666.
Baseline plasma Aβ40 and Aβ42 levels vary depending on the quantification assay and population [12]. The observed baseline plasma Aβ40 (265 pg/mL, 0.0614 nM) and Aβ42 (49.2 pg/mL, 0.0109 nM) levels in healthy subjects in this Phase I study generally aligned with published literature data (254.85 pg/mL for plasma Aβ40 and 65.63 pg/mL for plasma Aβ42) [13], confirming an approximate ratio of 5:1 between plasma Aβ40 and plasma Aβ42 level. The baseline Aβ40 and Aβ42 levels in patients, as what has been reported [14, 15], were not significantly different from healthy subjects. The estimated t1/2 of plasma Aβ40 (17 min) and Aβ42 (25 min) from TMDD model were in the same range as published literature values [16, 17].
Nonlinear PK was observed for LY2599666 at doses less than 100 mg. This is because LY2599666 cannot be detected by antigen binding ELISA PK assay due to binding to plasma Aβ. At high dose levels, binding to free soluble Aβ would be saturated based on molar ratio between LY2599666 (post a single dose of 200 mg: >125 ng/mL, >1.86 nM at 672 h) and plasma Aβ level (baseline Aβ40 + Aβ42: 0.0723 nM), and thus PK became linear. The reported half-life of LY2599666 at high doses was consistent with the prolonged half-life reported for other PEGylated peptides [18, 19]. Accumulation was observed for plasma total Aβ after administration of LY2599666, which was because the t1/2 of Aβ-LY2599666 complex was expected to be the same as LY2599666, and much longer than the t1/2 of free Aβ. As expected, PK and PD results showed comparable t1/2 between free LY2599666 at high doses (92.6 h–175 h), and total Aβ levels (117 h–147 h), and supports weekly dosing of LY2599666.
In addition, CSF samples were collected and the ratio between CSF exposure and serum exposure were much higher (1.49%) than published values (0.1–0.3%) from other mAb [20 –22]. This is likely due to different composition between a free LY2599666 in serum and a total LY2599666 (free LY2599666 + Aβ-LY2599666 complex) level. The ratio between projected total LY in serum based on TMDD model and observed total LY2599666 in CSF was approximately 0.5%, thus aligned with current understanding of penetration ratio.
In summary, about one week half-life was shown for LY2599666, supporting weekly SC dosing. Strong target engagement was demonstrated with a dose dependent accumulation of total plasma Aβ40 and Aβ42. TMDD model developed based on SAD healthy subject data predicted target engagement in AD patients in weekly multiple dose regimen.