
Abstract
Background:
Assessment of human brain atrophy in temporal regions using magnetic resonance imaging (MRI), resting state functional MRI connectivity in the left parietal cortex, and limbic electroencephalographic (rsEEG) rhythms as well as plasma amyloid peptide 42 (Aβ42) has shown that each is a promising biomarker of disease progression in amnestic mild cognitive impairment (aMCI) patients with prodromal Alzheimer’s disease (AD). However, the value of their combined use is unknown.
Objective:
To evaluate the association with cognitive decline and the effect on sample size calculation when using a biomarker composite matrix in prodromal AD clinical trials.
Methods:
Multicenter longitudinal study with follow-up of 2 years or until development of incident dementia. APOE ɛ4-specific cerebrospinal fluid (CSF) Aβ42/P-tau cut-offs were used to identify aMCI with prodromal AD. Linear mixed models were performed 1) with repeated matrix values and time as factors to explain the longitudinal changes in ADAS-cog13, 2) with CSF Aβ42/P-tau status, time, and CSF Aβ42/P-tau status×time interaction as factors to explain the longitudinal changes in matrix measures, and 3) to compute sample size estimation for a trial implemented with the selected matrices.
Results:
The best composite matrix included the MRI volumes of hippocampal dentate gyrus and lateral ventricle. This matrix showed the best sensitivity to track disease progression and required a sample size 31% lower than that of the best individual biomarker (i.e., volume of hippocampal dentate gyrus).
Conclusion:
Optimal matrices improved the statistical power to track disease development and to measure clinical progression in the short-term period. This might contribute to optimize the design of future clinical trials in MCI.
Keywords
INTRODUCTION
The European Innovative Medicines Initiative (IMI) PharmaCog project (European Alzheimer’s Disease Neuroimaging Initiative, E-ADNI) has been designed as a typical clinical trial of anti-amyloid drugs, where amnestic mild cognitive impairment (aMCI) patients were enrolled based on brain amyloid status detected with amyloid-β (Aβ42) in the cerebrospinal fluid (CSF) and were assessed each six months for two years or until dementia development [1]. A study to estimate CSF biomarker cut-offs for prodromal Alzheimer’s disease (AD) in this cohort showed that data-driven APOE ɛ4 specific cut-offs applied on the CSF Aβ42 and tau phosphorylated at threonine 181 (P-tau) ratio improved the diagnostic accuracy in identifying prodromal AD compared to amyloid alone [2]. Thus, the subsequent series of studies conducted to longitudinally characterize a wide range of brain and peripheral promising biomarkers of prodromal AD, were performed using the APOE ɛ4 specific cut-offs classification. These studies, all part of a mini-forum of the Journal of Alzheimer’s Disease on PharmaCog/E-ADNI matrix of biomarkers of prodromal AD [3–5], included neuroimaging markers of brain atrophy (structural MRI) and of structural (diffusion MRI) and functional (resting state functional MRI, rs-fMRI) brain connectivity, neurophysiological markers of cortical neural synchronization and brain connectivity (resting state electroencephalography, rs-EEG, and auditory “oddball” event-related potentials, aoERPs) and, blood biomarkers. Among all MRI biomarkers, volume of the hippocampus and its subfields as well as entorhinal thickness showed the strongest association between baseline CSF pathological values and progressive deterioration. To a lesser extent, prodromal AD patients exhibited also a slightly progressive white matter degeneration, mainly focused in the corpus callosum and fornix [3]. Besides structural MRI biomarkers, rsfMRI connectivity in the parietal cortex of the default mode network nodes showed a progressive increase over time in prodromal AD patients, possibly representing a compensatory mechanism [5]. Furthermore, increased limbic rsEEG source activity at theta rhythms [5] and reduced plasma Aβ42 [4] also characterized the disease progression in prodromal AD patients.
When a set of biomarkers is available to describe a disease with multiple categories, the identification of their “optimal” combination is common practice in the hope of improving the accuracy attained by individual biomarkers [6]. Among different combination approaches used so far, the linear combination is easy to compute and interpret, and it has been shown to improve the diagnostic and prognostic power of individual variables [7, 8]. This approach has been successfully applied in the AD field to compute cognitive composite measures that could track the earliest cognitive changes associated with underlying AD pathology better than single cognitive tests [9–15].
This study aims to develop a biomarker composite matrix combining the biomarkers able to track disease progression in the PharmaCog/E-ADNI cohort, and to determine whether this combination is 1) significantly better than the individual biomarkers in tracking AD progression in aMCI patients, and 2) it may serve as surrogate outcome for future intervention clinical trials testing AD modifiers.
MATERIALS AND METHODS
Study population
Participants’ demographics, clinical, and neuropsychological data have been extensively described in recent PharmaCog/E-ADNI studies [1, 16]. Briefly, 147 aMCI patients were enrolled in 13 European memory clinics of the Innovative Medicine Initiative (IMI) PharmaCog/E-ADNI project (http://www.pharmacog.org). Inclusion criteria were age between 55 and 90 years; complaints of memory loss; Mini-Mental State Examination (MMSE) [17] score of ≥24; Clinical Dementia Rating score [18] of 0.5; score on the logical memory test [19] <1 standard deviation from the age-adjusted mean; 15-item Geriatric Depression Scale score [20] ≤5 and no neurologic, systemic or psychiatric comorbidity.
Patients classification
Patients were dichotomized into Aβ42/P-tau positive or negative based on baseline CSF Aβ42/P-tau level as well as APOE genotype. In particular, Aβ42/P-tau positivity was defined as ratio lower than 15.2 for APOE ɛ4 carriers and 8.9 for non-carriers as revealed by the mixture model analysis earlier performed [2]. CSF and blood analysis have been done at the selected central site and described elsewhere [1]. Briefly, Aβ42, total tau (T-tau), and P-tau were quantified in the CSF by ELISA kits (Innogenetics, Belgium) according to the manufacturer’s instructions. Blood DNA was used for APOE genotyping in a real-time polymerase chain reaction (PCR) using dedicated TaqMan probes (Life Technologies, Carlsbad, CA, USA).
Matrix computation and selection
Biomarkers used for composite score computation were selected based on preparatory work on the longitudinal characterization of a wide range of brain and peripheral promising biomarkers of prodromal AD in the European FP7 IMI-PharmaCog/E-ADNI cohort [3–5]. All these studies aimed at selecting biomarkers that best longitudinally discriminate the CSF Aβ42/P-tau positive (prodromal AD patients) and negative (stable MCI). For this purpose, all studies applied a linear mixed model (LMM) design with biomarker as dependent variable and time, group (corresponding to CSF status), time×group interaction as independent factors and further adjusted by the appropriate covariates. The output of the LMMs were presented in terms of standardized β coefficient, corresponding p-value and, for the time×group interaction factor only, effect size (pseudo η2) calculated as the ratio of the variability explained by the interaction term on the total variability of each model [21]. The effect size represents the proportion of the total variance ascribable exclusively to the interaction term: the higher it is, the more the biomarker differently changes between CSF positive and negative patients over time. All the models included in the preparatory papers applied age and sex as covariates. Moreover, volumes models were adjusted also for baseline MMSE and total intracranial volume; thicknesses and diffusion tensor imaging models for baseline MMSE; rsfMRI models for median head motion and white matter temporal signal-to-noise ratio; EEG/ERP models also for education.
Biomarker selection criteria were the following: a significant effect (p < 0.05) of the main factors included in the model (time, group, and time×group) or an effect size of the interaction higher than 0.10 which corresponds to the median value of the effect size among the models in [3]. These criteria guaranteed the selection of those individual biomarkers that changed over time (time factor, p < 0.05), that were different between CSF positive and negative groups (group factor, p < 0.05) and, most importantly, whose change over time was mainly attributable to the AD-related process (time×group factor, p < 0.05). Adopting these criteria, the biomarkers selected for the composite score computation included whole hippocampus, several of its subfields as Cornu Ammonis (CA) 1, 3, granule cells in the molecular layer of the dentate gyrus (GC-ML-DG), molecular layer of the hippocampus, subiculum, presubiculum and hippocampal tail, lateral ventricle and amygdala volumes, as well as entorhinal thickness. MRI structural biomarkers were obtained by processing 3T T1 images using the longitudinal pipeline of FreeSurfer v6.0 [22–24] as previously reported [3]. Z-scores were computed by standardizing measures for each selected biomarker on each assessment using mean and standard deviation (SD) for the entire group. Biomarkers showing increase over time were multiplied by –1 before being included in the composite Z-score. Composite Z-scores (matrices) were obtained by empirically assigning different weights (a priori fixed) to each biomarker to quantify their contribution in the definition of each composite score to provide the optimal weighting. This means that a matrix could have equally or differently weighted components. Formally, the composite measures C
j
was defined as:
White matter lesions
White matter lesions were qualitatively rated on FLAIR images separately in frontal, parieto-occipital, temporal, infratentorial areas, and basal ganglia using the rating scale for age-related white matter changes [25]. The total score ranged from 0 to 30, with higher scores indicating higher cerebrovascular burden.
Statistical analysis
Statistical analyses were performed using SPSS for descriptive statistics and R: a language and environment for statistical computing (version 3.2.5) for matrices computation, longitudinal analyses (lme4 and bootpredictlme4 packages) and for sample size evaluation (longpower package). Baseline characteristics were compared between participants (Aβ42/P-tau positive versus negative) through parametric t-test (or corresponding non-parametric Mann-Whitney) for continuous Gaussian (or non-Gaussian) distributed variables; and by Chi-square test for categorical data.
As in the preparatory studies [3–5], two different LMMs were applied with all available timepoints and with random intercept and random slope to account for individual differences at baseline as well as for individual change over follow-up. The first set of LMMs was conducted to evaluate the association between cognition and biomarker (or matrix) changes over time. To this purpose, repeated ADAS-cog 13 evaluations were used as dependent variable, repeated biomarker or matrix measures as independent variables (one model for each biomarker or matrix) and time, age, gender and education as factors. The second set of LMMs, previously used to assess the ability of the individual biomarkers in tracking disease progression in Aβ42/P-tau positive compared to negative patients [3], was performed with time, group, time×group interaction as factors and further adjusted for age, sex, baseline MMSE, and total intracranial volume. The effect of matrices as end-points was assessed in the design of a 2-year clinical trial of disease modifiers applying a sample size calculation for linear mixed models with baseline covariates [26]. Sample size was calculated for a 20% and 30% reduction of matrix slope by fixing a significant level for type I error equal to 0.05 and a power of 0.8 for a two-sided test.
RESULTS
Table 1 shows the characteristics of the 144 aMCI patients of PharmaCog/E-ADNI for whom the CSF quantification and APOE genotype were available. Subjects classified as Aβ42/P-tau positive were similar for age, gender, education and vascular damage to negative patients but showed higher CSF T-tau levels (p < 0.001) and worst global cognitive performance at baseline (ADAS-cog13, p = 0.052) and after 24 months (ADAS-cog13, p < 0.001 and MMSE, p = 0.029).
Clinical and socio-demographic features of aMCI patients stratified according to APOE4-specific cut-offs
aAssessed by t-test and Mann-Whitney (for continuous non-Gaussian distributed variables) and Chi-square tests (for categorical variables). bInformation was missing for 43 patients. cRange 0–85, with 0 as the best score. dInformation was missing for 1 patient. Values significant at the 5% level are bold. ADAS-cog13, Alzheimer Disease Assessment Scale-Cognitive Subscale, version 13; Aβ42, amyloid-β; APOE, apolipoprotein E; CSF, cerebrospinal fluid; MMSE, Mini-Mental State Examination; P-tau, tau phosphorylated at threonine 181; T-tau, total tau.
Matrices computation and selection
Among neuroimaging, neurophysiological, and blood biomarkers, those showing the best separation between Aβ42/P-tau positive and negative groups over time were: volume of the hippocampus, several subfields (CA1, CA3, CA4, GC-ML-DG, molecular layer of the hippocampus, subiculum, presubiculum, hippocampal tail), lateral ventricle and amygdala as well as thickness of the entorhinal cortex. These biomarkers were tested for their association with cognitive decline, measured using ADAScog13 score, in the prodromal AD group in order to confirm their suitability as surrogate outcomes of AD progression (Table 2). The longitudinal mixed model analysis showed that all the mentioned MRI biomarkers were able to explain the variability of the ADAS-cog13 scores (p < 0.016, standardized β< –0.228). Next, all the possible combinations among the standardized biomarker values were computed and tested for the ability in separating positive and negative aMCI patients over time. Table 3 presents the proportion of longitudinal variability in matrices, or individual structural biomarkers, explained by time, CSF status and time×CSF status interaction. Only the best matrices computed using 2, 3, 4, or 5 biomarkers were reported as those with 6 or more biomarkers did not show an improved interaction effect size. The best matrices increased the separation power between positive and negative aMCI patients over time compared to the individual biomarkers (matrices effect size ≥0.50 versus individual MRI biomarkers effect size ≤0.48). The similar effect of the terms time, group and interaction showed by the composite measures revealed that all the combinations changed over time in a similar way and had a comparable ability in separating CSF Aβ42/P-tau positive and negative aMCI patients. Subsequently, they were tested for their association with cognitive decline as revealed by the ADAScog13 score (Table 4). A significant association with the ADAScog13 score was reported for all (p < 0.001, standardized β< –0.522) and, in absolute terms, it was stronger than that described for the best individual biomarker, the entorhinal thickness (p < 0.001, standardized β< –0.402).
Best individual biomarkers of disease progression associated with cognitive decline (ADAS-cog13) in Aβ42/P-tau positive aMCI patients to confirm their feasibility as surrogate outcomes of disease progression
Biomarkers were selected based on a preparatory work on the longitudinal characterization of a wide range of brain and peripheral promising biomarkers of prodromal AD [3–5] (see “Materials and Methods section” for details). Linear mixed models included age, sex, education and time as predictors. CA, Cornu Ammonis; GC-ML-DG, Granule cells in the molecular layer of the dentate gyrus.
Best matrices improve the ability of individual biomarkers in separating CSF Aβ42/P-tau positive and negative aMCI patients
Linear mixed models included age, sex, baseline MMSE, total intracranial volume, time, Aβ42/P-tau status, time×Aβ42/P-tau status interaction as predictors. CA, Cornu Ammonis; ent, entorhinal thickness; GC-ML-DG, Granule cells in the molecular layer of the dentate gyrus; LVV, lateral ventricle volume.
Association between cognitive decline (ADAS-cog13) and best matrices in Aβ42/P-tau positive aMCI patients
Linear mixed models included age, sex, education and time as predictors. CA, Cornu Ammonis; ent, entorhinal thickness; GC-ML-DG, Granule cells in the molecular layer of the dentate gyrus; LVV, lateral ventricle volume.
Surrogate outcomes for disease modifier clinical trials
The selected matrices of short-term disease progression were tested for their effect in terms of sample size required in a hypothetical 2-year clinical trial of disease modifiers to observe a 20 and 30% of atrophy reduction, and power of 0.8 (Supplementary Table 1). All matrices reduced, in a range from 11 to 32%, the sample size required compared with the best individual biomarker (Fig. 1). In particular, the matrix needing the lowest number of subjects was the one with two biomarkers, lateral ventricle volumes and the molecular layer of the hippocampus, requiring 84 subjects per arm.
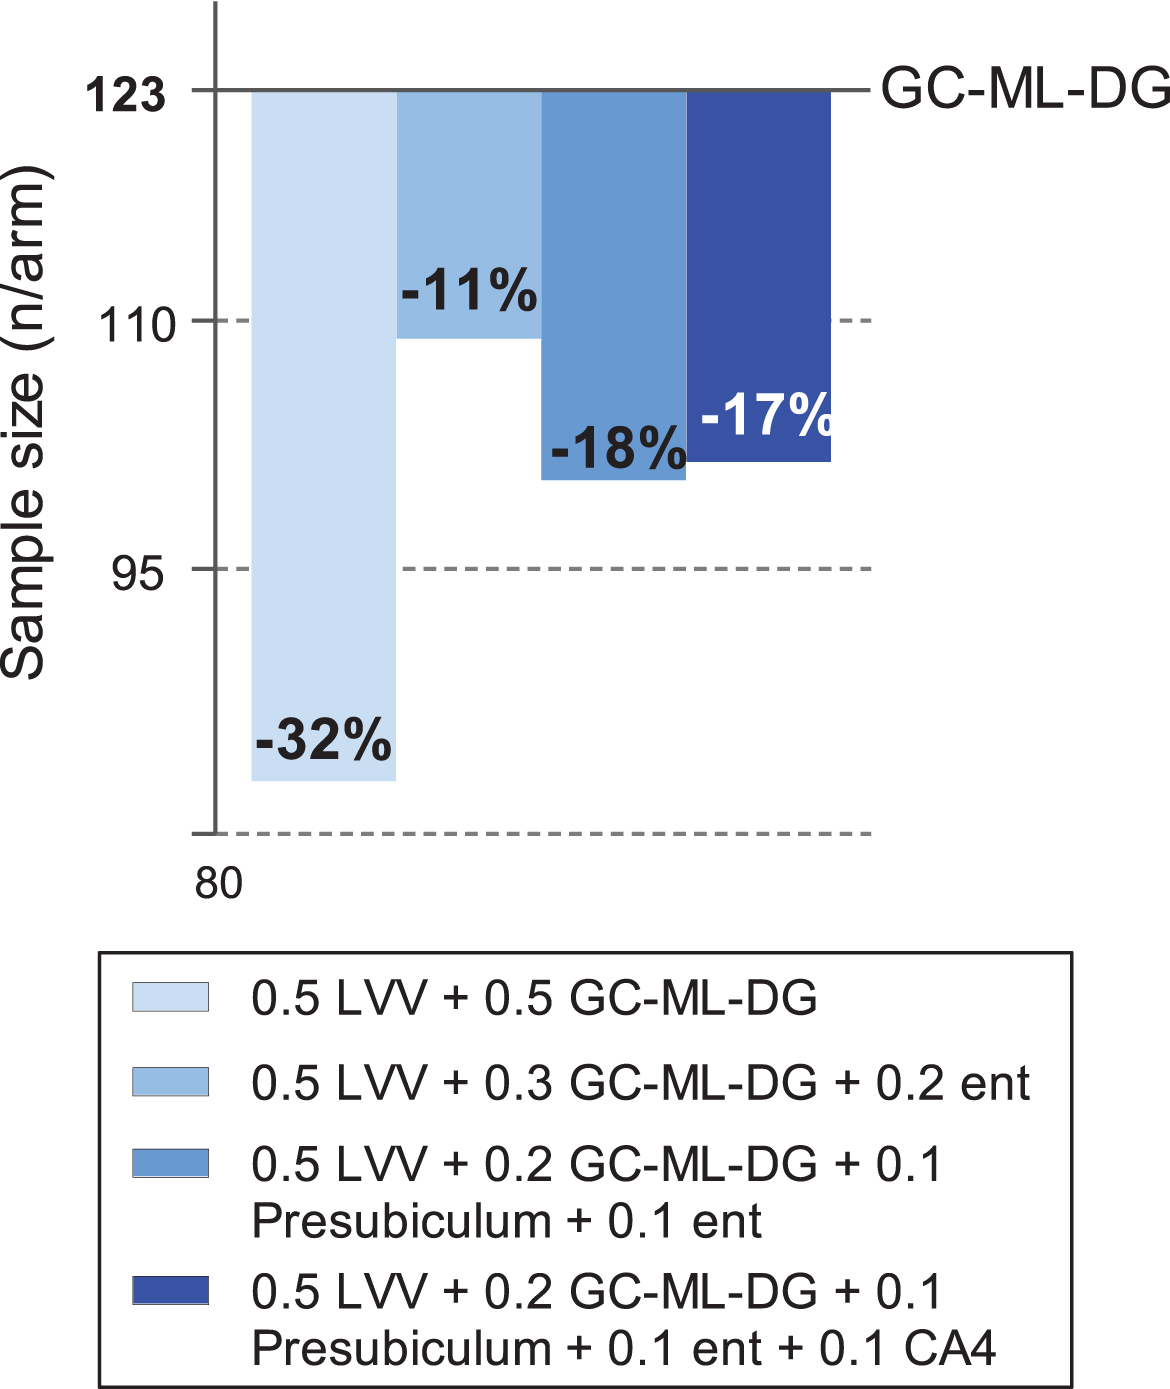
Sample size estimates required in a placebo-controlled trial in Aβ42/P-tau positive MCI patients to observe 20% atrophy reduction of the best weighted matrices compared to the best individual biomarker (GC-ML-DG). Sample size calculations are based on linear mixed models performed in all Aβ42/P-Tau positive assuming a 20% slope reduction of the outcome in a 2-year trial with scans every six months. All calculations were performed by fixing significant level of type I error of 0.05, power equal to 0.8 and not controlling for normal aging. CA, Cornu Ammonis; ent, entorhinal thickness; GC-ML-DG, Granule cells in the molecular layer of the dentate gyrus; LVV, lateral ventricle volume.
DISCUSSION
Using the longitudinal PharmaCog/E-ADNI data, we evaluated a series of structural biomarker matrices to identify the best combination to track disease progression and to be used as ideal surrogate outcomes in clinical trials of disease modifiers. Moreover, we examined which matrix or individual biomarker better explain the variability of cognitive decline in prodromal AD patients.
Considering the wide range of multi-modal biomarkers included in the PharmaCog study (i.e., anatomical and diffusion MRI, rsfMRI, rsEEG, ERPs, blood), we expected to select biomarkers from more than one modality for the computation of the composite measure. However, structural MRI biomarkers were found to be the best choice for monitoring disease progression over 2 years when compared to blood and functional variables. Although structural MRI diffusivity in the fornix, rsfMRI functional connectivity in the left parietal cortex, limbic rsEEG source activity at theta rhythms, and plasma Aβ42 showed significant changes over time in the CSF positive compared to the negative aMCI group, those longitudinal changes were weaker than those reported for MRI biomarkers of cerebral volumes and thicknesses. Conversely, functional connectivity and cortical neural synchronization reflected by rsEEG and ERPs showed an association with CSF status (i.e., positivity to the CSF AD pathologic markers) [5] similar to that described for structural MRI biomarkers, confirming that they are sensitive to disease state and useful for the diagnosis of prodromal AD. However, it is worth noting that the PharmaCog/E-ADNI project applied the best protocols of acquisition and analysis of MRI, rsEEG, ERPs, and blood available in 2010. Therefore, we cannot exclude that the advanced standard operating procedures of data recording and analysis developed after 2010 [27–33] have improved the accuracy of the detection and thus increased the sensitivity of these biomarkers for identifying longitudinal changes. Moreover, EEG and blood analysis were disadvantaged compared to neuroimaging analysis as fewer observation occurred and this may have decreased the statistical power of the respective models. Finally, here we included in the composite computation only the most discriminant biomarkers considering all the modalities as a whole (i.e., MRI, fMRI, rsEEG, ERP, blood). An alternative approach may be the use of a composite multi-modal measurement including the most discriminant biomarkers within each modality, e.g., the most discriminant biomarkers of MRI, the most discriminant biomarkers of fMRI, etc. according to the concept that any modality may bring some non-redundant discriminant information. This latter approach may be not applicable in all clinical trials due to the high costs.
In line with our hypothesis, we found that matrices increased the statistical power of a 2-year clinical trial by reducing the sample size required by individual biomarkers to detect a 20% slowing of atrophy. In the Aβ42/P-tau positive aMCI patients, the most significant gain of power in sample size was obtained by using the matrix composed by two structural MRI biomarkers, the volumes of lateral ventricle and molecular layer of the hippocampus, requiring 84 prodromal AD subjects per arm. This means an increase of 30% in power to detect a drug effect compared to the best individual (MRI) biomarker, namely the granule cells in the molecular layer of the dentate gyrus (GC-ML-DG), which required 123 prodromal AD subjects. Conversely to biomarkers of amyloid pathology, which may reach a ceiling when subjects develop clinical symptoms [34], lateral ventricle enlargement and local hippocampal atrophy measured using MRI have been extensively shown to be sensitive markers of disease progression in aMCI and AD patients [35–40]. To the best of our knowledge, no previous clinical study has explored the possibility to apply composite atrophy outcomes to track disease progression in prodromal AD patients. In line with the present findings, in a cohort of primary progressive aphasia patients, a composite MRI brain atrophy measure required 38% fewer subjects to detect the same percent of atrophy reduction compared with the most discriminant MRI biomarker (i.e., atrophy of the left perisylvian temporal cortex [41]), considered a highly sensitive measure of disease progression in this population [42]. Moreover, we found that, in aMCI patients with brain AD pathology, biomarkers matrices reflected clinically meaningful changes over time, the other key feature of a surrogate outcome [43], and that these associations were stronger that those reported for individual measures. This findings extends those previously reported in healthy subjects [44].
The present methodological approach parallels the modern research testing composite cognitive scores to improve the statistical power to capture effects of interventions on clinical status. As previously mentioned [3], there are some methodological limitations that should be taken into account in the evaluation of the results. Firstly, we did not include control groups of cognitively intact seniors. Thus, the sample size calculation was performed without considering the component due to normal aging. As a consequence, the number of prodromal AD subjects required by a real clinical trial will be probably larger. Secondly, the present results were not cross-validated in an independent population of prodromal AD patients. Such cross-validation is fundamental to demonstrate the benefits of using the proposed matrix of AD progression in future clinical trials of disease modifiers. Thirdly, the MRI results have been obtained on 3T standard MPRAGE images and further analyses with hippocampal scans acquired at higher resolution are required to confirm that the molecular layer of the dentate gyrus is a potential surrogate outcome of disease progression in prodromal AD patients. However, the present findings are of interest for the majority of clinical trials in prodromal AD as they typically use 3T MRI scanners. Fourthly, the present biomarker matrix, including the volume of dentate gyrus of the hippocampus, has the intrinsic limitation to be not sensitive for tracking disease progression in non-amnestic AD clinical presentations. Indeed, those presentation showed predominantly cortical degeneration and medial temporal lobes are relatively spared [45]. Thus, future studies may extend the present methodological approach to other clinical phenotypes of prodromal AD in non-amnesic MCI patients.
To conclude, the present study of the PharmaCog/E-ADNI project suggests that a composite structural MRI biomarker matrix, based on volumes of hippocampal dentate gyrus and lateral ventricle, may be the optimal endpoint to track disease progression in prodromal AD patients over 2 years.
DISCLOSURE STATEMENT
Authors’ disclosures available online (https://www.j-alz.com/manuscript-disclosures/18-1016r1).