
Abstract
Background:
Several automatic tools have been implemented for semi-quantitative assessment of brain [18]F-FDG-PET.
Objective:
We aimed to head-to-head compare the diagnostic performance among three statistical parametric mapping (SPM)-based approaches, another voxel-based tool (i.e., PALZ), and a volumetric region of interest (VROI-SVM)-based approach, in distinguishing patients with prodromal Alzheimer’s disease (pAD) from controls.
Methods:
Sixty-two pAD patients (MMSE score = 27.0±1.6) and one hundred-nine healthy subjects (CTR) (MMSE score = 29.2±1.2) were enrolled in five centers of the European Alzheimer’s Disease Consortium. The three SPM-based methods, based on different rationales, included 1) a cluster identified through the correlation analysis between [18]F-FDG-PET and a verbal memory test (VROI-1), 2) a VROI derived from the comparison between pAD and CTR (VROI-2), and 3) visual analysis of individual maps obtained by the comparison between each subject and CTR (SPM-Maps). The VROI-SVM approach was based on 6 VROI plus 6 VROI asymmetry values derived from the pAD versus CTR comparison thanks to support vector machine (SVM).
Results:
The areas under the ROC curves between pAD and CTR were 0.84 for VROI-1, 0.83 for VROI-2, 0.79 for SPM maps, 0.87 for PALZ, and 0.95 for VROI-SVM. Pairwise comparisons of Youden index did not show statistically significant differences in diagnostic performance between VROI-1, VROI-2, SPM-Maps, and PALZ score whereas VROI-SVM performed significantly (p < 0.005) better than any of the other methods.
Conclusion:
The study confirms the good accuracy of [18]F-FDG-PET in discriminating healthy subjects from pAD and highlights that a non-linear, automatic VROI classifier based on SVM performs better than the voxel-based methods.
Keywords
INTRODUCTION
There is an increasing clinical use of biomarkers for the diagnosis of early-stage Alzheimer’s disease (AD), namely prodromal AD (pAD) or mild cognitive impairment due to AD (MCI-AD). In the research diagnostic criteria proposed by the International Working Group [1 –3] and in the recommendations of the National Institute on Aging–Alzheimer’s Association (NIA-AA) [4 –6], different biomarkers are incorporated, both as an expression of pathophysiological aspects and to increase the diagnosis confidence, especially in the earliest disease stages. Indeed, the positivity of one or more biomarkers, referring to neurodegeneration or amyloidosis, improves accuracy of clinical diagnosis [7]. Furthermore, biomarkers are increasingly used in clinical trials for subject selection and stratification, for safety and proof-of-concept assessments, and for monitoring of treatment effects [8, 9].
One of the main methodological issue to evaluate and establish the diagnostic accuracy is which biomarker to choose time by time, in which temporal progression, but overall how to measure it [10], which is propaedeutic to the even more complex and urgent issue of harmonization. As for neuroimaging biomarkers, they are conventionally evaluated and graded with a visual approach [11, 12], with automatic semi-quantitative tools [13, 14], or both [15 –17].
18F-Fluorodeoxyglucose positron emission tomography (FDG-PET) has been extensively evaluated in the frame of pAD, showing good accuracy in identifying patients subsequently converting to AD dementia [7 , 17–22]. However, agreement on how to complement visual analysis by an expert reader is not yet achieved. Recent literature dealt with the comparison between automatic semi-quantitative methods and visual evaluation of readers with different skills [11 , 23–25]. Semi-quantitative methods were considered more [13, 14] or equally [12] accurate as visual read in differential diagnosis between various forms of dementia [11]. More frequently, semi-quantitative methods were evaluated as an integration of visual analysis to improve the quality of the reading [15], to enhance the inter-rater reliability [16], to increase diagnostic confidence, and to strengthen the diagnostic accuracy in moderately skill readers [17].
These studies were conducted using different software packages aimed at objectively evaluating FDG-PET scans and at overcoming the limitation of visual reading, which is highly variable because it largely depends on the nuclear medicine physicians’ expertise. However, they introduce, in turn, other sources of variation because the semi-quantification tools do have their own strength and limitations and could result in different accuracy [26]. Moreover, the different tools have seldom been currently evaluated in a head-to-head comparison [25, 27].
One such tool that is relatively easy-to-use and freely downloadable from the web is statistical parametric mapping (SPM). While the earliest versions needed a Matlab platform, the most recent stand-alone versions do not. SPM has been extensively used for evaluating the relationships between cognitive functions and brain metabolism [28 –31]. Also, it has been validated for single subject analysis [32] and, more recently, it has been applied in several dementia settings showing nice accuracy of individual maps (SPM-Maps) [33 –35]. Brain FDG-PET standardized images have been evaluated and compared between SPM and NEUROSTAT tools in healthy subjects [36]. Also, spatial normalization of SPM has been compared with the ones obtained from MRI-DARTEL and MRI-SPM8 in MCI patients and controls [37] but, to the best of our knowledge, a head-to-head comparison of FDG-PET analyzed with SPM versus other tools has never been attempted in dementia patients [38].
In this scenario, we capitalized from a previous analysis on FDG-PET data from the European Alzheimer Disease Consortium (EADC) dealing with the comparison between 62 pAD patients and 109 healthy controls (CTR) using a commercial software (i.e., the ‘PALZ score’ embedded in the PMOD package) [39] and an original approach we recently developed, based on Volumetric Regions of Interest (VROI) analysis and statistically approached with Supporting Vector Machine (VROI-SVM) [25].
We applied SPM analysis to pAD and controls using the visual evaluation of individual statistical maps (SPM-Maps) by two blind experts, and two different SPM-based VROI approaches. Then we compared the diagnostic performance of these three SPM tools with that of the other two methods of analysis, namely PALZ and VROI-SVM, with a head-to-head comparison.
METHODS
Subjects
The study was conducted in 62 patients with amnestic mild cognitive impairment (aMCI) who were followed-up until conversion (mean conversion time 22.6±16.0 months, range 6–42) to Alzheimer’s dementia (pAD) and 109 (CTR), already used in a previous study [25] and recruited in five EADC centers, namely Marseille, Amsterdam, Munich, Brescia, and Genoa. Details of patient characteristics can be seen in the previous paper [25]. Briefly, they were 62 patients (34 women and 28 men, age range: 54–86 years, mean: 72.3±8.2 years; mean MMSE score at the time of FDG-PET: 27.0±1.5) with amnestic MCI developing dementia of the AD type (mean conversion time 22.6±16.0 months, range 6–42). One hundred and nine healthy subjects evaluated in the same centers, including 57 women and 52 men (age range: 52–83 years, mean: 66.8±6.5 years; mean MMSE score at the time of FDG-PET: 29.3±1.0) served as controls. Their health status was checked again with a clinical interview after about 1 year (mean: 11.8±4.8 months).
For both patients and controls, MRI evidence of major stroke or brain mass was considered as an exclusion criterion, while white matter hyperintensities, leukoaraiosis, and lacunae did not constitute an exclusion criterion if the Wahlund score was <3 in all regions [40]. Drugs known to interfere with brain metabolism and perfusion were slowly tapered and withdrawn whenever possible, before the neuropsychological and FDG-PET examinations.
The institutional review board of the University of Genoa approved the recording and data treatment procedures involving human participants in this study and all procedures were in accordance with the Helsinki Declaration of the 1975. All subjects signed the informed consent.
Image acquisition
FDG-PET was performed within 2 months from the baseline clinical-neuropsychological examination. Subjects fasted for at least 6 h. Before radiopharmaceutical injection, blood glucose was checked and was <140 mg/dL in all subjects. After a 10 min rest in a silent and obscured room, with eyes closed and ears unplugged, subjects were injected with 185–300 MBq of 18F-FDG via a venous cannula, according to the first guidelines of the European Association of Nuclear Medicine (EANM) [41]. They remained in the room for 30 min after the injection and then moved to the PET room where scanning started approximately 45 min after the injection and lasted another 20 min. Emission scans were acquired in 3-dimensional mode. Images were reconstructed using an ordered subset expectation maximization (OSEM) algorithm in all centers but Amsterdam (filtered back projection). Other details of image acquisition parameters used in the different centers are reported in previous papers [42, 43].
Image analysis
FDG-PET data were subjected to affine and nonlinear spatial normalization into the Talairach and Tournoux’s space using SPM8 (Wellcome Department of Cognitive Neurology, London, UK) implemented in Matlab 7.5 (Mathworks, Natick, Massachusetts, USA). The normalized images were then smoothed with an 8 mm FWHM (Full Width at a Half Maximum) isotropic Gaussian filter and then processed in SPM. All the default choices of SPM8 were followed with two main exceptions. To avoid inconsistencies deriving from the use of the default SPM brain H2O template [44], PET scans were normalized using a customized brain FDG PET template, as detailed elsewhere [45]. Second, with the aim to increase accuracy of FDG-PET analysis, cortical metabolism was normalized to the mean cerebellar counts, as cerebellum is relatively spared by AD pathology, as previously suggested by functional brain imaging studies [46].
Definition of VROI masks
We independently used two SPM-based VROIs. The first VROI derives from a previous correlative study between brain metabolism and the delayed recall score on the Rey Auditory Verbal Learning Test (RAVLT) in a mixed and totally independent group of elderly subjects including subjects with subjective memory complaints and MCI patients [47]. The memory impairment is described as a core feature in pAD [2] with good accuracy in predicting conversion to dementia, especially if combined with brain metabolism [7, 48]. Thus, the VROI-1 highlights the significant cluster of hypometabolism related to memory impairment and includes the bilateral precuneus (BA 7 and 31) and the left inferior parietal lobule (BA40) which were grouped into a unique functional volume of interest (VROI-1) (Table 1, Fig. 1). With this choice, we wanted to highlight those regions potentially useful for distinguishing between pAD patients and CTR.
SPM results of correlation (height threshold: uncorrected p < 0.0001) between Delayed Recall on RAVLT and brain metabolism in 54 subjects with memory complaints (VROI-1) and results of comparison between 109 CTR and 62 patients with pAD (VROI-2)
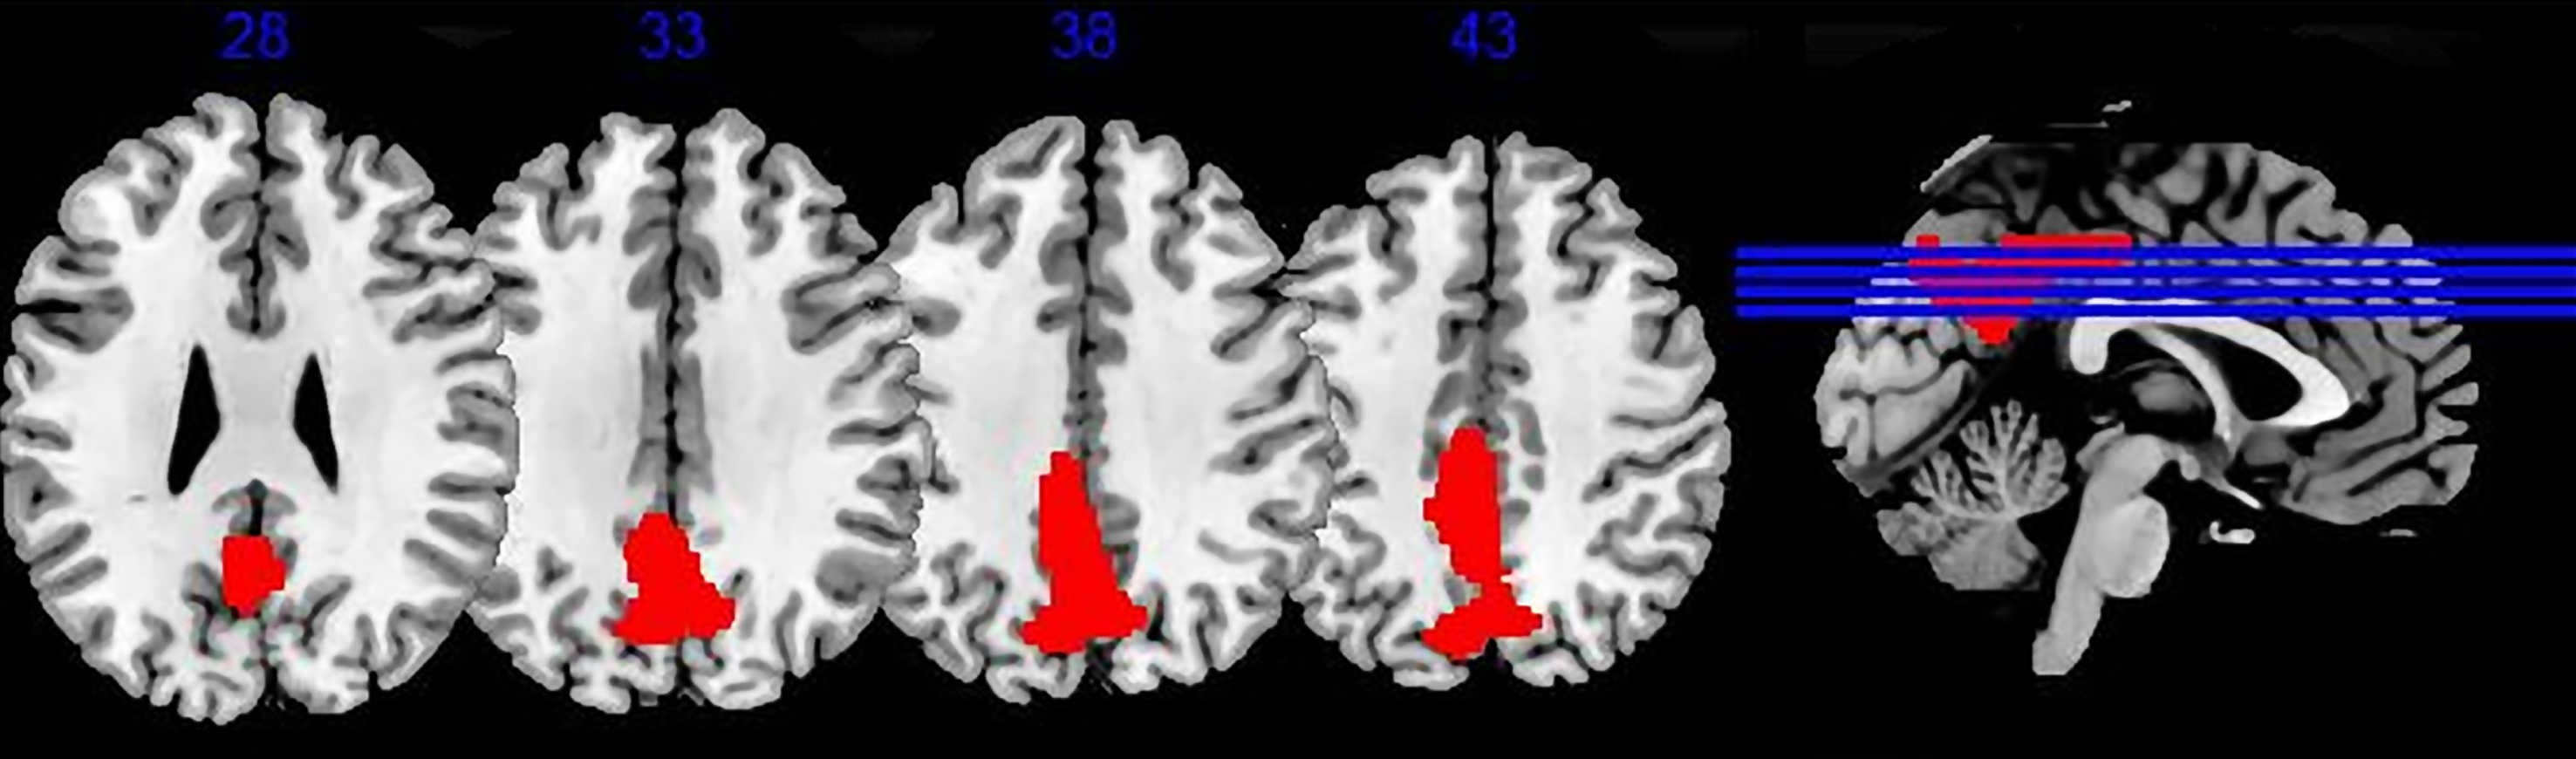
V-ROI 1 Correlation between RAVLT-DR and brain metabolism. Result of positive correlation between RAVLT delayed recall (DR) score and brain metabolism in 54 subjects with memory complaints. Significant correlation was found with p < 0.001 height threshold in left (BA31) and right (BA7, BA31) precuneus and in left inferior parietal lobule (BA40) (data from Brugnolo [47]).
The second VROI has been obtained from the subjects enrolled in the five EADC centers and expresses merely the hypometabolic areas found in the pAD group of 62 patients in comparison with the CTR group (height threshold uncorrected p < 0.001 at voxel level; p < 0.05 FWE-corrected at cluster level). This comparison showed the typical significant cluster of hypometabolism of pAD (Fig. 2) involving posterior parietal and temporal cortices, precuneus, and posterior cingulate gyrus (VROI-2) (Table 1, Fig. 2). VROI-2 only partially overlaps VROI-1. As for VROI-1, since these areas are neighboring and functionally connected, the significant hypometabolic clusters in pAD patients were joined into a unique functional VROI.
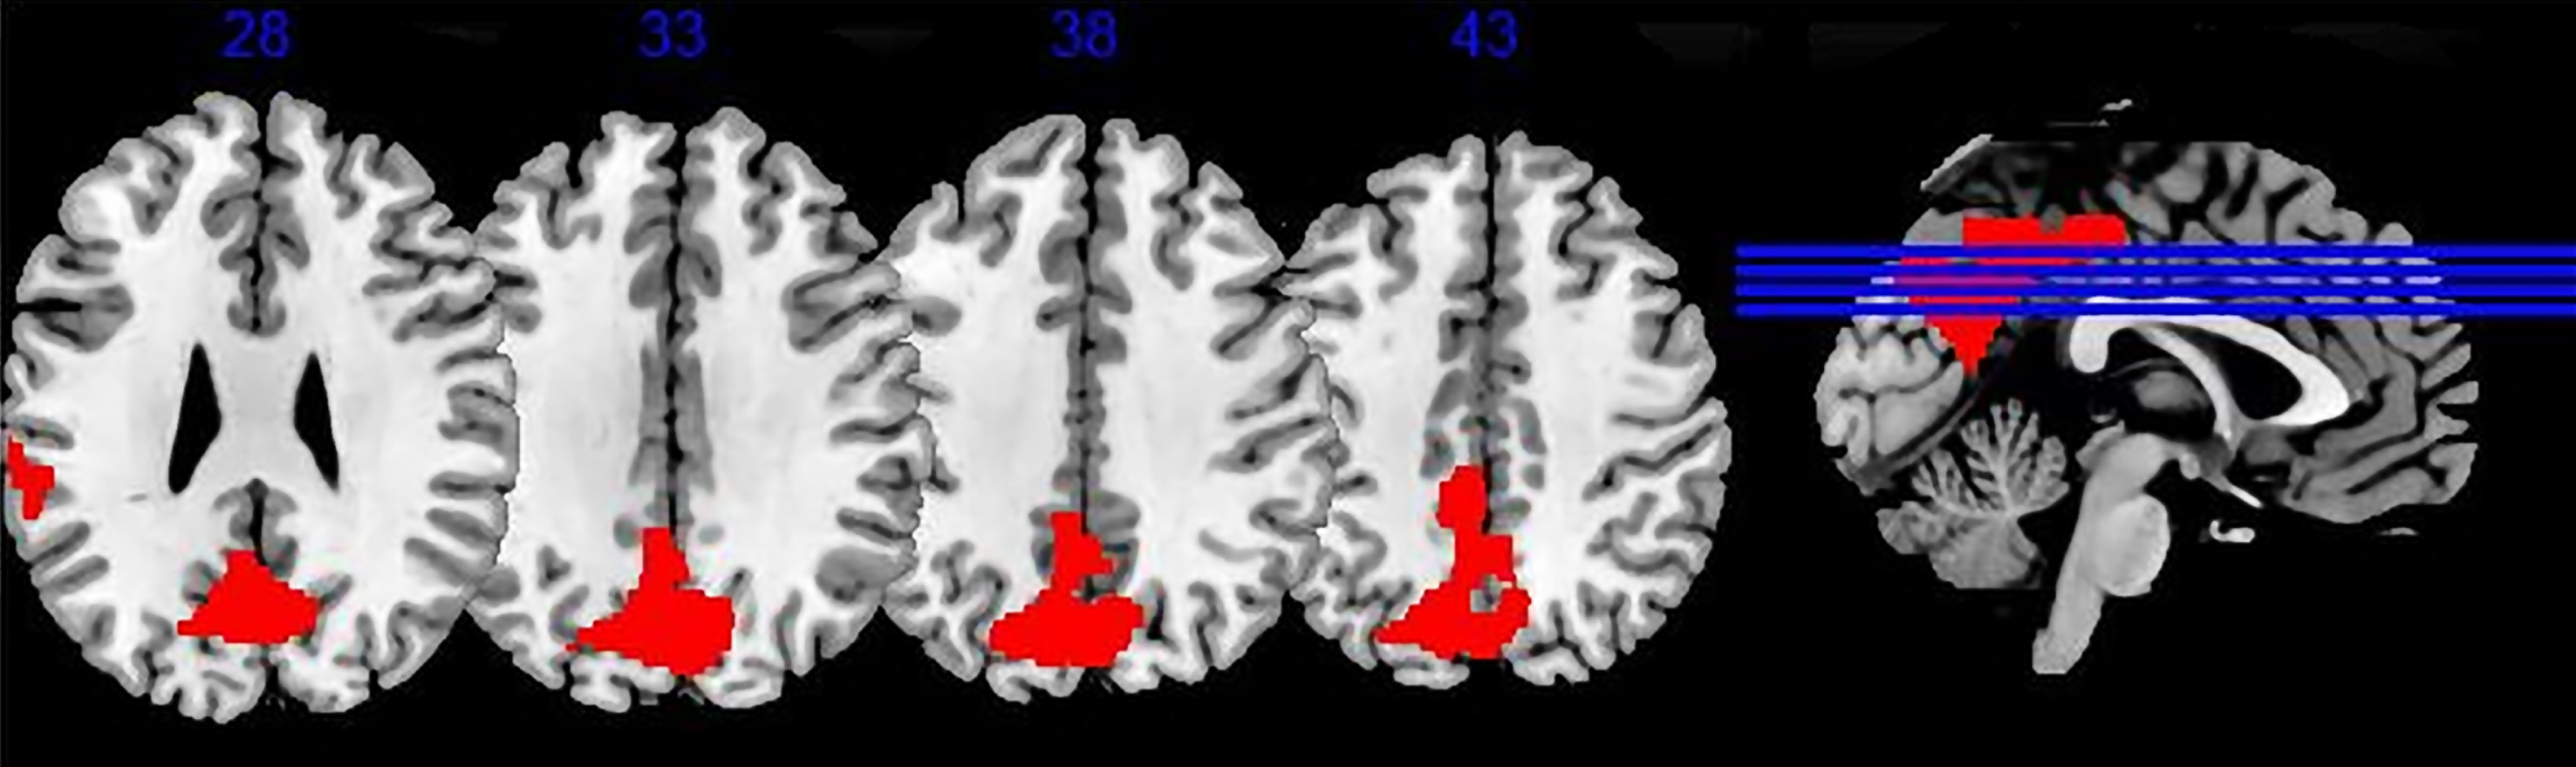
V-ROI 2 Comparison brain metabolism CTR versus pAD. The figure displays regions of significant hypometabolism in red superimposed to a brain rendering. Significant differences were found with left posterior parietal and temporal cortices, and bilateral precuneus and posterior cingulate gyrus.
The mean uptake values of the VROI-1, VROI-2, and cerebellar VROIs included in AAL, as defined by Schmahmann et al. [49] were extracted for each subject by MarsBar software (http://marsbar.sourceforge.net). With the aim of differentiating pAD from controls, cerebellum uptake was used to normalize VROI-1 and VROI-2 as a preliminary step before the subsequent analyses. In fact, the cerebellum is relatively less affected by the AD pathological process and it increases the accuracy in distinguishing AD from controls when is used as the reference region instead of whole brain counts [49, 50].
Visual analysis of individual SPM maps
According to the validation of single-subject comparison procedure (SPM maps) [33], a single subject is compared with a control group and the resulting hypometabolic clusters should then be evaluated as pertaining or not to the AD typical pattern. Hypometabolism in precuneus, posterior cingulate cortex, and temporoparietal regions is closely related to cognitive impairment in early and prodromal phases of AD [51, 52]. The SPM-map uses predefined levels of statistical significance with the aim to highlight specific typical patterns of several neurodegenerative diseases, including AD, even in the early stage.
Each pAD patient was compared with the group of 109 controls using the single-subject analysis tool of SPM8 (height threshold: uncorrected p < 0.001 at voxel level; p < 0.05 FWE-corrected at cluster level, age as nuisance variable).
Following the same procedure, also each control subject was compared with the remaining 108 healthy controls. The resulting individual SPM maps were visually and independently analyzed by two nuclear physicians with more than ten of expertise in neuroimaging who were unaware of group belonging and who dichotomously assigned each map to presence/absence of the typical AD hypometabolic pattern. In 159 out of 171 comparisons, the two readers agreed while for 12 cases agreement was achieved in a second joint session.
VROI-SVM model
As extensively described in a previous paper [25], FDG-uptake values were firstly computed for a set of 90 VROIs drawn from the Automated Anatomical Labeling Atlas [53], normalized by mean cerebellar VROI intensity [46] then reduced to 24 meta-VROIs (12 bilateral) by merging regions with similar anatomo-functional characteristics. Interhemispheric asymmetries (12 values) were also considered and discriminant analysis identified 6 Meta-VOIs and 6 Asymmetry providing the best classification. The selected meta-VOIs were: 1. Parahippocampal Gyrus/Amygdala/Hippocampus/Insula (left), 2. Frontal Cortex (left), 3. Postcentral Gyrus/Precentral Gyrus/Supplementary Motor Area (left), 4. Parietal Cortex (right), 5. Anterior Cingulate (left), and 6. Posterior Cingulate (left).The associated asymmetry values were relevant to: 1. Occipital Cortex, 2. Pallidus/Caudate nucleus/Thalamus, 3. Parahippocampal Gyrus/Amygdala/Hippocampus/ Insula, 4 Orbito-frontal Cortex, 5. Frontal Cortex, and 6. Cuneus/Fusiform/Precuneus.
VROI-SVM analysis was then applied to the set of meta-VROI values using cross-validation to avoid over-fitting.
Evaluation of the PALZ score
PMOD software (PMOD Technologies, http://www.pmod.com) was applied with the ‘Alzheimer’ option for computing the ‘Probability of ALZheimer’ (PALZ), a voxel-based score which was evaluated for each subject. The software compares voxel-by-voxel the individual FDG-PET scan with those of a group of healthy subjects, correcting for age, and takes into account those hypometabolic voxels belonging to the areas which are typically affected in AD, as derived from a large multicenter study [39]. A PALZ score higher than the threshold value in number of hypometabolic voxels means that the patient more likely belongs to the AD group than to healthy controls. The threshold usually adopted by Palz is 11,089, although this value yielded a high specificity (0.92) but a relatively low sensitivity (0.65). According to the paper [25], we have adopted a threshold of 8,116, a better compromise between sensitivity and specificity in MCI patients converted to AD dementia.
As with the other univariate measures (VROI-1 and VROI-2), individual PALZ scores were used in the following statistical analysis independently of the standard threshold.
Statistical analysis
Similarly as for PALZ score and the VROI-SVM approach [25], we computed accuracy, sensitivity, specificity, positive and negative likelihood ratios, odds ratio, and the area under the Receiver Operating Characteristic (ROC) curve (AUC) for VROI-1, VROI-2, and SPM individual maps. To evaluate the accuracy, sensitivity, and specificity of the method, a cut-off value was chosen as the minimum the distance from the upper left corner of the ROC curve (where specificity = sensitivity = 1). In case of SPM individual maps, the procedure based on visual analysis led to a categorical outcome and then to a single pair of sensitivity and specificity values. ROC-AUC was then computed, for consistency with other methods, based on this single point according to the method suggested by Katostaras, without further statistics [54]. In order to compare the accuracies of the different methods, including SPM individual maps, we evaluated the Youden index (sensitivity+specificity –1) [55] which expresses the effectiveness of the discrimination and, unlike conventional accuracy index, is unaffected by sample imbalance between patients and controls. The comparison between pairs of methods was performed by applying the paired samples test for Youden index, suggested by Chen [56], and, considering multiple comparison problem, the significance threshold was set at p < 0.005.
RESULTS
Comparison of receiver operating characteristic AUC values
The cut-off values of VROI-1 and VROI-2 that better distinguish CTR from pAD are 1.175 and 1.165, respectively. VROI-1 discriminated pAD from CTR with 0.72 sensitivity and 0.81 specificity (accuracy: 0.78; Youden index: 0.53; AUC = 0.84). VROI-2 discriminated pAD from controls with 0.75 sensitivity and 0.76 specificity (accuracy: 0.75; Youden index: 0.51; AUC = 0.83). Lastly, individual SPM maps discriminated pAD from CTR with 0.50 sensitivity and 0.98 specificity (accuracy: 0.75; Youden index: 0.48; AUC = 0.79).
According to the previous analyses on the same groups of pAD patients and CTR [25], PALZ discriminated pAD from controls with 0.77 sensitivity and 0.82 specificity (accuracy: 0.80; Youden index: 0.59; AUC = 0.87 while VROI-SVM discriminated pAD from CTR with 0.92 sensitivity and 0.91 specificity (accuracy: 0.80; Youden index: 0.82); AUC = 0.95 (see Table 2 and Fig. 3 for full details).
Values of accuracy parameters of measures of the 5 semi-quantitative tools
For each method but SPM-Maps AUC was computed by conventional trapezoidal rule and confidence intervals were estimated by the bootstrap method [63]. *For SPM-Maps AUC was computed with the method suggested by Katostaras [54] based on a single point and was reported as purely indicative, without confidence intervals.
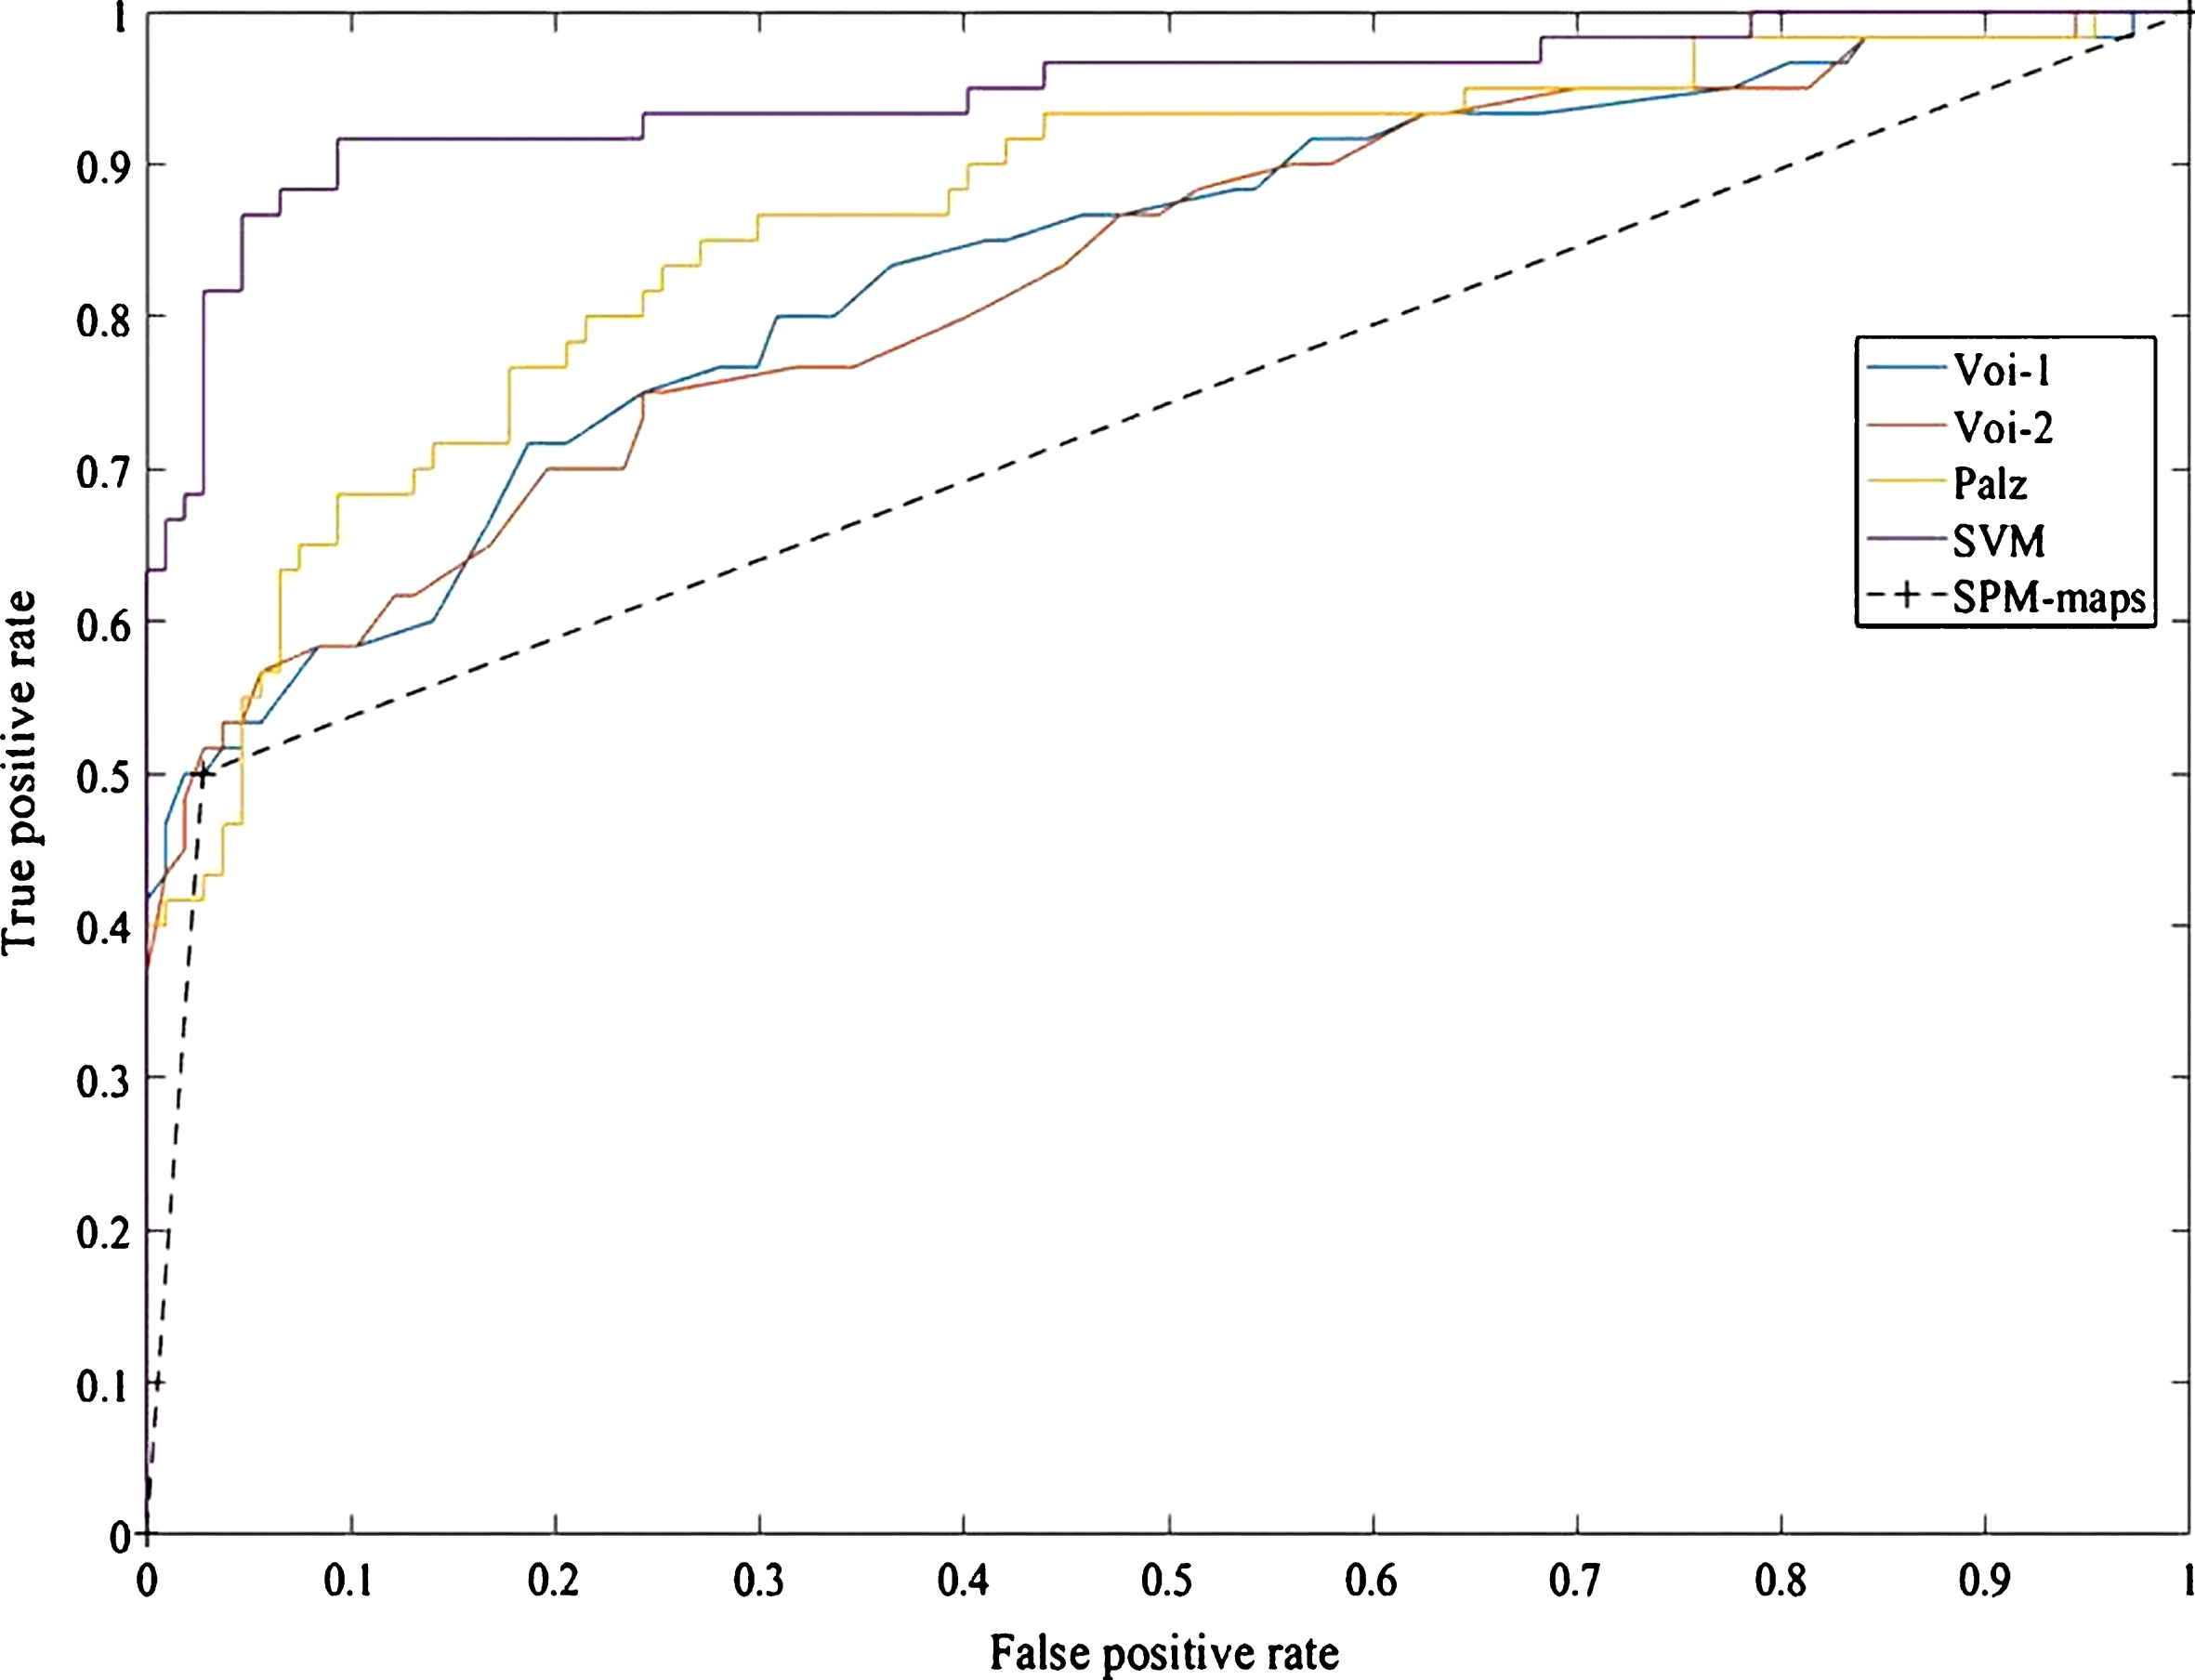
Receiver Operating Characteristic curves (ROC): classifier comparisons between CTR versus pAD. Area under the curve (AUC) for VROI-1, VROI-2, SPM individual maps, PALZ, and VROI-SVM. VROI-1 AUC = 0.84; VROI-2 AUC = 0.83; SPM maps AUC = 0.79; PALZ AUC = 0.87, and VROI-SVM AUC = 0.95. (see Table 2 and Fig. 3 for full details). Pairwise comparisons of Youden index shows only significant differences were between VROI-SVM and the other methods (see Table 3 for full details).
Pairwise comparisons of Youden index did not show statistically significant differences in diagnostic performance between VROI-1, VROI-2, PALZ score, and SPM maps. The only significant differences were between VROI-SVM and the other methods, namely VROI-1 (z = 5.05), VROI-2 (z = 5.55), PALZ (z = 4.39), and SPM-Maps (z = 6.05), all with p < 0.0001 (see Table 3 for full details).
Comparisons between results of semi-quantitative tools according to Youden index
Pairs of methods have been compared using the Youden Index. Results reported in Table 3 shows that VROI-SVM significantly differs from VROI-1, VROI-2, PALZ, and SPM-Maps while these four methods do not differ among them.
The rate of true and false positives showed an appreciable variation among the centers in which data were recorded: the lowest specificity was observed when PALZ score was applied to data from Brescia (0.67, with selected threshold at 8,116) while low sensitivity values were observed for data from Munich (VROI-SVM: 0.77, VROI-1, VROI-2, and PALZ: 0.62, SPM-Maps: 0.39) and Genoa (VROI-1:0.55, VROI-2:0.50, and SPM-Maps: 0.33). High sensitivity values (0.80–1.0) were observed for data from Amsterdam. Overall, VROI-SVM yielded specificities above 0.85 and sensitivities above 0.77 and PALZ, which was globally less accurate, was above 0.67 and 0.62, respectively. The heaviest effect concerned the drop in sensitivity involving VROI-1, VROI-2, and SPM-Maps when data from Genoa and Munich were considered.
DISCUSSION
There are several FDG-PET semi-quantitative methods (semi- or fully automatic) to assist nuclear medicine physicians in interpreting images and to support them in the diagnosis of neurodegenerative diseases, though large sample studies comparing their performance are rare [27]. In this study, three SPM-based analysis methods were compared with PALZ and VROI-SVM with the aim to evaluate their accuracy in distinguishing pAD patients from healthy controls.
The main result is that the three SPM-based approaches (individual SPM-Maps, VROI-1, and VROI-2) have moderate accuracy (ranging from 0.76 to 0.81, Youden index from 0.48 to 0.53), similar to PALZ score (accuracy: 0.8, Youden index: 0.59), all being significantly less accurate than the VROI-SVM approach, reaching 0.91 accuracy and 0.82 Youden index.
To the best of our knowledge, fourteen studies have evaluated the diagnostic accuracy of FDG-PET for detecting MCI patients who later converted to AD dementia [57] but only two studies, not included in the review cited above, used a head-to-head methodology to compare different approaches [25, 27].
In the Cochrane review about the semi-quantitative FDG-PET methods for detecting MCI patients who would eventually convert to AD dementia, sensitivity is reported to range between 0.25 and 1 and specificity between 0.15 and 1, according to the different studies. It has been argued that the lowest among these values might not be representative of real FDG-PET accuracy in MCI, but instead they could depend on methodological issues [17]. However, in that review the estimated sensitivity from the summary ROC curve at the median specificity of 0.82 was 0.76 [57]. These are very similar values to those we achieved with the three SPM-based approaches and PALZ score, and a little better than a previous metanalysis (mean values of sensitivity and specificity: 0.78 and 0.74, respectively) [58].
In summary, the analysis of literature shows a heterogeneity of sensitivity and specificity values, but average values between 0.75–0.80 have consistently been reported, although with non-trivial differences between methods in head-to-head comparisons [27].
As for the results of the present study, some considerations can be made. VROI-1, VROI-2, SPM-Maps, and PALZ are based on a different rationale in comparison with VROI-SVM. The three SPM-based approaches and PALZ are indeed based on univariate voxel-by-voxel comparisons aimed to detect hypometabolic regions associated with AD neurodegeneration while VROI-SVM is based on multivariate analysis. The ways to compute the thresholds are not homogeneous. In VROI-1 and VROI-2, thresholds are obtained by the comparison between patients and controls according to the ROC procedure. In SPM-maps approach, hypometabolic regions are detected by the statistical comparison between the subject under consideration and a control group of healthy subjects and the assessment of hypometabolic pattern is entrusted to subjective evaluation of the examiner. In this case, the distinction between CTR and pAD depends on two thresholds, the first one is represented by the significant voxel values in SPM and the second one is the evaluation of the examiner. Finally, in PALZ the AD-related hypometabolic regions and thresholds are selected a priori. In all these methods, the particular imaging signals are contrasted voxel-by-voxel between pAD and Controls. In this way, interconnections between the brain regions cannot be evaluated.
On the other hand, VROI-SVM is based on multivariate analysis of a set of pre-defined anatomo-functional meta-VROIs and, by the comparison between pAD and CTR, produces a model in which the weighted contributions of different meta-VROIs are represented along with their relationships. The model fitting also included the selection of the best set of discriminating meta-VROIs where 6 of them were retained along with 6 asymmetry values. The model can be applied to a single subject to assess his/her association with CTR or pAD group.
VROI-SVM selected more extended areas than the other methods: in particular, it included some hypometabolic areas, also considered by the other methods, but also included some relatively spared areas, such as the sensorimotor cortex. This finding raises an intriguing methodological issue, i.e., the higher the difference between affected and relatively spared regions, the higher the probability of an abnormal finding, as discussed by other authors [18] and confirmed in the previous paper [25]. These peculiarities are completely ignored by SPM and PALZ tools. Furthermore, six inter-hemispheric VROI asymmetries were included in the VROI-SVM whereas they are not evaluated at all by either PALZ or SPM. Yet, the human eye strongly relies on concomitant evaluation of the same structure in the two hemispheres during reporting (i.e., asymmetry evaluation) and thus our findings with VROI-SVM are closer to what is highlighted by the nuclear medicine physician by visual reading [17]. Unlike the other methods, grounded on voxel-based statistical analysis, VROI-SVM partitions brain images into a limited set of VROIs, drawn from AAL-Atlas [53], and merged into 24 VROIs with similar anatomo-functional characteristics) and analyzes the distribution of metabolism among these VROIs: this procedure could have facilitated the extraction of salient features and relationships to be included into the model.
Using VROI-SVM, the Parahippocampal Gyrus/Amygdala/Hippocampus/Insula (left) describes the highest ranking in the discrimination between CTR and pAD. Previous studies conducted with SPM methodology frequently failed to show hypometabolism of these areas in subjects with MCI which could be a bias deriving from smoothing and normalization procedure in SPM [59] possibly accounting for lower accuracy at least in part. Last, regarding SPM-Maps they in turn need to be evaluated by an expert reader [33], thus the limitation of visual reading of raw images is only partially overcome.
A result that deserves to be highlighted is that using a VROI approach, both SPM- or SVM-based, a cut-off value can be identified separating at best pAD patients from controls, similar to PALZ score. VROI-1 and VROI-2 metabolic values are easy to be computed using the proper VROI masks, they can be compared with relevant cut-offs, do not need a control group and may facilitate comparability of quantitative results among centers, as suggested by Landau et al. [7]. For VROI-1 and VROI-2, we obtained cut-off values of 1.175 and 1.165, respectively. As for the VROI-SVM model, it was derived in these groups of pAD patients and controls, which is an obvious limitation, but a cross-validation has been applied through the leave-one-out approach to mitigate overfitting and, more important, the VROI-SVM has now been validated in an independent and larger population, showing similar accuracy between AD patients and controls [60]. The next step requires a software implementation of the model with relevant thresholds for the application in research or clinical setting. Nevertheless, the multivariate analysis based on principal component analysis [61] and independent component analysis [62] seems a promising approach to identify pAD tracing the early phase of brain network disaggregation in AD.
An appreciable variability among the centers was observed for the classification performance of the different methods. This can be ascribed to various factors, such as minor differences in the data acquisition and preprocessing or differences in the composition of samples, which can include less advanced or borderline cases. A detailed analysis of these factors was not included in this study considering the relatively limited size of sub-samples. As discussed in [60], accurate standardization of data acquisition and preprocessing is a prerequisite for the reliable application of diagnostic tools; however, a certain variability among recording centers may remain due to different equipment and specific characteristics of local population. For this reason, the training of multivariate models on extensive multicentric datasets is essential for the extraction of the main common features characterizing the pathological process favoring generalization of results and then supporting clinical diagnosis.
In conclusion, classification of pAD patients and normal controls is achieved through FDG-PET using results deriving from univariate comparison with about 80% accuracy, a figure raising to about 90% when multivariate, VROI-based analysis approach are used. These results confirm the potential role of FDG-PET semi-quantification in dementing disorders while pointing out the advantage of multivariate tools in identifying with greater accuracy MCI patients at higher risk of conversion to AD dementia [26].
DISCLOSURE STATEMENT
Authors’ disclosures available online (https://www.j-alz.com/manuscript-disclosures/18-1022r1).