



Abstract
Background:
Obesity, insulin resistance, and type 2 diabetes are established risk factors for the development of Alzheimer’s disease (AD). Given this connection, two drugs, metformin (MET) and resveratrol (RESV), are considered for the clearance of amyloid-β peptides through AMPK-mediated activation of autophagy. However, overactivation of AMPK observed in late-stage AD brains and relationships between AMPK and neurogenesis (through mTORC1 inhibition), questions treatment with these drugs.
Objective:
To examine if MET and/or RESV supplementation activates brain AMPK, regulates markers of autophagy, and affects markers of neuronal health/neurogenesis.
Methods:
8-week-old male C57BL/6J mice were fed a low (N = 12; 10% kcal fat; LFD) or high fat diet (N = 40; 60% kcal fat; HFD) for 9 weeks to induce insulin resistance and obesity. HFD mice were then treated with/without MET (250 mg/kg/day), RESV (100 mg/kg/day), or COMBO (MET: 250 mg/kg/day, RESV: 100 mg/kg/day) for 5 weeks. Hippocampus and prefrontal cortex were extracted for western blotting analysis.
Results:
Cortex AMPK (T172) and raptor (S792, the regulatory subunit of mTORC1) phosphorylation were upregulated following RESV, COMBO treatments. mTOR (S2448) and ULK1 (S555) activation was seen following MET, COMBO and RESV, COMBO treatments, respectively, in the cortex and hippocampus. p62 content was decreased following RESV, COMBO, with LC3 content being increased following RESV treatment in the cortex. Brain derived neurotropic factor (BDNF) was significantly decreased following RESV, COMBO, and synaptophysin following all treatment in the cortex.
Conclusion:
These results demonstrate that while treatments upregulated markers of autophagy in the prefrontal cortex, reductions in neuronal health markers question the efficacy of AMPK as a therapy for AD.
INTRODUCTION
Alzheimer’s disease (AD) is a neurodegenerative disease with a pathology that consists of hyperphosphorylation of tau protein as well as the aggregation of amyloid-β (Aβ) proteins into plaques, resulting in neuronal damage and significant impairments to both memory and cognitive function [1]. As incident rates of AD have been steadily increasing over the past decade [2], considerable research has been conducted to ascertain the progression of the disease as well as its associated risk factors. Recently, metabolic diseases such as obesity, insulin resistance, and type 2 diabetes (T2D) have been to linked to the development of sporadic AD [1–4]. Indeed, recent literature has shown that obesogenic diets, resulting in insulin resistance, accelerate AD-like pathophysiological changes in the brain [5, 6] and has led some to classify AD as a metabolic disorder. Therefore, the use of drugs currently prescribed for the treatment of obesity and T2D, namely metformin (MET) and resveratrol (RESV), may represent a novel therapeutic approach for treatment of AD.
The rapid rise in obesity and related comorbidities, such as insulin resistance, along with increases in neurodegenerative diseases, such as AD, has cast light on the relationship between body and brain health. Recent reviews [7, 8] describe AD as a metabolic disease and highlight the importance of examining interventions aimed at reversing or improving alterations in metabolic diseases for brain health. Sporadic AD is a multifactorial disease involving several different mechanisms, thus making the modeling of the disease in animals difficult. However, models of diet induced obesity, insulin resistance, and type 2 diabetes provide insight into the early features of AD. Specific to the pathological hallmarks of AD, diet-induced obesity has been implicated in accelerating Aβ production [5, 9–13]. For example, high fat feeding of wild type C57BL6/J mice has resulted in increased brain BACE1 and AβPP protein content, as well as Aβ peptides [14, 15]. Sprague Dawley rats fed a high-sugar and high-fat diet for 12 months exhibited increased brain Aβ peptides and phosphorylated tau as early as 6 months [16]. Together, these studies demonstrate that obesity and the associated disturbances in metabolic health can promote AD-like neuropathology. This work further highlights the importance of examining the potential for early intervention, before neurodegeneration becomes clinically manifested by increases in Aβ pathologies and is during the time period where metabolic abnormalities may be reversed. Diet induced obesity has been shown to alter brain metabolism by impairing brain-glucose uptake and brain-insulin signaling [5], as well as significant impairments in mitochondrial function and health [17, 18]. These impairments are also accompanied by dysregulation of the “Master Regulator of Metabolism”, AMP-activated protein kinase (AMPK) [19, 20]. These perturbations in brain metabolism are considered a major factor linking T2D and obesity to the progression of AD [20–22]. MET and RESV are commonly known for beneficial effects on glucose homeostasis in insulin resistant states, such as T2D. MET is a class of the biguanide drug family and it is the most commonly prescribed drug for the management of T2D, while RESV (trans-3,4′,5-Trihydroxystilbene) is a naturally occurring polyphenolic compound found in the skin of grapes and in high concentrations in red wine. Both MET and RESV have been shown to be beneficial in restoring whole-body glucose and insulin sensitivity through the activation of AMPK, which has direct effects on restricting cellular anabolic processes while activating energetically restorative processes such as mitochondrial proliferation/health, ATP production, and increased glucose-uptake [23–25]. AMPK is also responsible for the upregulation of autophagic pathways through phosphorylation of the autophagy/mitophagy initiator unc-51-like autophagy-activating kinase 1 (ULK1), which in the case of AD promotes clearance of free Aβ, preventing the formation and growth of Aβ plaques [24–27]. Of particular importance in the brain, are AMPK’s effects on cellular growth and proliferation through the mechanistic target of rapamycin complex (mTORC). Under conditions of energetic stress, AMPK inhibits the mTOR complex in order to activate ULK1 for the upregulation of autophagy/mitophagy pathways [24, 28]. Conversely, under nutrient-rich conditions, mTOR upregulates cellular growth and directly inhibits the activation of autophagic pathways to preserve cellular integrity [20, 29]. In the brain, mTOR plays a crucial role in neuronal development for the regulation of dendritic growth and branching as well as in initiating protein synthesis and transcription for the establishment of long-term potentiation (LTP) and synaptic plasticity [30–32]. AMPK activation has been shown to directly affect LTP and neuronal growth through inhibiting mTOR [32–34]. As such, the relationship between AMPK and mTOR signaling make the treatment of AD through the use of AMPK activating drugs (such as MET and RESV) questionable. While increased free Aβ peptide degradation and improved brain-insulin sensitivity have been shown to be beneficial toward alleviating AD pathology, further impairments to neuronal networks due to pre-existing plaques as well as reduced synaptic growth and plasticity could remain detrimental to patients. Therefore, the purpose of this study is to examine the effects of MET and RESV on AMPK and mTOR signaling in the brain. Further, we aim to explore the downstream effects in regard to autophagy and markers of neuronal health.
METHODS
Animals
Animal protocols were approved by the University of Guelph Animal Care Committee and met Canadian Council on Animal Care (CCAC) guidelines. 8-week-old male C57BL/6N mice from Charles River (N = 52) were housed individually following a normal 12:12 h light:dark schedule with ad libitum access to food and water. As previously described [35], the mice were then randomly assigned to either a low fat diet (LFD, N = 12; 10% kcal from fat; Research Diets, New Brunswick, NJ; CAT# D12450B) or high fat diet group (HFD, N = 40; 60% kcal from fat; Research Diets, New Brunswick, NJ; CAT# D12492) and the dietary intervention proceeded for 9 weeks (Table 1). There were no significant differences in body mass between the LFD and HFD groups at the onset of the diet. Animal weights were monitored daily and glucose and insulin tolerance tests completed in the final week of the dietary intervention. HFD mice were then separated such that body weight and glucose/insulin tolerance were similar and assigned to one of 4 groups (N = 10): control, metformin (MET; 250 mg/kg/day), resveratrol (RESV; 100 mg/kg/day), and combined (COM; MET: 250 mg/kg/day and RESV: 100 mg/kg/day). As previously demonstrated, the combination of both MET and RESV has shown an additive benefit toward improving whole-body glucose and insulin tolerance [35]. As such, a combination of both was also used in order to assess an additive effect on AMPK activation and autophagy. Doses of RESV and MET used are similar to previous studies [35–40]. Drugs were administered through food in powdered form with concentrations determined by the average daily consumption of the groups. The drug intervention continued for 4 weeks. After 4 weeks, glucose and insulin tolerance were tested.
Macronutrient composition of the low and high fat diets used, measured as both a percentage of total grams and percentage of total kilocalories
Total kcal/g is also displayed.
Glucose and insulin tolerance
Intraperitoneal glucose and insulin tolerance tests (IPGTT and IPITT) were performed as measures of glucose homeostasis. For the IPGTT, mice were fasted for 6 h prior to an IP injection of glucose (2 g/kg BW). For the IPITT measures, food was removed immediately prior to an IP injection of insulin (0.5 U/kg). Blood glucose concentrations were determined via tail vein sampling using a hand-held glucometer (Freestyle Lite, Abbott). IPGTT and IPITT measures were performed 48 h apart as previously described [35, 39], with mice given ad libitum access to their respective diets between tests.
Tissue collection
At the end of 5 weeks of treatment, and 72 h following the last tolerance test, mice were anaesthetized with sodium pentobarbital (5 mg/100 g, IP injection). Brains were excised and the left and right prefrontal cortex and hippocampus were dissected and flash frozen in liquid nitrogen and stored at –80°C for future analysis by western blotting.
Western blotting
Samples were homogenized in 10x homogenization buffer by weight (1 ml of NP40 Cell Lysis Buffer (Life Technologies; CAT# FNN0021) supplemented with 34μL phenylmethylsulfonyl fluoride and 50μL protease inhibitor cocktail (Sigma; CAT# 7626-5 G, CAT# P274-1BIL) using a FastPrep-FP120 Tissue Homogenizer (Savant) as previously described [5]. Homogenized samples were centrifuged at 4°C for 5 min at 10000 g and the supernatant collected for both hippocampus and pre-frontal cortex. A bicinchoninic acid assay was performed to determine protein content of the homogenate [41]. Equal amounts of protein were then electrophoretically separated on 10% SDS-PAGE gels and transferred to nitrocellulose membranes (GE Life Science Ca. 10600002, 0.45μm). Membranes were blocked for 90 min at room temperature in 5% non-fat dry milk-TBST (tris-buffered saline/0.1% tween 20). Membranes were then incubated in primary antibody diluted 1:1000 in 5% BSA (Bovine Serum Albumin)-TBST overnight with gentle agitation at 4°C. Following a 1 h incubation at room temperature with appropriate secondary antibodies (Donkey anti-rabbit IgG (H+L) 711-035-152, Goat anti-mouse IgG (H+L) 115-035-003 Jackson Immunoresearch), in 1% non-fat dry milk-TBST, membranes were washed and proteins visualized by Western Lightning Plus-ECL using a Flourochem HD2 imager (Cell Biosciences) and bands quantified using Alpha Innotech software (Santa Clara, CA). A representative ponceau stain was measured and analyzed for each membrane to ensure equal loading (<10% variability across the membrane). AMPK activation was assessed through total (Cell Signaling #2531) and phosphorylated AMPK (T172, Cell Signaling #2754) concentrations. The extent of mTOR inhibition was determined by measuring the total ULK (Cell Signaling #8054) and phosphorylation of ULK1 (S555, #5869) as well as total (Cell Signaling #2971) and phosphorylation mTOR (S2448, Cell Signaling #2971; total mTOR Cell Signaling #2972), total (Cell Signaling #4308) and phosphorylated TSC2 (S1387, Cell Signaling #5584), and total raptor (Cell Signaling #2280) and phosphorylated raptor (S792, Cell Signaling #2083). Markers of autophagy were measured using total content of SQSTM1/p62 (Cell Signaling #39749) and LC3B (Cell Signaling #3868). Synaptophysin (Cell Signaling #5461) and BDNF (Santa Cruz SC-65514) was measured as markers of neuronal health.
Statistical analysis
Differences in protein content and phosphorylation were determined using one-way ANOVA followed by a Tukey’s post hoc test. Values found to deviate from the group mean by 2 SD were considered outliers and removed from one-way ANOVA analysis. A Shapiro-Wilk test for normality was conducted and in cases where data were not normally distributed, the data was logarithmically transformed. A value of p < 0.05 was considered significant. All data are reported as mean±SEM. ANOVA results with degree of freedom are given in the main text as well as each figure legend.
RESULTS
Body weight, glucose, and insulin sensitivity
Data for body weight and glucose and insulin tolerance testing was previously reported (Table 2) [35]. Briefly, prior to treatment, the body weights of all high-fat fed groups (HFD, MET, RESV, and COMBO) were significantly greater than that of the LFD mice. Importantly, there were no differences seen in body weight between the HFD groups. 9 weeks of high-fat feeding was shown to significantly impair glucose and insulin tolerances as seen by the reduced ability to clear glucose in response to high glucose or insulin [35]. 5 weeks of treatment with MET (231.28±12.24 mg/kg/day), RESV (93.68±3.51 mg/kg/day) or COMBO (MET 232.01±17.12 mg/kg/day; RESV 92.77±6.92 mg/kg/day), had no effect on HFD induced weight gain with HFD groups retaining significantly higher body weights than LFD after 14 weeks [35]. Post-treatment whole-body IPGTT revealed that HFD glucose sensitivity remained significantly reduced compare to LFD, and treatment with MET and RESV alone did not improve glucose sensitivity as they showed no significant difference from HFD, while COMBO showed significantly lower AUC compared to HFD [35]. Similar to IPGTT, HFD showed significantly impaired insulin sensitivity relative to LFD. However, while not showing significant improvements in insulin sensitivity when compared to HFD, RESV also did not show differences compared to LFD. MET and COMBO showed significant improvements in insulin sensitivity from HFD following treatment (Table 2) [35].
Body weight and glucose and insulin tolerance area under the curve at onset of treatment and post-treatment
Percent change in body weight represented as mean±SEM with significance (p < 0.05) represented by letter: adenotes difference from LFD, bdenotes difference from HFD. Courtesy of Frendo-Cumbo et al. [35].
AMPK activation
In order to assess the extent of AMPK activation in the brain as a response to both drugs, AMPK activation was determined via phosphorylation of the T172 site which is required to increase AMPK activity. AMPK T172 phosphorylation was significantly reduced following the HFD and restored in the prefrontal cortex relative to LFD following both RESV and COMBO treatments (Fig. 1 Top, FAMPK(4, 49) = 3.588, p = 0.012). MET treatment had no effect on restoring AMPK phosphorylation (Fig. 1 Top). No change in AMPK phosphorylation was observed following any treatments in the hippocampus relative to LFD (Fig. 1 Bottom; FAMPK(4, 34) = 0.5382, p = 0.677).

AMPK activation (T172) for both pre-frontal cortex and hippocampal regions of the brain relative to LFD. Percent change represented as mean±SEM, significance (Cortex: FAMPK(4, 49) = 3.588, n = 54, p = 0.012; Hippo: FAMPK (4, 34) = 0.5382, n = 39, p = 0.677) represented by letters.
mTORC inhibition and autophagy activation
In order to assess the effects of HFD and AMPK activation on mTORC, the phosphorylation of two subunits of mTORC were assessed: raptor S792, which is directly phosphorylated by AMPK to inhibit mTORC1 formation, and mTOR 2448 which is required for the formation of both mTORC1 and mTORC2 and is often cited as a marker of mTORC activity [42]. While mTOR S2448 phosphorylation was not seen to be significantly upregulated following HFD. However, there was significant mTOR S2448 upregulation following both the MET and COMBO treatments in both hippocampus and cortex, indicative of MET activation of mTOR (Fig. 2, Cortex: FpmTOR(4,43) = 2.730, p = 0.037; Hippo: FpmTOR(4,34) = 2.884, p = 0.037). Specifically, in the hippocampus, MET and COMBO mTOR S2448 phosphorylation were both seen to be significantly upregulated compared to LFD with COMBO being significant relative to LFD, HFD, and RESV (Fig. 2 Bottom). mTOR activation in the prefrontal cortex following MET treatment was found to be upregulated relative to HFD and RESV while the COMBO treatment only showed significance relative to RESV. Raptor S792 phosphorylation was seen to be significantly upregulated following all drug treatments relative to LFD in the cortex (Fig. 2 Top, Fpraptor(4,43) = 2.730, p = 0.042). However, similar to the differences in hippocampal/cortex activation of AMPK, there was no significant change in raptor phosphorylation following any treatment in the hippocampus (Fig. 2 Bottom, Fpraptor(4, 33) = 0.740, p = 0.571). Interestingly, direct AMPK activation of ULK S555 for both hippocampus and cortex was seen to be restored following RESV and COMBO treatments relative to HFD (Fig. 3, Cortex: FULK(4, 44) = 3.577, p = 0.012; Hippo: FULK(4, 34) = 2.661, p = 0.049). To establish if the increased raptor and ULK phosphorylation correlated to changes in markers of autophagy, two markers of autophagosome formation, LC3B and SQSTM/p62, were measured. No change in either of these markers was seen in the hippocampus (Fig. 4 Bottom, FSQSTM(4, 30) = 0.825, p = 0.518, FLC3B(4, 32) = 0.576, p = 0.682). However, significant decreases in SQSTM/p62 following RESV and COMBO treatments (Fig. 4 Top FSQSTM(4,44) = 2.832, p = 0.036) and significant increases in LC3B following RESV (Fig. 4 Top, FLC3B(4, 45) = 3.133, p = 0.043) were seen in the cortex.

mTOR activation (S2448) and raptor phosphorylation (S792) for pre-frontal cortex and hippocampal regions of the brain relative to LFD. Percent change represented as mean±SEM, significance (Cortex: FpmTOR(4, 43) = 2.730, n = 48, p = 0.037; Fpraptor(4, 43) = 2.730, n = 47, p = 0.042; Hippo: FpmTOR(4, 34) = 2.884, n = 39, p = 0.037, Fpraptor(4, 33) = 0.740, n = 38, p = 0.571) represented by letters.
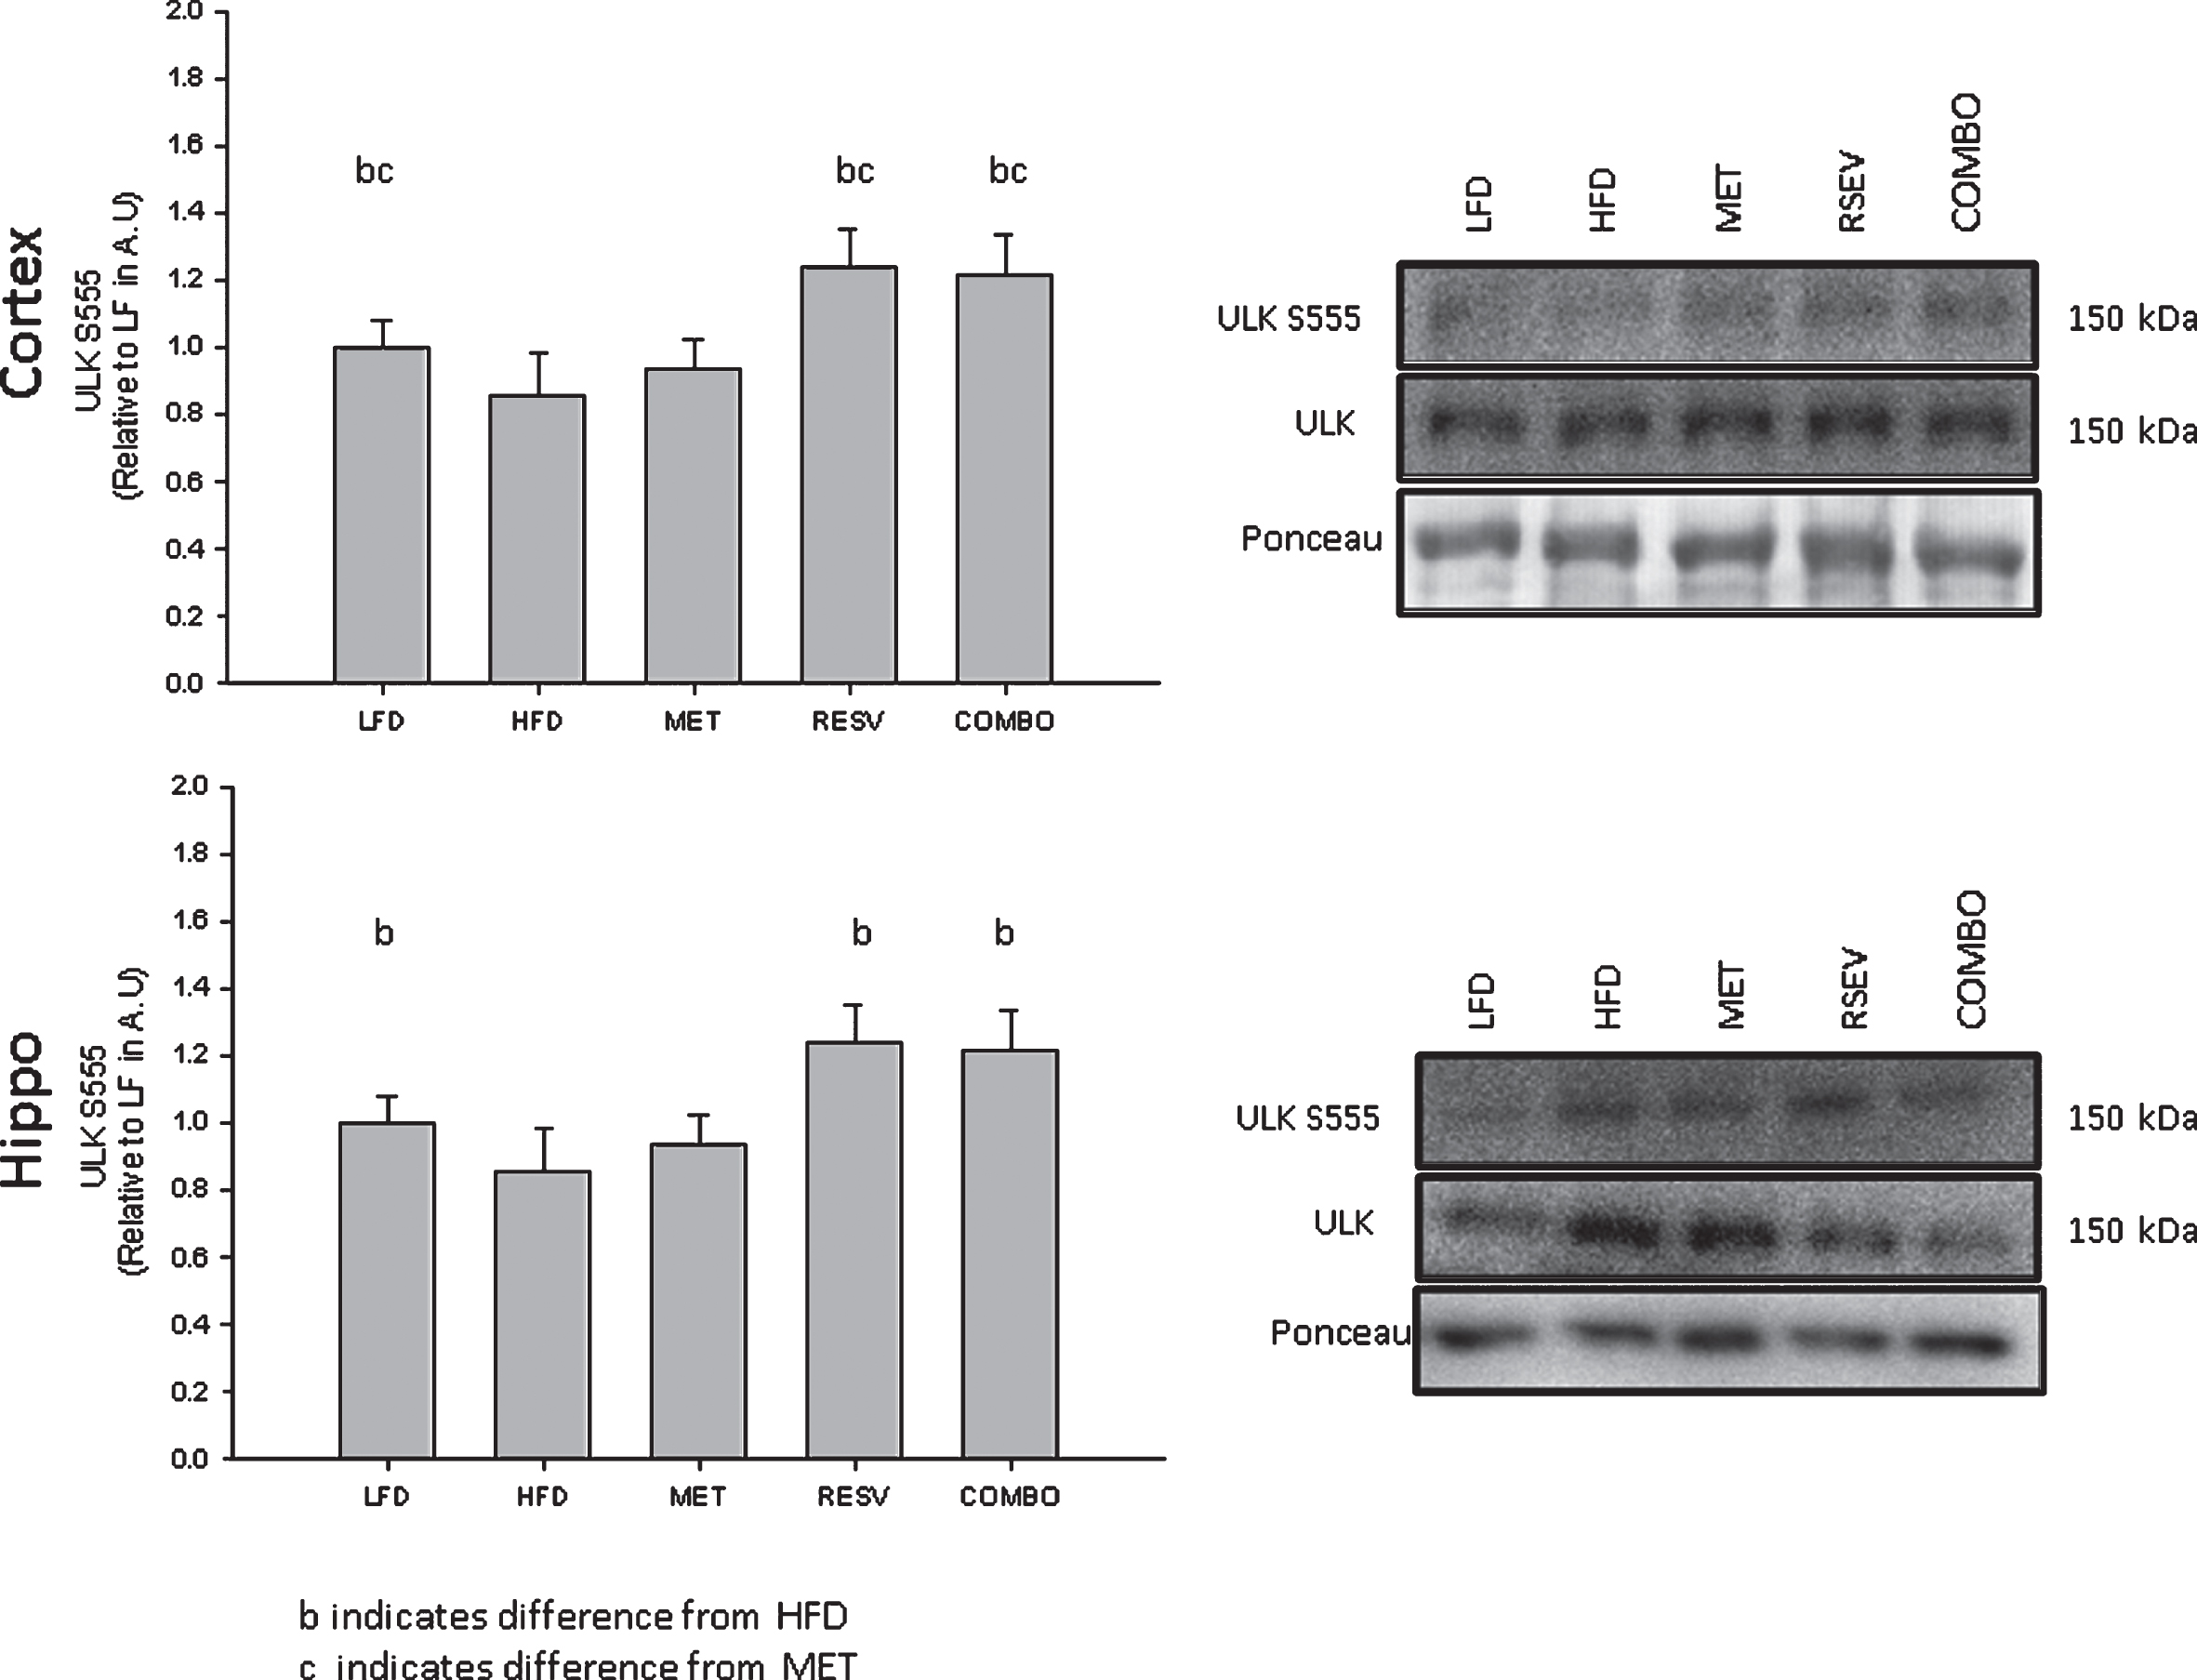
ULK (S555) activation pre-frontal cortex and hippocampal regions of the brain relative to LFD. Percent change represented as mean±SEM, significance (Cortex: FULK(4, 44) = 3.577, n = 49, p = 0.012; Hippo: FULK(4, 34) = 2.661, n = 39, p = 0.049) represented by letters: aindicates difference from LFD, cindicates difference from MET.

SQSTM/p62 and LC3B protein content for pre-frontal cortex and hippocampal regions of the brain relative to LFD. Percent change represented as mean±SEM, significance (Cortex: FSQSTM(4,44) = 2.832, n = 49, p = 0.036, FLC3B(4, 45) = 3.133, n = 50, p = 0.043; Hippo: FSQSTM(4, 30) = 0.825, n = 35, p = 0.518, FLC3B(4, 32) = 0.576, n = 37, p = 0.682) represented by letters.
Markers of neuronal health
Due to the role of mTORC in the regulation of cellular proliferation and growth, markers of synaptic plasticity and neuronal health were assessed in order to determine the effect of MET and RESV, namely synaptophysin and BDNF (proteins strongly related to neuron health downstream of mTORC1 [43]). While no changes were seen following any treatment relative to LFD in the hippocampus (Fsynaptophysin(4,50) = 0.866, p = 0.491, FBDNF(4, 24) = 1.227, p = 0.326), synaptophysin content in the cortex was significantly lower following HFD relative to LFD and was not seen to be restored following any drug treatment (Fig. 5, Fsynaptophysin(4,48) = 3.228, p = 0.020). Similarly, BDNF content was significantly reduced in the cortex following RESV relative to LFD, HFD, and MET, with no significant difference seen between RESV and COMBO treatments (Fig. 5, FBDNF(4,46) = 2.808, p = 0.006). With exception to the hippocampal markers, these cortex results are expected given the AMPK activation and raptor inhibition following RESV and COMBO treatments restricting the formation of mTORC1, likely resulting in the reduced synaptophysin and BDNF content.
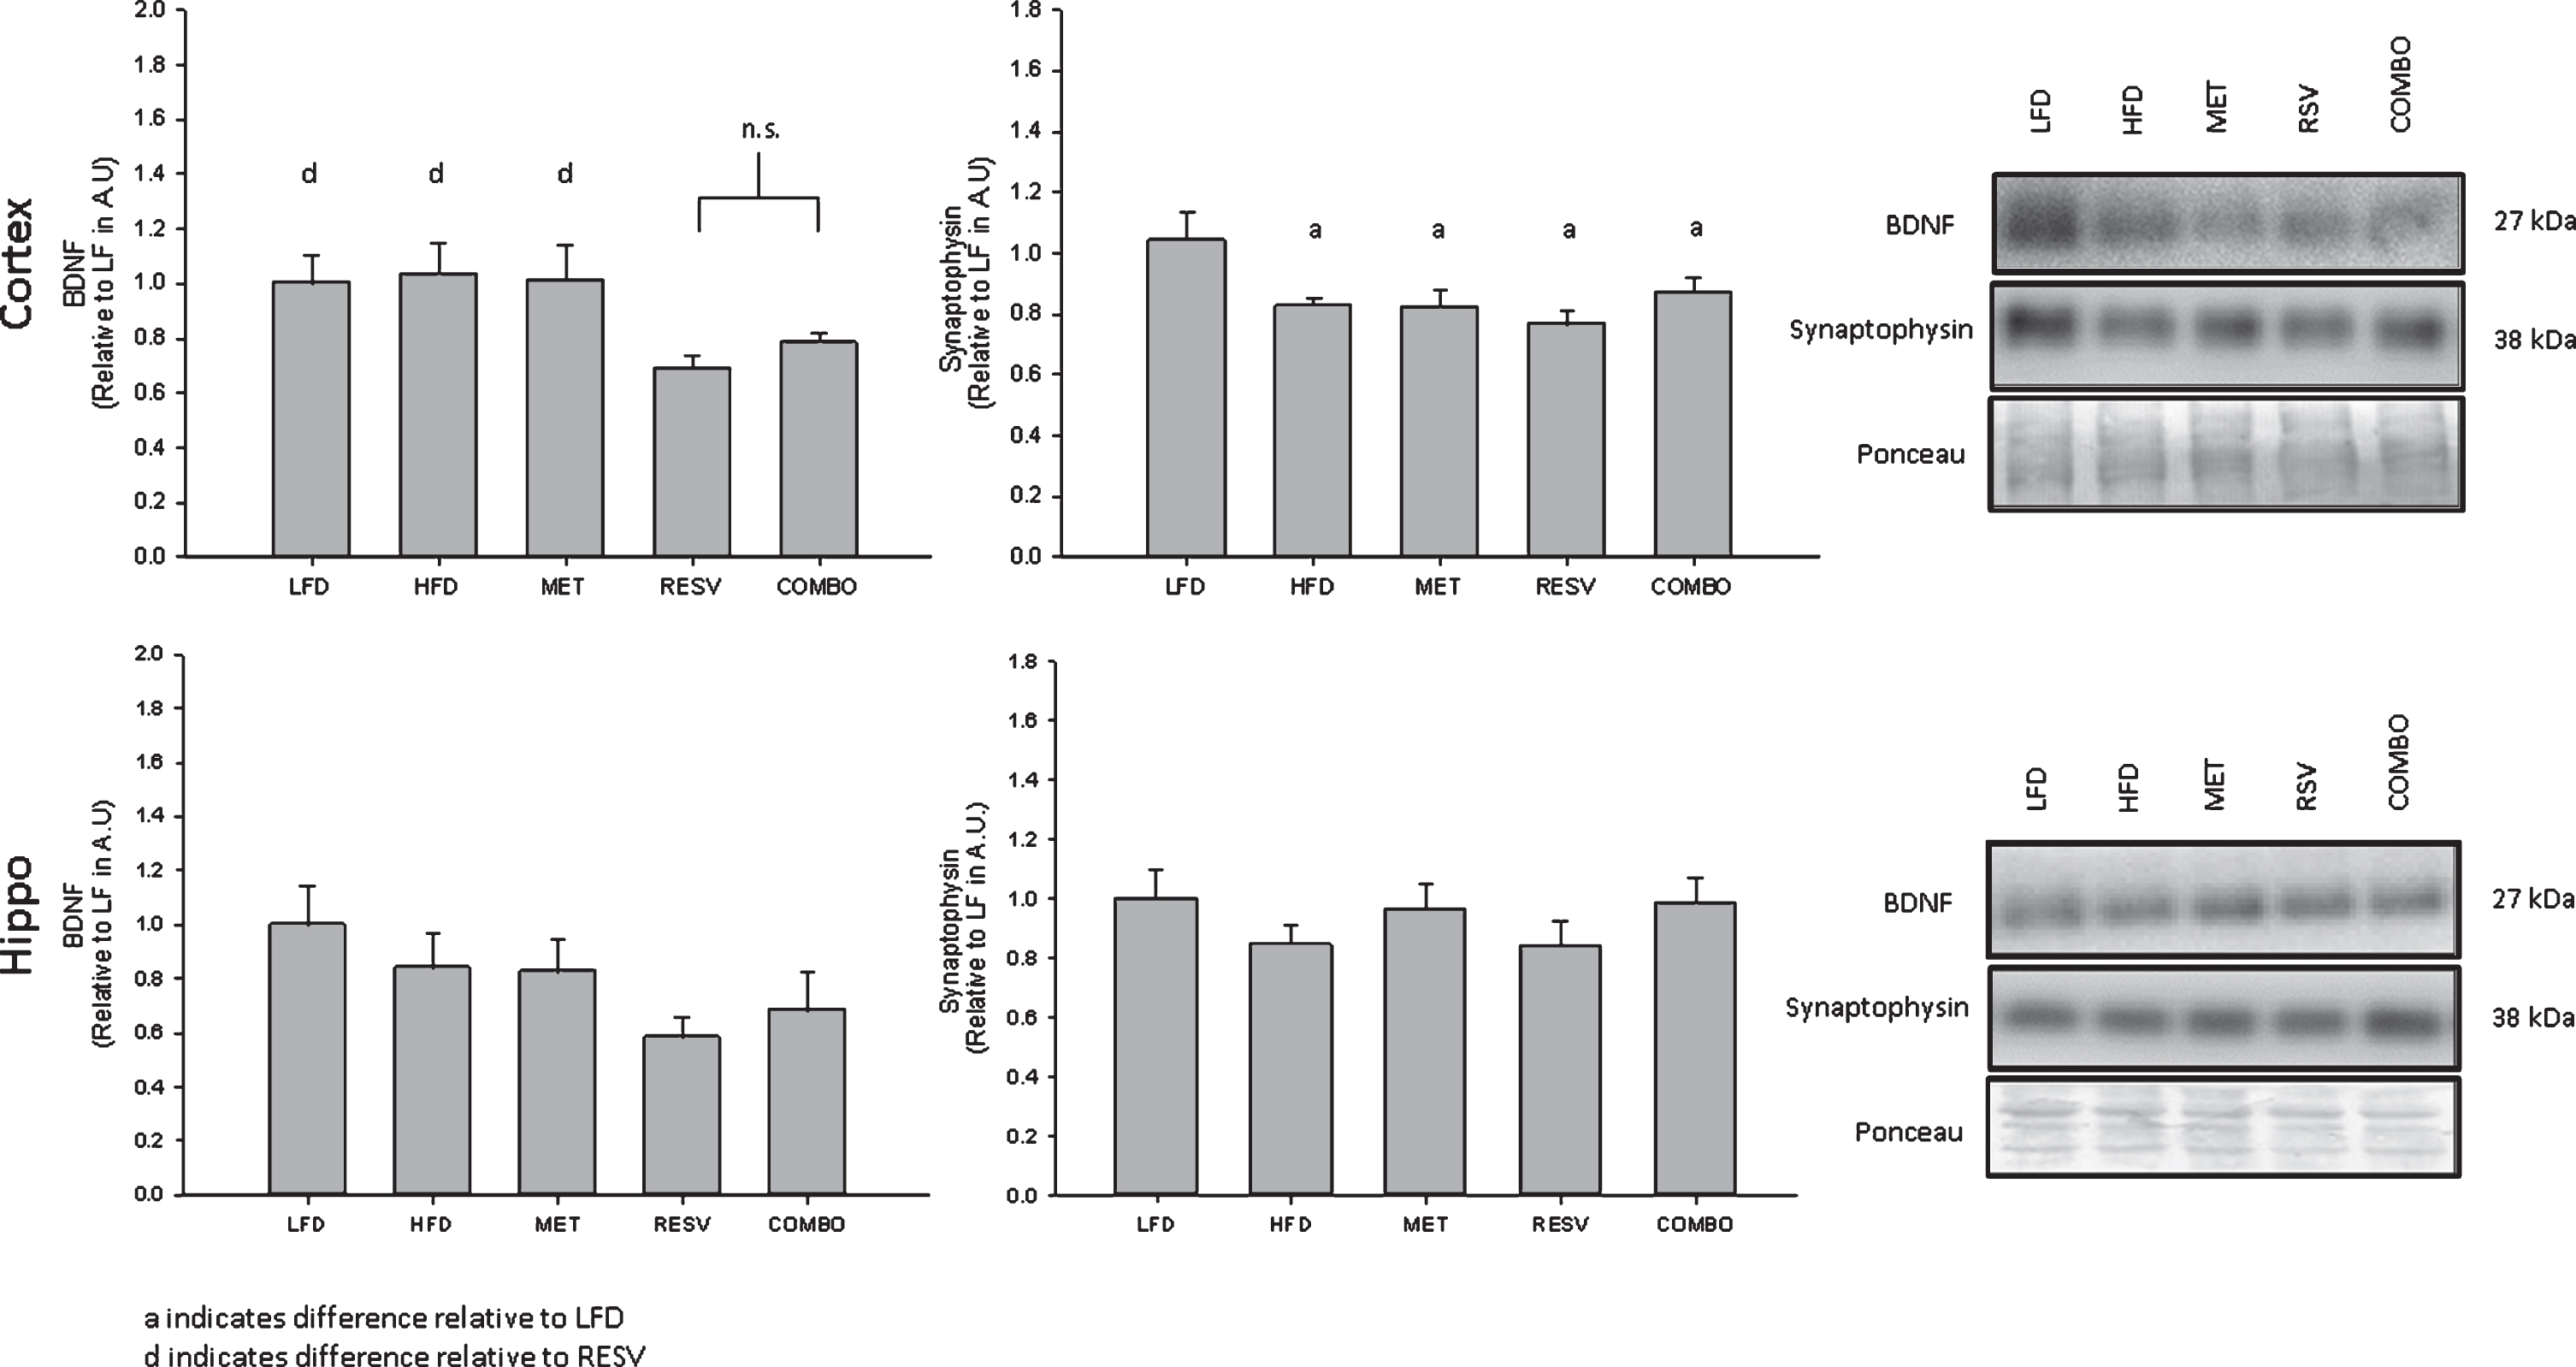
Synaptophysin and BDNF protein content for pre-frontal cortex and hippocampal regions of the brain relative to LFD. Percent change represented as mean±SEM, significance (Cortex: Fsynaptophysin(4,48) = 3.228, n = 53, p = 0.020; FBDNF(4,46) = 2.808, n = 51, p = 0.006; Hippo: Fsynaptophysin(4,50) = 0.866, n = 55, p = 0.491; FBDNF(4, 24) = 1.227, n = 29, p = 0.326) represented by letters.
DISCUSSION
Metabolic dysregulation in diseases such as obesity and T2D have been to linked to the development of sporadic AD [1–4]. This has sparked discussions around the treatment of AD with previously prescribed T2D drugs. Treatments with MET and RESV for cases of diabetes and insulin resistance have been shown to be beneficial in restoring glucose homeostasis and insulin sensitivity in peripheral tissues, particularly through the activation of AMPK [44–46]. Interestingly, MET and RESV have both been shown to activate AMPK in the brain to elicit AMPK’s downstream effects [23, 47]. However, while it has been suggested that improved metabolic homeostasis would be beneficial toward preventing the progression of AD, the overactivation of AMPK in late-stage AD brains as well as the link between AMPK and the regulation of synaptic plasticity has led to discussions on the effectiveness of these treatments in reducing neurodegeneration [32–34]. In the present study, we show that RESV alone is implicated in upregulating autophagy, while at the same time RESV induces significant reductions in the neuronal health marker BDNF and prevents the restoration of the reduced expression of the plasticity marker synaptophysin. Interestingly these findings were found in the prefrontal cortex and not the hippocampus, indicating region specific effects of these drugs. Overall, novel findings from this work puts into question the use of AMPK activating drugs for treating/preventing AD.
AMPK activation
Previous work has shown that treatment of high-fat fed mice with MET and RESV improves glucose and insulin tolerance in the periphery [35]. In this study, we demonstrate that oral administration of RESV alone and in combination (COMBO) results in a significant restoration in AMPK activation in the prefrontal cortex relative to the HFD. In addition, we observed significant activation of specific downstream markers of AMPK activity, such as raptor S792 and ULK1 S555, further demonstrating the ability of RESV to upregulate AMPK activity in the brain. These increases in ULK1 S555 phosphorylation as well as AMPK-dependent raptor phosphorylation at S792 mirror findings shown by Vingtdeux et al. [27] which utilized RESV to directly link the inhibition of mTORC1 by AMPK to the upregulation of autophagy in order to improve Aβ clearance in neuronal cells as well as cortex samples from the cortex of APP/PS1 transgenic mice. Our novel results demonstrate that the relationship between RESV, AMPK activation, and ULK is intact in a model of diet induced metabolic dysfunction. It is notable that the MET treatment did not induce AMPK activation relative to HFD or LFD in the prefrontal cortex but that it did result in increased mTOR S2448. It has been previously shown that both MET [48, 53] and RESV [27, 49–51] are bioactive in the brain and can elicit changes in AMPK activation, therefore it is possible that the dosages in the current study were such that significant changes may not be observed, particularly with MET. Specifically, the dosages for both RESV and MET were chosen at a concentration that showed improvements to glucose and insulin tolerance while not being significantly different from HFD in order to examine the combined effect of the drugs on glucose/insulin tolerance [35].
Our results also highlight a regional difference that exists in the brain in response to RSV and MET. While most literature cite both RESV and MET as being potent activators of AMPK in the brain, these results are often in whole brain homogenates and treated using much higher dosages, likely explaining the observed AMPK activation [54, 55]. However, in the current study, with the exception of mTOR S2448 and ULK S555 phosphorylation, the lack of significant AMPK and downstream AMPK-target activation in the hippocampus stands in contrast to the prefrontal cortex. This regional difference was also observed by Vingtdeux et al. [27], who found that mice fed a diet of 350 mg/kg/day of RESV for 15 weeks, there was an increase of Aβ clearance in the prefrontal cortex but not the hippocampus. It is possible that the delivery of these drugs across the blood-brain barrier is the limiting factor in regards to MET and RESV eliciting their effects especially given the greater extent of cerebral capillary network surrounding the pre-frontal cortex compared to the hippocampus [54, 56].
Activation of autophagy
The effect of autophagy/mitophagy has been of considerable interest when discussing AD treatments due to the clearance of free Aβ peptides and restricting plaque growth [47, 58]. The interaction between AMPK/mTORC1 and the regulation of ULK phosphorylation is a significant triad of protein-protein interactions which can be used to assess the extent of autophagy at the level of initiation. In this study, the phosphorylation of raptor S792 was found to mirror AMPK phosphorylation in the prefrontal cortex for both RESV and COMBO treatments, a result which is also reflected the ULK1 S555 phosphorylation indicating that mTORC1 formation is inhibited in response to RESV and COMBO. Interestingly, despite no apparent MET activation of AMPK, raptor phosphorylation was significantly upregulated in the prefrontal cortex follow treatment. While this direct phosphorylation of raptor may be interpreted as an indicator of MET activation of AMPK [28], these results were not mirrored by ULK1 phosphorylation. In addition to this, there was no significant raptor phosphorylation in the hippocampus following any of the treatments. Overall however, given the increased raptor phosphorylation, it is likely that all treatments including MET, allow for the restriction of the mTORC1, particularly at larger doses [59].
Given the raptor inhibition and ULK activation seen in the cortex, more direct markers were measured in order to confirm whether significant changes in autophagy were in fact present: the autophagy receptor SQSTM/p62 and the membrane bound component of the autophagasomes LC3B [60–64], which are both degraded following fusion of autophagosomes to lysosomes and often used as markers of autophagy. Increases of LC3B have been linked to greater autophagasome formation which is either indicative of upregulation of autophagic flux, or a blockage in autophagosome degradation [67]. This discrepancy is often highly dependent on associated autophagy proteins such as p62 of which decreases in protein content indicate an increase in autophagasome degradation and consequently increased autophagic flux [61–64]. As such, the observed decreases in p62 and increases LC3B in the cortex following RESV and COMBO treatment are indicative of RESVs ability to upregulate autophagy through the activation of AMPK and inhibition of mTORC1.
Interestingly, while AMPK has been shown to impair mTORC1, we found significant upregulation of mTOR S2448 phosphorylation following AMPK activation by MET and COMBO treatments in both the prefrontal cortex and hippocampus. These results are similar to a mechanism proposed by Gao et al. [60], who found that significant mTORC2 activation occurred following AMPK activation, and suggested that RESV induced AMPK activation impairs mTORC1 in an effort to upregulate autophagy and restrict cellular growth and proliferation. At the same time, upregulated mTOR S2448 activity may increase of Akt activity to improve insulin signaling in the brain [61, 62].
Markers of neuronal health
The ability of the brain to maintain and facilitate the growth of healthy neurons and neural connections is paramount to combating neurodegenerative diseases. Given the influence of AMPK and mTORC on regulating cellular energy expenditure with respect of growth and proliferation, we sought to examine the influence of direct AMPK activation on neuronal health markers.
Our results demonstrate that RSV reduces BDNF protein content in the prefrontal cortex and that neither RSV nor MET can recover the HFD induced reduction in synaptophysin. Together, these results support the hypothesis that AMPK activation and mTOR inhibition is detrimental to neuron health. Previous work has suggested that MET has a detrimental effect on neuronal growth due to inhibition of mTOR restriction on cellular proliferation [33, 34]. In agreement with our results, Jeon et al. [63] demonstrated that inhibition of mTORC1 with the specific inhibitor, rapamycin, prevented increases in BDNF expression in response to an mTOR activator hRheb(S16H). Given BDNF’s impact on maintaining and improving neuronal health, particularly as a neuroprotective agent for neurodegenerative diseases such as AD [64, 65], these observed reductions in BDNF as well as reduced synaptophysin content provide further evidence for impairments to neuronal health as a response to treatments with MET and RESV. Further support that increased AMPK activation can be detrimental to neuronal health comes from previous studies that have shown that the inhibition of aberrant AMPK signaling alleviates impairments to synaptic plasticity induced by Aβ [33, 34]. Overall, the RSV-induced upregulation of AMPK activation and downstream markers directly related to mTOR regulation in the prefrontal cortex are significant findings and when linked to the subsequent lowered protein content for BDNF and synaptophysin, highlight the detrimental effects of treatment with AMPK activation.
Conclusion
In the present study, we show that RESV, but not MET, is capable of activating AMPK in the prefrontal cortex and hippocampus. This activation directly inhibits mTORC1, and activates autophagic pathways but inhibits key brain growth/plasticity markers. Given the activation seen following the COMBO treatments for AMPK as well as mTORC inhibition/ULK activation with associated upregulation of autophagy markers in cortex, there seems to be credence for the treatment of AD with these drugs given the apparent upregulation of autophagy. However, while clearance of free Aβ would be beneficial toward slowing the progression of AD, restriction of the brains ability to grow and maintain healthy neurons/neural connections, as suggested by lower BDNF and synaptophysin, highlights the potential for cognitive impairment to persist even after treatment with AMPK activating drugs. As such, future long-term studies focusing on the changes to Aβ accumulation/clearance, more direct measurements of LTP and synaptic plasticity, as well as neural networking are paramount in establishing the effect that chronic AMPK activity has on brain health.
Footnotes
ACKNOWLEDGMENTS
This work was supported by the Natural Sciences and an Engineering Research Council Discovery Grant to REK MacPherson. A. Yang was the recipient of a NSERC USRA. We would like to thank Dr. David Wright from the University of Guelph for the animal housing, feeding, and treatment of these mice (this was funded by OMFRA). S.F.C was supported by an NSERC Alexander Graham Bell Canada Graduate Scholarship-Doctoral (CGS D). S.F.C was supported by Restracomp and a 2018 PricewaterhouseCoopers Student Bursary from the Hospital for Sick Children.
