



Abstract
Mitochondrial dysfunction is recognized as a critical component in the pathogenesis of neurodegenerative diseases, including Alzheimer’s disease (AD). Deficits in oxidative capacity and, specifically, cytochrome c oxidase (CO) activity have been reported in AD brains and platelets. We previously identified a point mutation at np 9861 in AD brain mitochondrial DNA (mtDNA) that alters amino acid 219 of subunit III of CO from phenylalanine to leucine. We rapidly screened and quantitated levels of T9861C in samples using mismatched PCR-RFLP and nucleotide extension assays. Six of 40 AD brains possessed the T9861C mutation (designated AD+) compared to zero of 40 age-matched control brains. The 15% frequency of T9861C in AD brain is 115-fold higher than the frequency (0.13%) reported in 9,986 human mtDNA samples queried in world-wide databases. T9861C is heteroplasmic, with mutant load varying from 11% to >95%. Detected initially in parietal cortex, T9861C is not localized to that region but is also found in temporal cortex and caudate but not in hippocampus. The mutant load is unequally distributed throughout these brain regions with the highest load occurring in the parietal or temporal cortex. CO activity normalized to citrate synthase (CS) is reduced an average of 48.5% in AD+ brains. CO/CS ratios amongst controls and the two AD populations (AD and AD+) were significantly different (p = 0.001). Post hoc differences were also significant between controls and AD+ (p = 0.001) and controls and AD (p = 0.019). There was no significant difference between AD and AD+ (p = 0.317).
INTRODUCTION
Alzheimer’s disease (AD) is the most frequent cause of adult dementia, affecting 5.7 million people in the US alone in 2018 [1]. Mitochondrial dysfunction and oxidative stress have been shown to play important roles in the pathology of AD [2, 3]. Evidence indicates that oxidative stress actually can occur prior to any overt symptoms in AD begin to manifest [4, 5] and before amyloid-β (Aβ) plaque formation [4] supporting a causative role of mitochondrial dysfunction and oxidative stress in AD. A mitochondrial cascade hypothesis proposed in 2004 by Swerdlow and Khan [6] put front and center the role of mitochondria in the development of late-onset, sporadic AD. This hypothesis and its updated version [7] states that, in sporadic AD, mitochondrial dysfunction is the primary event that causes Aβ deposition, synaptic degeneration, and formation of neurofibrillary tangles.
Many of the changes typical of compromised mitochondria are seen in the AD brain. These include disruption of mitochondrial cristae and intra-mitochondrial accumulations of material [8] and an increased range of mitochondrial sizes, with more enlarged mitochondria but also elevated numbers of exceptionally small mitochondria [9]. Mitochondria are important metabolic organelles and not unsurprisingly enzymes that mediate glucose metabolism have been found to have either altered amounts or altered Vmax activities. Expression of enolase is upregulated in the brains of AD patients [10] while pyruvate dehydrogenase complex and the TCA cycle enzymes α-ketoglutarate dehydrogenase complex and isocitrate dehydrogenase are downregulated [11]. On the other hand, succinate dehydrogenase and malate dehydrogenase activities are increased [12]. In 1990, Parker [13] showed that cytochrome c oxidase (CO) activity was significantly depressed in AD platelets, further indicating that AD may be a systemic disorder. Swerdlow and colleagues have observed that respiratory complex IV, cytochrome c oxidase, activity is approximately 30% lower in AD brains compared to age-matched controls [14, 15]. CO is one of three OXPHOS complexes that pump protons across the mitochondrial inner membrane, thereby establishing the proton motive force that drives ATP production. Impairment in this process may lead to oxidative stress, thereby inducing the neuronal degeneration that is so prevalent in AD [5]. Of the thirteen subunits comprising CO, ten are encoded by nuclear DNA while three subunits (CO I, CO II, CO III) are encoded by the heavy or H strand of mitochondrial DNA (mtDNA).
Thus, mitochondrial genetics could explain the occurrence of some of the late onset sporadic cases of AD as well as the altered gradients of cognitive deficits observed in different patients. A mutation in mtDNA encoding tRNAGln has been reported to be associated with AD in almost 5% of the cases examined [16] and other base substitutions in 12S rRNA and respiratory complex I genes [17, 18] have been detected in AD patients. In addition to point mutations in these gene-coding regions, levels of the common 5 Kb mtDNA deletion have been found to be elevated from 12- to 15-fold in AD brain tissue when compared to age-matched controls [19, 20]. In a recent study of AD brain samples, a number of point mutations were found within the region of mtDNA that controls replication and transcription of the mitochondrial genome [21].
The possibility that other mtDNA mutations are associated with AD requires further investigation. We therefore wanted to determine whether mtDNA mutations in CO I, II, or III exist that may lead to the altered activity observed in AD patients. In an earlier SSCP screening of the CO I, II, and III genes, we identified a T ⟶ C mutation at np 9861 that was found in two AD brains (hereafter designated AD+) but no control samples [22]. We have extended this observation in this work and report here the occurrence of the T9861C mutation in 15% of the AD samples and 0% of the age-matched control brains tested. Furthermore, the T9861C mutation is distributed unequally in the brain, occurring at significant proportions in the parietal and temporal cortexes as well as the caudate of affected patients, but being absent from the hippocampus of all samples tested. There is an observed reduction in CO activity (normalized to CS activity) in the AD+ brains possessing the T9861C mutation that is 1.4-fold greater than the average reduction seen in other AD samples.
MATERIALS AND METHODS
Sample acquisition
Forty AD and forty control autopsy-confirmed brain samples were kindly supplied by the following: Dr. W. W. Tourtelotte of the National Neurological Research Specimen Bank (NNRSB), VAMC, Los Angeles, CA 90073. Tissue/fluid specimens obtained from the NNRSB, are sponsored by NINDS/NIMH, National Multiple Sclerosis Society, Hereditary Disease Foundation, Comprehensive Epilepsy Program, Tourette Syndrome Association, Dystonia Medical Research Foundation, and Veterans Health Services and Research Administration, Department of Veterans Affairs; Dr. Peter Davies of the Department of Pathology at Albert Einstein College of Medicine, New York, NY; Dr. Deborah C. Mash, University of Miami Brain Endowment Bank, Miami, FL. All research protocols have been approved by the Eastern Virginia Medical School Institutional Review Board (IRB).
Preparation of mtDNA-enriched DNA samples
Total DNA enriched for mtDNA was isolated from frozen autopsy brain samples using the techniques of Swierczynski et al. [23] and Drouin [24] with modifications for the analysis of small amounts of tissue as described in Hamblet et al. [22]. The postmortem delay or time of autolysis ranged from 3 to 24.1 h. Parietal cortex was obtained for all samples tested (control and AD) and in some cases, four brain regions were obtained: parietal cortex, temporal cortex, caudate, and hippocampus. All AD brain tissue was confirmed at autopsy to have histological lesions characteristic of AD (neurofibrillary tangles and amyloid plaques).
Preparation of nuclease and restriction enzyme treated DNA samples
A portion of frozen brain (approximately 150 mg) was collected, minced, and homogenized as above. After removal of a nuclear pellet by slow speed centrifugation, a mitochondrial pellet was obtained by centrifugation for 10 min at 12,000× g. The crude mitochondrial pellet was suspended in Buffer C (0.25 M sucrose, 10 mM TrisHCl, pH 7.4, 3.0 mM CaCl2), micrococcal nuclease (25 units) was added and the mixture was incubated for 15 min at room temperature [25]. The reaction was terminated by the addition of EGTA (final concentration 6.0 mM) and one volume of cold Buffer C. The nuclease-treated mitochondria were collected by centrifugation at 5,600× g for 10 min, and lysed by addition of sodium dodecylsulfate (SDS) and proteinase K as in [22]. After phenol/chloroform/isoamyl alcohol extraction, the mtDNA was ethanol precipitated. The recovered mtDNA was dissolved in sterile water and an aliquot (∼250 ng) was treated with 2.5μg DNase-free RNase for 20 min at 37°C. After organic extraction the mtDNA was recovered by ethanol precipitation and suspended in sterile water. Approximately 50 ng was digested simultaneously with Bgl II and Dra III (0.2 units each) for 15 min at 37°C. After organic extraction and ethanol precipitation, the digested mtDNA was further treated by incubation with Exonuclease III (1.0 unit) for 15 min at 37°C. After organic extraction and ethanol precipitation, the MRBDE-treated mtDNA was suspended in sterile water and stored at –20°C.
Preparation of ρ0 DNA
Total DNA was isolated from 5×10⁶ ρ0 cells according to the procedure of King and Attardi [26]. Recovered DNA was suspended in 10 mM Tris-1 mM EDTA, pH 8.0 and quantitated by spectrophotometry at 260 nm.
Mismatched PCR-RFLP assay
A Hae III restriction enzyme site was introduced into the PCR product containing the region around np 9861 by using a mismatched left primer that spanned np9840-9860. The sequence of this left primer was 5’TCAACTTTCCTCACTATCGGC3’, where the underlined residue is mismatched with respect to the wild type strand. The right primer spanned mtDNA residues 10,145 to 10,126 and had the sequence 5’GCCGTTGAGTTGTGGTAGTC3’. The PCR product of 306 bp would be cut by Hae III into 20 and 286 bp fragments only if the mutant C was present at position 9861. After amplification, the PCR product was purified by the BioRad Prep-a-Gene procedure according to the manufacture’s recommendations. The purified PCR product (100 ng) was digested with Hae III in a 10μl incubation mix for 2 h at 37°C. The products of the restriction enzyme digestion were separated by electrophoresis on a 6% polyacrylamide gel in 1XTris-Borate-EDTA buffer.
Single nucleotide primer extension assay
The region containing the T9861C mutation was amplified using a forward primer spanning mtDNA nucleotides 9840–9860 and a reverse primer spanning mtDNA nucleotides 10145–10126. The PCR product was purified using Qiagen kit according to the manufacturer’s specifications. For the SNPE assay, the unlabeled forward primer, TCAACTTTCCTCACTATCTGC, whose 3’ end terminates at the residue immediately adjacent to the point of mutation, was annealed to the purified PCR-generated DNA. The primer and DNA template were used in a one step PCR incubation involving denaturation, annealing and a single cycle of DNA synthesis [27]. The “T” reaction only contained [α-32P]dTTP, while the “C” reaction contained only [α-32P]dCTP as nucleotide reagent during the synthesis step. The radiolabeled products were separated by gel electrophoresis on 3% Seakem/1% agarose and visualized by autoradiography and/or phosphoimaging. Quantitation was performed using ImageJ software. The percent T or C was calculated by dividing the intensity of the T or C spot by the total intensity (T + C) and multiplying by 100.
PCR amplification of nuclear and mtDNA-encoded genes
Primers for three nuclear genes (alpha actin, p53, and the 3’ portion of 28S rRNA) and one mtDNA gene (CO subunit III) were designed for amplification from DNA templates prepared either with the micrococcal nuclease, RNase, Bgl II, Dra III, Exonuclease III treatment (MRBDE samples) or without such treatment (Untreated mtDNA-enriched samples). The primer sequences used were as follows: Actin forward primer: 5’ACTTCTTTGACAGGCTGCT3’, Actin reverse primer: 5’GAATTTCAGGCCATTTCCT3’ p53 forward primer: 5’CTTTGAACCCTTGCTTGCA3’ p53 reverse primer: 5’AGGTGGTTTCAAGGCCAGA3’ 28SrRNA3’regionforward primer: 5’CTAGCAGCCGACTTAGAACT3’ 28SrRNA 3’region reverse primer: 5’GCCTCCCACTTATTCTACAC3’ CO III forward primer: 5’TCAACTTTCCTCACTATCTGC3’ CO III reverse primer: 5’GCCGTTGAGTTGTGGTAGTCA3’
The actin primers amplify a 407 bp product from exon 1; the p53 primers amplify a 395 bp product from exon 11; the rRNA primers yield a 381 bp PCR product from the V8 region of 28S rRNA, and the CO III primers amplify a 306 bp region from the mtDNA-encoded CO subunit III gene. All three primer sets yielded PCR products with template DNA using a 3 min initial denaturation at 94°C, 34 cycles of 30 s 94°C denaturation, 30 s 51°C annealing, and 1 min elongation at 72°C. A final 3 min elongation was included to allow completion of partially synthesized PCR products, and then a 4°C hold was instituted. The PCR products were analyzed by electrophoresis in 1.4% agarose-Tris-Borate-EDTA gels.
Preparation of mitochondrial protein extract
All operations were carried out at 4°C. Approximately 150 mg of frozen AD or control brain were suspended in 1.0 ml MSHE (5 mM HEPES, 70 mM Sucrose, 210 mM Mannitol, 1 mM EDTA, pH 7.4) plus PIC (1 mM phenylmethylsulfonyl fluoride (PMSF), 10μM leupeptin, 1μM pepstatin) per 100 mg and homogenized using 6 to 10 strokes at 500 RPM in a small (5 ml) glass homogenizer with a Teflon motor driven pestle. The homogenate was centrifuged at 800× g for 10 min. The supernatant was then spun at higher speed (10,000× g, 10 min). The crude mitochondrial pellet was suspended in 100–200μl SMB (5 mM MOPS, 5 mM KH2PO4, 1 mM EDTA, pH 7.4) + PIC, one-tenth volume of 7.5% sodium dodecyl cholate was added and the mixture was incubated on ice for 30 min. After a 15 min centrifugation at 13,000× g, the supernatant was recovered and assayed for protein and CO and CS activity using 20μg of mitochondrial protein per assay.
CO activity
CO activity was measured spectrophotometrically, essentially as described in [28]. Fully reduced cytochrome c was prepared by treatment with ascorbate followed by gel permeation chromatography to remove unreacted ascorbate [29]. Approximately 30μM cytochrome c was placed in a one ml cuvette with phosphate buffer, pH 7.4. The reaction was initiated with the addition of freshly-prepared brain extract and the decrease in OD565 was followed for 3 min.
CS activity
CS activity was measured spectrophotometrically essentially according to Matsuoka and Srere [30]. Brain mitochondrial extract was added to warmed phosphate buffer in a one ml cuvette. Dithionitrobenzoic acid (DTNB) and acetyl-CoA were added. The reaction was initiated with the addition of oxaloacetate and the absorbance at 405 nm was measured at 15-s intervals for 3 min.
Chimera and PolyPhen2 analysis
The molecular modeling was performed using UCSF Chimera, a program for interactive visualization and analysis of molecular structures and related data. Chimera was developed by the Resource for Biocomputing, Visualization, and Informatics (RBVI), supported in part by the National Institutes of Health (P41-GM103311). The transformed polymorphism analytic tools PolyPhen2 transf (polymorphism phenotype v 2 transformed) and SIFT (Sorting Intolerant From Tolerant transformed) were used to produce a polymorphism deleteriousness score. A score of 2.15 is obtained by transformed polyphen2 analysis and 1.9 is obtained with transformed SIFT analysis.
Statistical analysis
Results are expressed as the mean±standard deviation of n experiments. All statistical analyses were performed by Statistical Analysis Software (SAS) v. 9.4. Mean±standard deviation CO/CS ratios were computed for AD (n = 6), AD+ (n = 6), and controls (n = 6). Mean, lower 95% confidence level, upper confidence level, median, minimum, maximum, and quartile range were computed for the three groups. Tests for normality of data included the PROC UNIVARIATE Procedure, Boxplots, and Q-Q plots. To assess mean differences among the three CO/CS ratios, One-Way Analysis of Variance (ANOVA) tests for independent measures were performed. Post hoc, pairwise two-sided multiple comparison analyses were performed by the PROC General Linear Model (GLM) procedure least square means, adjusted for multiple comparisons using the Tukey adjustment method. Differences of comparisons were considered statistically significant when p-values were less than 0.05 (p < 0.05). Because the objective of this study was to evaluate the frequency, level, and distribution of the T9861C mutation in AD and control brains, the assessment of CO and CS activities was considered a preliminary or pilot investigation into the effect of the T9861C mutation on CO. As such, sample size calculations were not considered appropriate and were not calculated.
RESULTS
Screening AD and control brain samples for the T9861C mutation using the mismatched PCR restriction fragment length polymorphism (MMPCR-RFLP) assay
Many mtDNA mutations associated with mitochondrial dysfunction are found to be heteroplasmic. Although we had originally detected the T9861C mutation initially using SSCP [22], this electrophoretic technique is generally not effective at quantitation of the levels of polymorphic DNA bands on the gel. To evaluate the level of heteroplasmy at 9,861 in AD and control samples more rapidly and with increased sensitivity, we developed a mismatched PCR-restriction fragment length polymorphism (MMPCR-RFLP) assay for detection and quantification of this specific mutation.
Because the mutation does not occur in a sequence recognized by known restriction enzymes, we designed a left primer containing a single mismatch to the wild type mtDNA sequence. As seen in the diagram of the assay shown in Fig. 1A, this mismatched primer terminates with its 3’ end adjacent to the affected nucleotide at position 9861. The presence of the mutant C at np 9861 results in the formation of a Hae III recognition site. The 306 bp PCR product is cleavable by treatment with Hae III (recognition site GGCC), yielding 286 and 20 bp products.
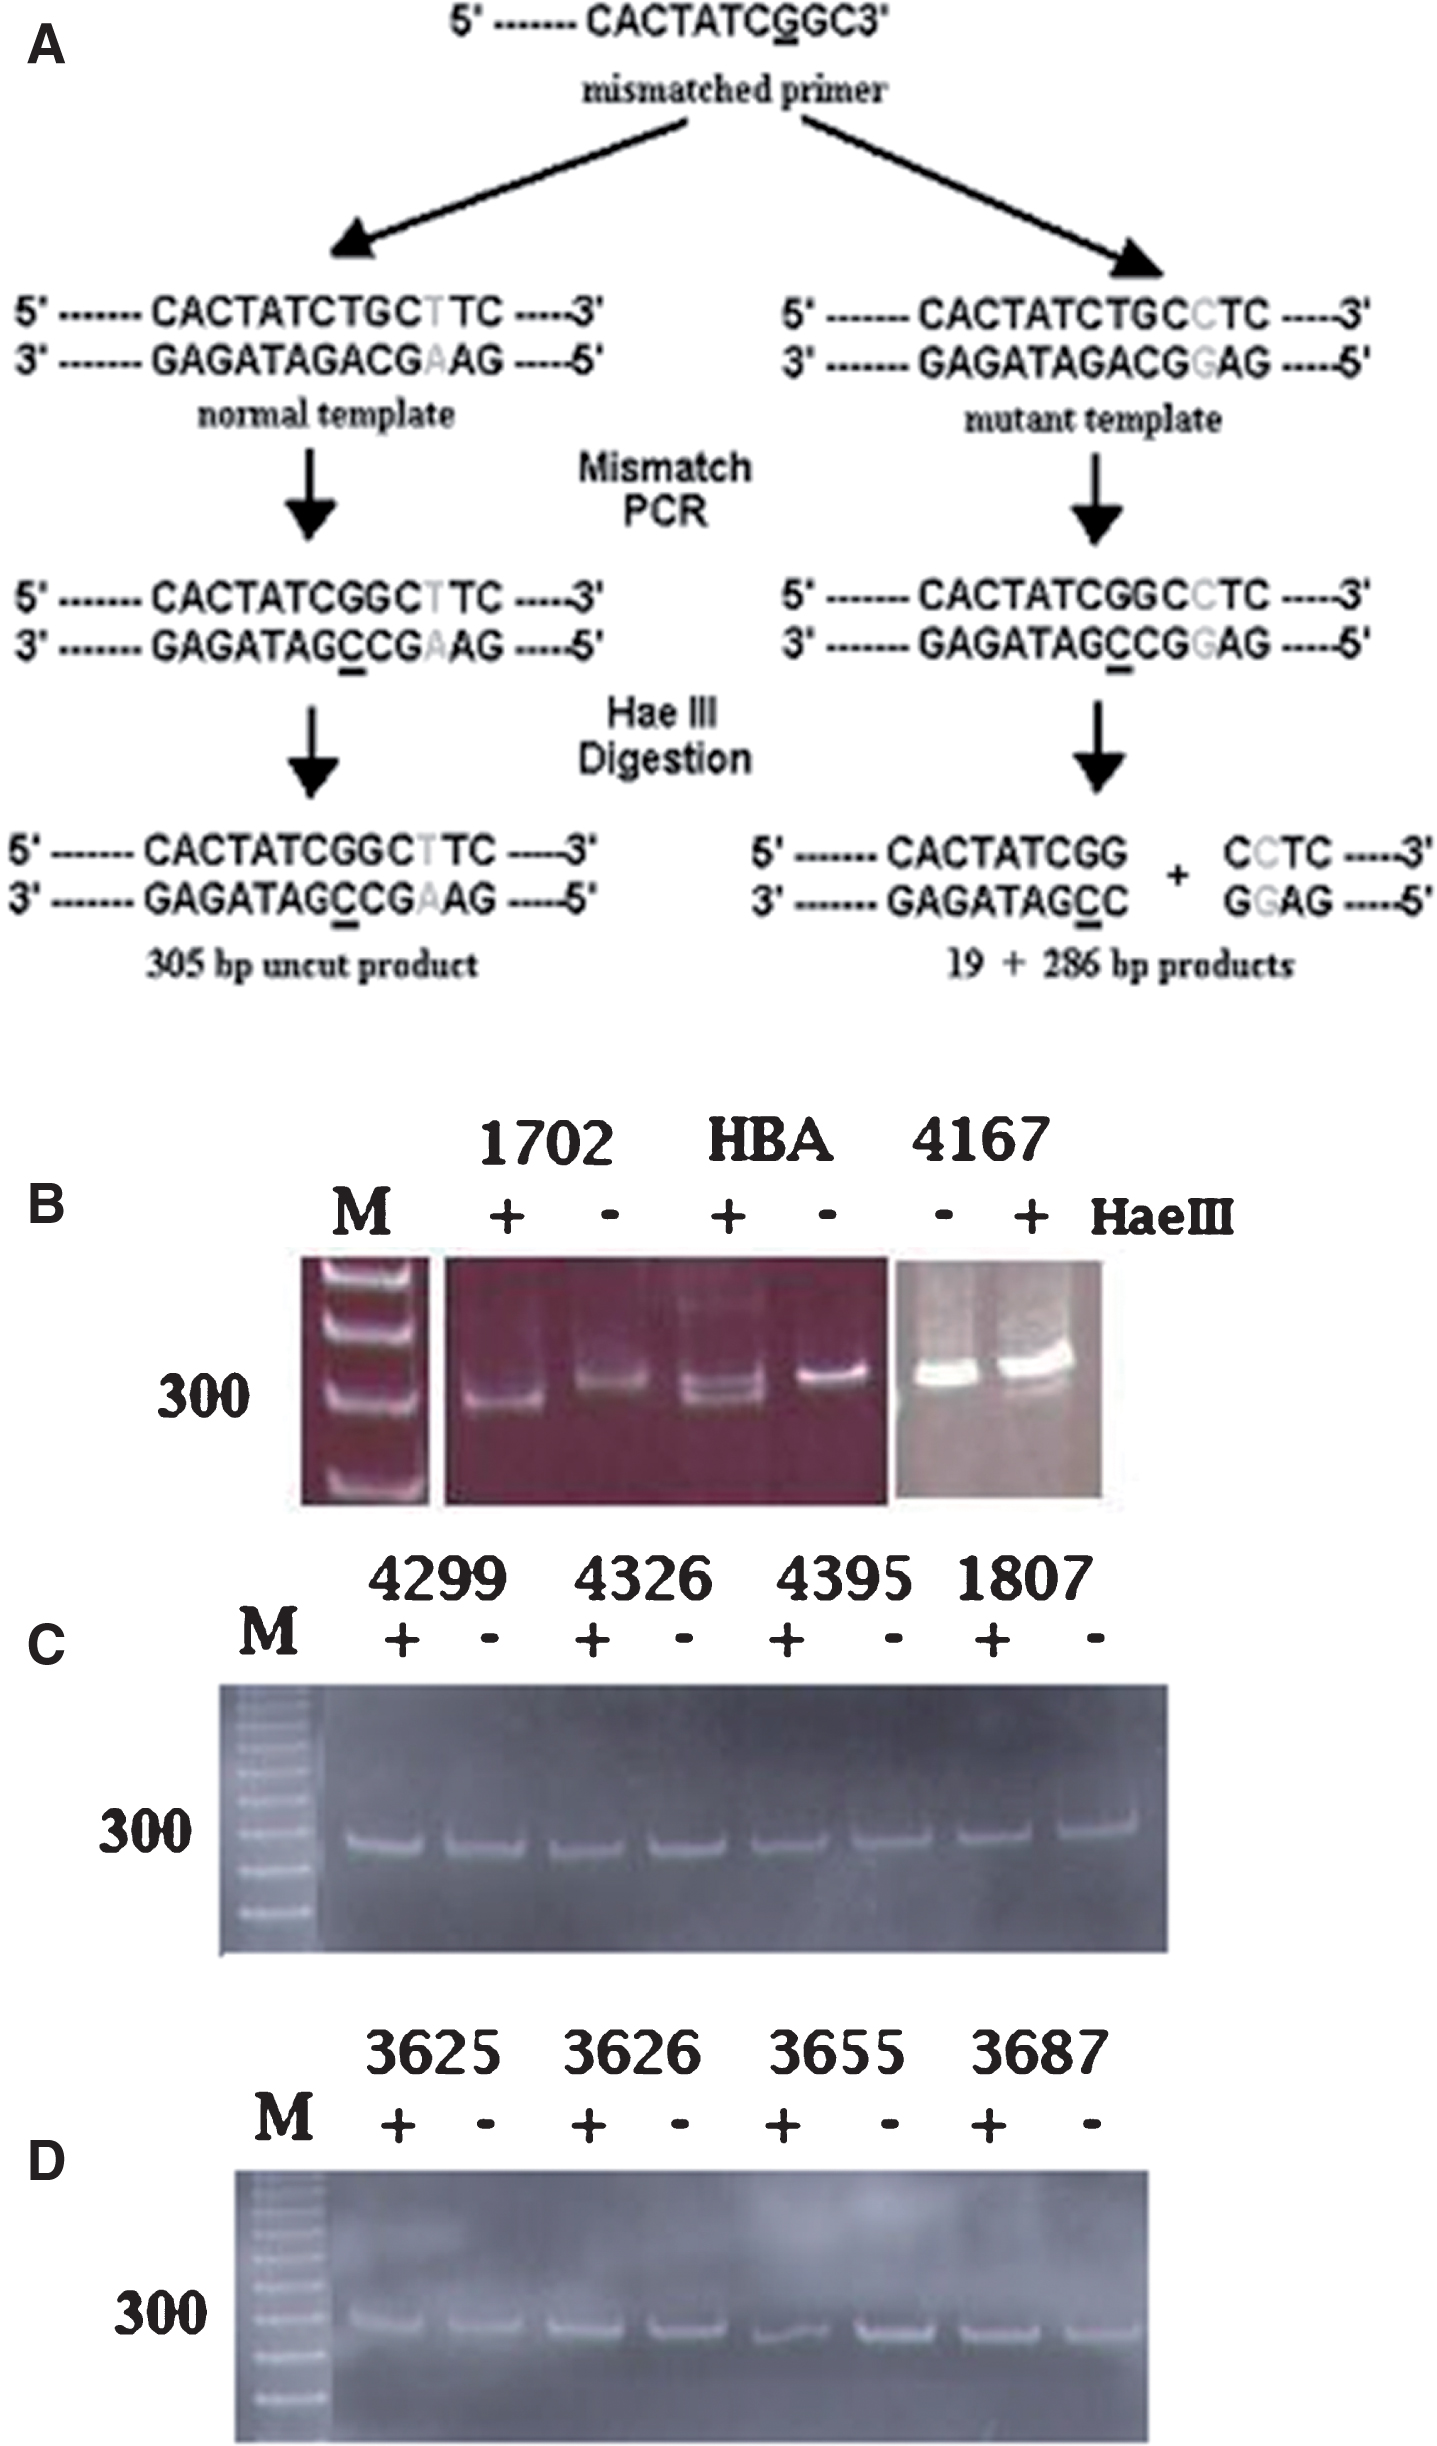
Mismatched PCR-RFLP analysis of the T9861C point mutation in wild type and mutant samples. A) Diagram of the mismatched PCR-RFLP assay. B-D) Acrylamide gel electrophoresis after Hae III treatment. Lanes labeled (+) were treated with Hae III; lanes labeled (–) were untreated. Lanes labeled (M) in B, C, and D contain molecular weight markers with 300 base pair band indicated. B, three samples (1702, HBA, and 4167) possessing the T9861C mutation. C, four AD samples lacking the T9861C mutation. D) Four control samples lacking the T9861C mutation.
Twenty-seven AD brain samples and an equal number of age-matched control brain samples were screened and the MMPCR-RFLP assay detected the presence of the T9861C mutation in three AD+ samples (samples possessing the T9861C mutation). Figure 1B shows results for the two AD samples already determined by SSCP analysis to contain the T9861C mutation (AD1702 and ADHBA, lanes 1–4) as well as for one new sample (AD4167) found to possess the T9861C mutation at low levels. Figure 1C shows representative results for the remainder of the AD samples tested, all of which lacked the T9861C mutation, as seen by the co-migration of bands in the Hae III-treated and untreated lanes. Similarly, Fig. 1D shows representative assays for the age-matched control samples tested by the MMPCR-RFLP assay. None of the control samples contained the T9861C mutation as demonstrated by the absence of Hae III cleavage of the 306 bp mismatched PCR product.
Quantitation of the T9861C mutation by single nucleotide primer extension (SNPE) assay
Although the MMPCR-RFLP assay led to the successful detection of three AD+ samples (AD1702, ADHBA, AD4167), the ability of this approach to detect heteroplasmic mutations occurring at low levels was limited. We generally found that reproducible detection of a mutation occurring at less than 15–20% in the mtDNA population was not possible. We developed a more sensitive test based upon the nucleotide extension assay described by Syvänen et al. [27]. This single nucleotide primer extension (SNPE) assay is represented schematically in Fig. 2A. We typically ran three primer extension reactions for each sample: a “T”, “C”, and “G” reaction, using the “G” reaction as a measure of background noise.
We applied this SNPE assay to the analysis of 40 AD and 40 control samples. Representative results are shown in Fig. 2. Figure 2B shows the positive identification of the mutant C in six of the AD samples tested (AD1702, ADHBA, AD4167, AD4342, AD4336, and AD4420). Because the background noise occurring as a weak positive signal in the “G” reaction (and in an “A” reaction which was also run as a background control in some assays) which could measure as much as 5 % of the relative spot intensity, we arbitrarily set 5% as a threshold value of spot intensity above which we would identify a sample as a mutant-positive sample. Figure 2C shows results of the SNPE assay of control samples as well as several AD samples. These samples all possess the wild type T at position 9861. The faint intensity of C in some of these samples is below the threshold value distinguishing noise from a bona fide mutation signal.

The single nucleotide primer extension (SNPE) assay to quantitate the T9861C mutation. A) Schematic diagram of the SNPE assay. Shown is the result expected for the “C” reaction. “T”, “G”, and “A” reactions would be exactly the same except for replacement of the 32P-dCTP with the appropriate 32P-dNTP. B, C) Representative SNPE assays for DNA preparations from AD and control brains. B) “T”, “G”, and “C” reactions performed on AD samples AD1702, AD4167, ADHBA, AD4336, AD4342, and AD4420. C) “T”, “G”, and “C” reactions run on controls 3625, 3626, 3655, 3687, and AD samples AD4395 and AD4299. AD4395 and AD4299 are examples of AD samples that do not possess the T9861C mutation.
The results of quantitation for the six AD+ samples as well as other T9861C-negative AD samples and controls are collected in Table 1. The proportion of mutant C is seen to range in the various samples from a low of 19.9% in sample AD4336 to a high of 91.7% in AD1702. The youngest AD+ patients were two 68-year-old males (ADHBA and AD4420) and the oldest were two 76-year-old females (AD1702 and AD4336). The autolysis times ranged from 3 h post mortem to 24.1 h. Examination of the data in Table 1 shows no correlation of mutant load with age, sex, or time of autolysis.
Quantitation of T9861C heteroplasmy by SNPE assay
aAutolysis time is the time elapsed between death and the autopsy being performed. bBased on a minimum of 3 determinations.
We tested a total of 34 AD samples that showed no evidence of possessing the T9861C mutation. One of these representative T9861C-negative AD samples (1816AD) is shown in Table 1. The average percent T in this T9861C-negative AD sample is 97.2%, which is in agreement with the average for the total 34 T9861C-negative AD samples (average percent T of 98.3%). Similarly, there were 40 age-matched control brain samples tested by SNPE assay. The average percent T (98.1%) and mutant load (1.9%) for the control sample shown in Table 1 (4247Con) is representative of the average values found in all 40 of the control samples (98.4% T, 1.6% C).
The 9861 T⟶ C mutation is not due to mitochondrial pseudogenes in nuclear DNA
Because of concerns about the ability of PCR amplification to detect very small quantities of mtDNA sequences that might be present in nuclear DNA as mitochondrial pseudogenes, Attardi and co-workers developed a scheme of nuclease and restriction enzyme digestions to effectively eliminate nuclear DNA from mtDNA preparations [25]. To demonstrate that our method to prepare enriched-mtDNA led to PCR amplification of bona fide mtDNA sequences and not nuclear DNA-embedded mitochondrial pseudogenes, we used the SNPE assay to quantitate the level of T9861C in the six samples we had identified as possessing the mutation using our routine method of preparation of enriched-mtDNA and compared this to results using the nuclease/restriction enzyme-treated preparation of mtDNA. Figure 3 shows the PCR products generated from DNA recovered from a nuclear pellet produced during the preparation of enriched-mtDNA (Nuclear); from enriched mtDNA prepared as performed on all our previous samples (Untreated); and from mitochondrial DNA treated in series with micrococcal nuclease, RNase, Bgl II, Dra III, and finally, exonuclease III (MRBDE). Actin (lane 1), p53 (lane 2), and rRNA (lane 3) primers were used to amplify and assess nuclear DNA sequences, while CO subunit III (lane 4) primers were used to assess mtDNA-specific sequence.
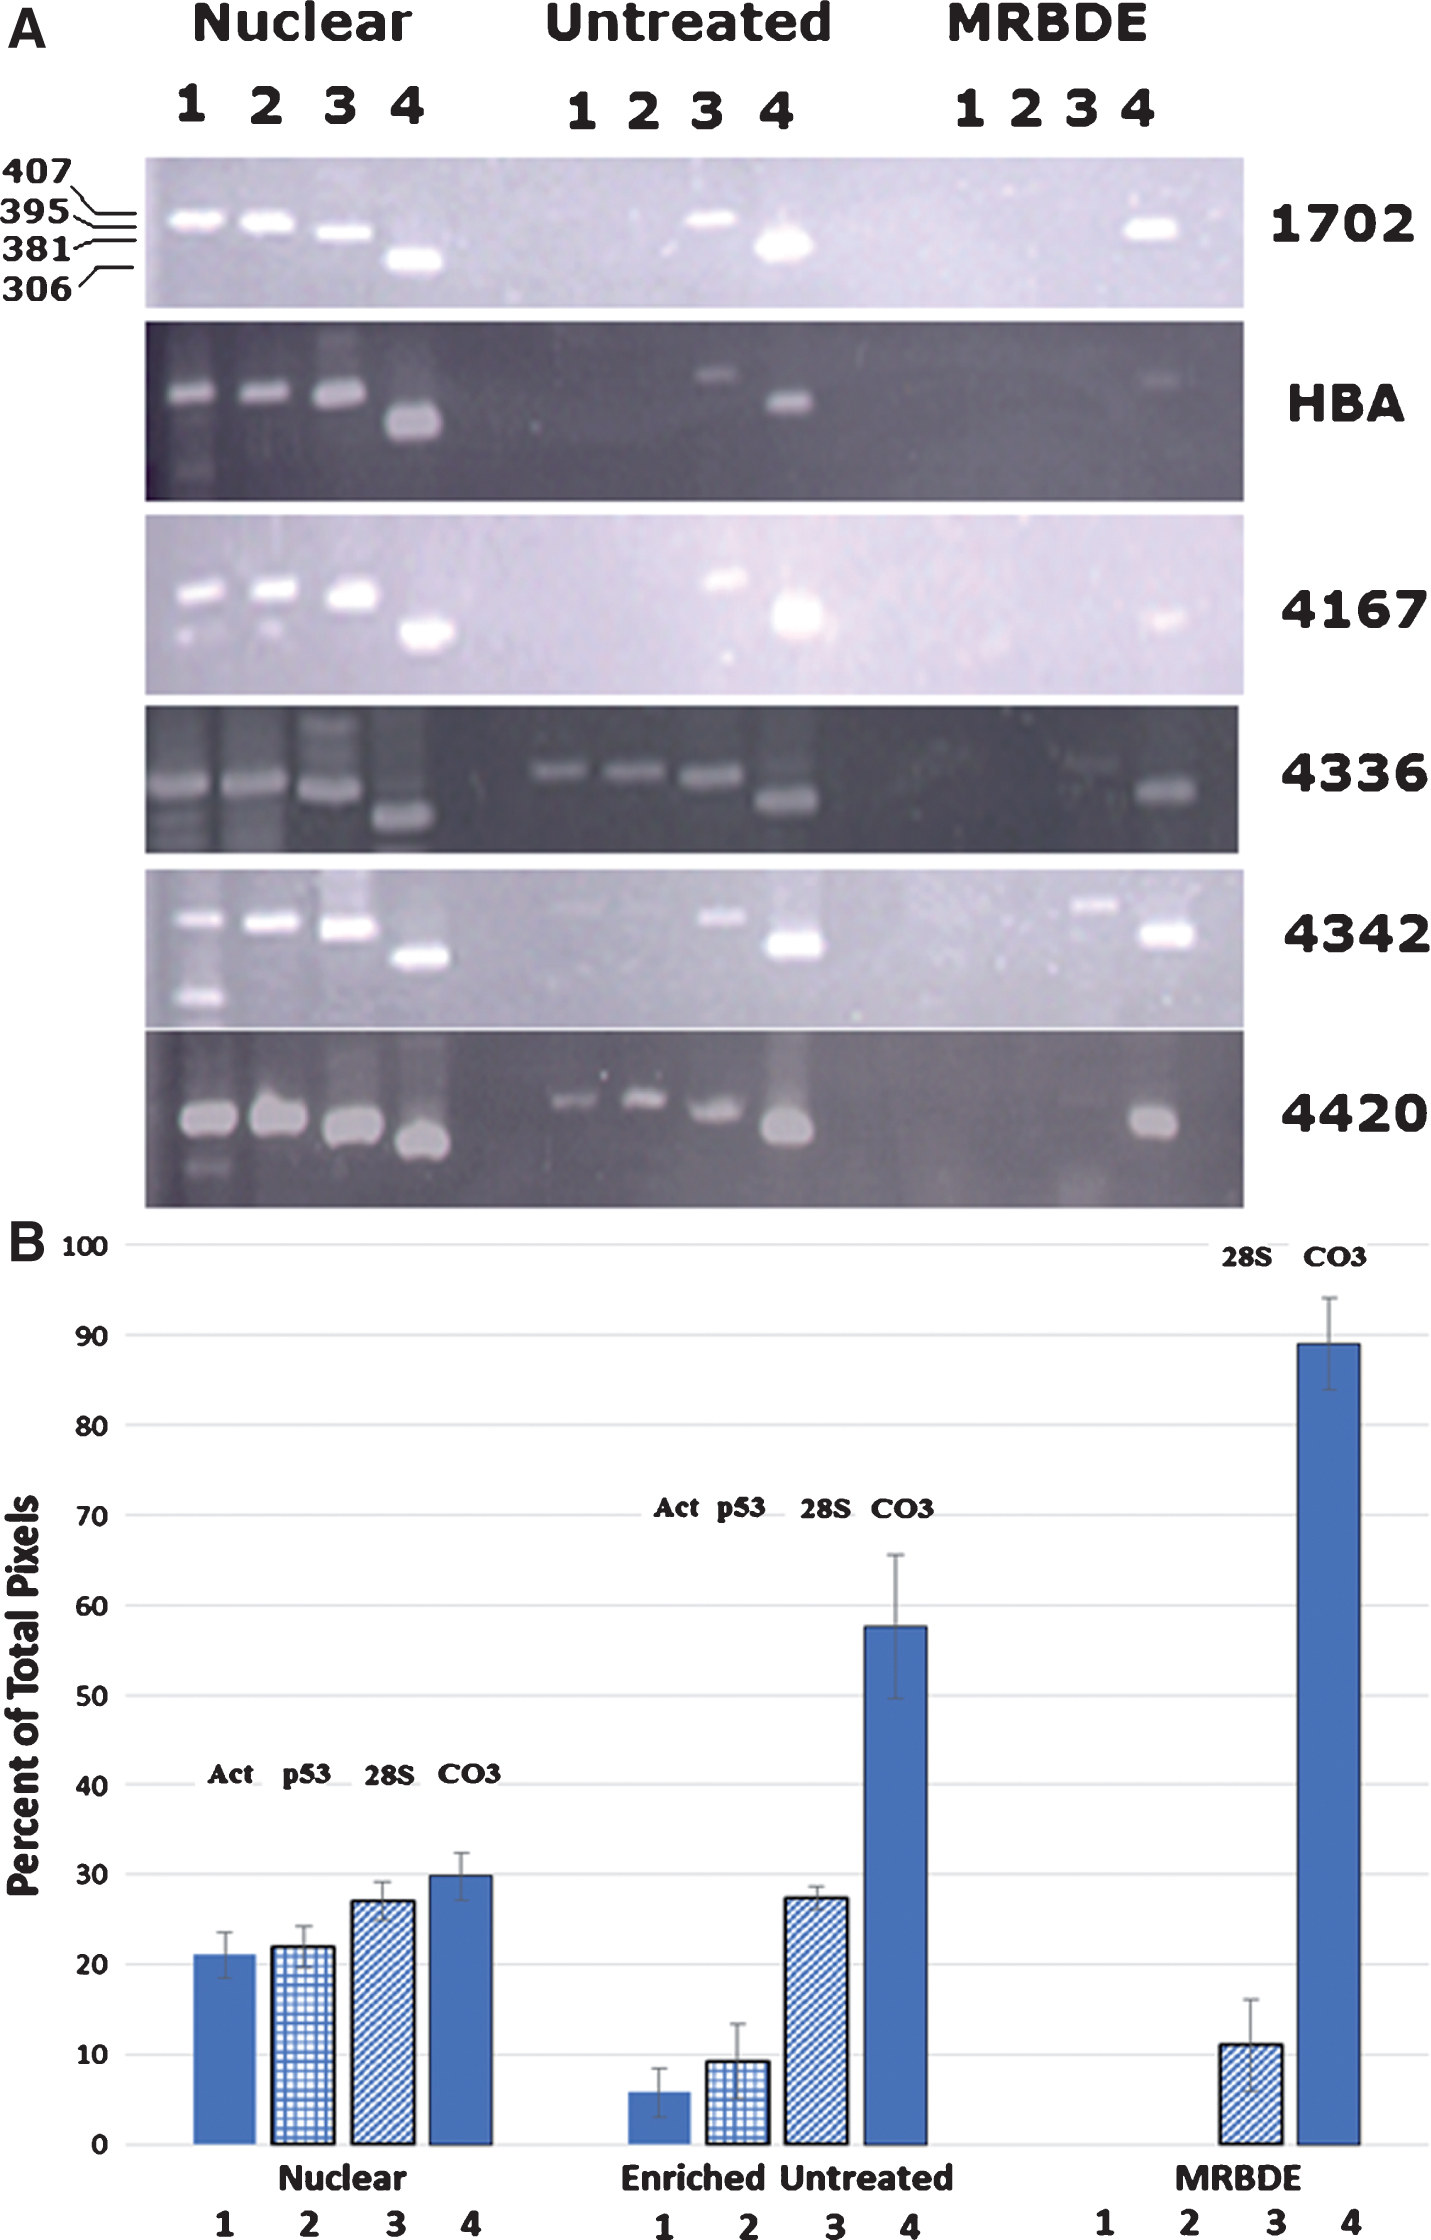
PCR indicates amplification of mtDNA sequences. A) Agarose gel electrophoresis of PCR products from DNA isolated from a nuclear pellet (Nuclear), mtDNA-enriched DNA (Untreated), and mtDNA recovered after treatment with micrococcal nuclease, RNAase, Bgl II, Dra III, and Exonuclease III (MRBDE). For each of the samples (1702, HBA, 4167, 4336, 4342, 4420) PCR products were generated from primers specific for actin (lanes 1, 407 bp), p53 (lanes 2, 395 bp), 28S rRNA (lanes 3, 381 bp), and cytochrome oxidase subunit III (lanes 4, 306 bp). MWM is a 100 bp molecular weight ladder. B) Diagram of the quantitation of each of the bands in lanes 1–4 (Act, p53, 28S, and CO3) for each of the three samples (Nuclear, Enriched Untreated, and MRBDE). The intensity in each band was quantitated by Image J analysis and compared to the total intensity measured for the four bands in each sample. The percent of the pixels for each band relative to the total pixels for the four genes amplified for that sample group is then plotted on the y-axis.
It can be seen in Fig. 3A that the nuclear pellet, in addition to containing nuclear DNA, contains significant amounts of mtDNA (lane 4, Nuclear) in each of the six AD samples tested. The average percent of the total intensity due to amplification with the mtDNA-specific primers was 30% (Fig. 3B). When these same PCR primers were used to assess the DNA content of the enriched-mtDNA preparations from these same six AD samples (Enriched Untreated), it can be seen that the amount of contaminating nuclear DNA is significantly reduced in all cases, with samples AD1702, ADHBA, and AD4167 showing no evidence of the low copy number actin and p53 genes and a reduced amount of the multicopy rRNA genes while the relative amount of mtDNA product (CO III) is increased, now representing approximately 60% of the total intensity of all four amplified genes (Fig. 3B). When the treatment with Bgl II, Dra III, and Exonuclease III was included in the preparation (MRBDE), the residual nuclear DNA contamination was effectively removed except for a low level (10%) of multi-copy rRNA sequence, while the percent of the total amplified products seen with the mtDNA-specific primers was almost 90% (Fig. 3B). Once again, the amount of mtDNA sequence is enhanced relative to the level of contaminating nuclear DNA.
To demonstrate that the detection of the T9861C mutation in these AD samples was truly due to a base substitution in organellar mtDNA and not from mitochondrial pseudogenes, we performed the SNPE assay on the MRBDE-treated and untreated (mtDNA-enriched) samples. If our mtDNA-enriched preparations had been contaminated with a nuclear encoded sequence, the assay of the MRBDE-treated samples, lacking such nuclear DNA, should show little if any C. On the other hand, if we had been detecting the T9861C mutation in organelle mtDNA from these AD patients, then the MRBDE-treated samples should show significant amounts of C (at least greater than 5% and possibly on the order of magnitude as that seen in the untreated samples).
Table 2 shows the results of this analysis. As can be seen, in all cases the mutant detected in mtDNA-enriched DNA preparations (Untreated) is also detected in the MRBDE-treated samples, indicating that the mutation observed is present in organellar mtDNA not in mitochondrial pseudogenes.
Relative proportions of wild-type and mutant mtDNA in AD+ samples with or without MBRDE treatment
aBased on an average of two determinations for each sample.
This was further supported by a second approach to eliminate nuclear embedded mtDNA sequences as a source of the mutant sequence. We isolated DNA from rho zero cells which lack mtDNA and subjected this DNA to PCR amplification using the same actin, p53, rRNA, and CO III primers as in the previous experiment. As Fig. 4A shows, the nuclear pellet yields DNA which contains both nuclear and mtDNA sequences (lanes 1–4). The mtDNA-enriched, untreated sample yielded detectable PCR product only with the CO III primers (306 bp product, lane 8) indicating the very successful elimination of nuclear DNA during the preparation of this mtDNA-enriched sample (Fig. 4B). In addition, the ρ0 DNA sample yielded PCR products only with primers to nuclear encoded genes (lanes 9–11) with no mtDNA product being generated (lane 12), as would be expected for cells lacking mtDNA (Fig. 4A, B). This result further argues that our CO III primers and PCR conditions are selective for organelle mtDNA.
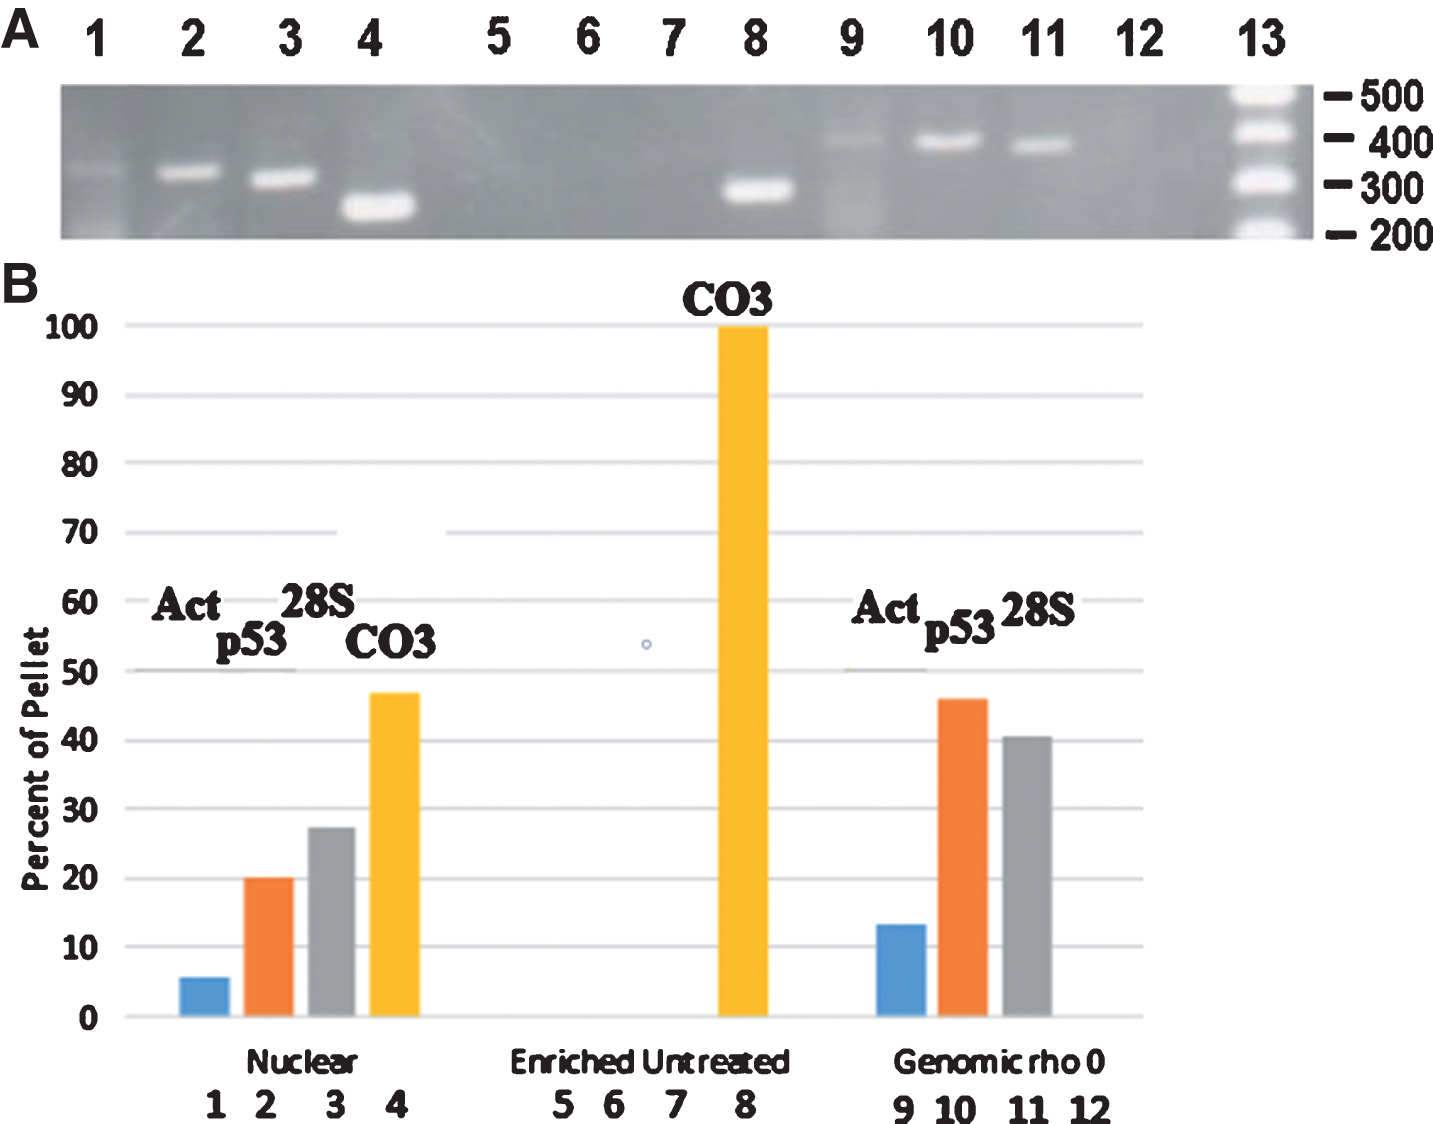
Agarose gel electrophoresis of PCR products generated from various DNA templates. A) Lanes 1–4, DNA extracted from an AD nuclear pellet; lanes 5–8, enriched-mtDNA; lanes 9–12, genomic DNA from ρo cells. Lanes 1, 5, and 9 – amplification with human alpha-actin primers producing a 407 bp product; lanes 2, 6, and 10 – amplification with p53 primers producing a 395 bp product; lanes 3, 7, and 11 – amplification with 28S rRNA primers producing a 381 bp product; lanes 4, 8, and 12 – amplification with CO III primers producing a 306 bp product. Lane 13, 100 bp ladder molecular weight markers. B) Diagram of the quantitation of each of the bands (Act, p53, 28S, and CO3) in agarose gel lanes 1–12 for each of the three samples (Nuclear, Enriched Untreated, and Genomic rho0). The intensity in each band was quantitated by Image J analysis and compared to the total intensity measured for the four bands in each sample. The percent of the pixels in each band was then plotted on the y-axis. These data result from one experiment.
Quantitation of T9861C in caudate, hippocampus, temporal cortex, and parietal cortex of several AD samples
The presence of the T9861C mutation in the parietal cortex (PC) region of some of the AD samples and the absence of this mutation in other AD samples as well as in the control brains suggested a possible association between the T9861C mutation and the occurrence of AD in a subset of AD patients. To determine whether the T ⟶ C mutation was localized to the PC region of the brain or whether it was distributed throughout various brain regions, we extracted mtDNA from the caudate (C), hippocampus (H), temporal cortex (TC), and PC of four AD+ samples. We focused on these four AD samples because 1) they had tested positive for T9861C and 2) each of these different brain regions was available for each of these samples.
When the quantitative SNPE assay was performed, it was clear that the T ⟶ C mutation was not localized to a single brain region but was, in fact, present in multiple regions including the caudate and temporal cortex of affected brains. Interestingly, we did not find evidence for the presence of the T ⟶ C mutation in the hippocampus of any of the samples tested. Table 3 shows the results of quantitation of these assays.
Distribution of the T9861C mutation in four regions of AD brainsa
aThe values represent the percentage of C in that sample as determined by the SNPE assay. Based on the average of two determinations per region per sample.
As can be seen in Table 3, for each sample, the parietal or temporal cortex region had a higher proportion of T9861C than did other regions. The control sample (4320Con) showed no or barely detectable amounts of the mutant C residue which was indistinguishable from background noise. Thus, the T9861C mutation was found in multiple regions of affected brains, with the highest mutant load occurring in the parietal or temporal cortex in the affected brains.
Effect of T9861C on CO activity
The occurrence of the T9861C mutation at a much higher frequency in AD brains compared to those of age-matched controls strongly suggests an association of this mtDNA mutation with the development or progression of the bio-energetic deficit seen in AD. This mutation alters the codon at amino acid position 219 of CO subunit III, replacing the wild type phenylalanine with a leucine. If this T9861C mutation is actually linked to AD then the effect of the mutation would be expected to alter the structure and/or function of the mutant CO subunit III. The result of this alteration might be expected to be manifested in an altered CO activity. A mitochondrial extract was prepared from parietal cortex of the AD, AD+, and control brain samples and CO activity was measured. To normalize for general mitochondrial enzyme activity, CS activity, a quantitative marker enzyme for the content of intact mitochondria, was also determined and the ratio of CO to CS specific activities was calculated. These enzyme specific activities and the CO/CS ratios are shown in Table 4 and diagrammatically in Fig. 5.
Cytochrome oxidase and citrate synthase specific activities in control, AD, and AD+ brainsa
aNumbers in parentheses represent standard deviations.

Reduction in CO activity in AD brain samples. The normalized ratio of CO/CS is seen to decrease by 32.6% in AD samples and by 48.5 % in AD+ samples when compared to age-matched controls. The trend-line indicates an increasing reduction in CO/CS ratio with AD and AD+ samples compared to controls. There is a statistically significant reduction in AD versus Control (*p = 0.019) and AD+ versus Control (**p = 0.001). The difference between the AD and AD+ samples is not statistically significant (***p = 0.317).
The average CO/CS value for the six age-matched control brains was 37.03±10.52. When identical assays were performed with six AD samples not possessing the T9861C mutation, the mean CO/CS ratio was 24.95±4.59. Likewise, CO and CS measurements in six AD+ brain samples showed a mean CO/CS value of 19.08±2.26. Comparison of the AD samples that do not possess the T9861C mutation with the age-matched controls shows that the CO/CS ratio was reduced 32.6% in the AD samples, in agreement with earlier observations [12]. Interestingly, the six AD+ samples show an average CO/CS (19.08±2.26) that is only 51.5% of the average activity in age-matched controls. This 48.5% reduction of CO/CS in AD+ brains is 1.4-fold greater than the average reduction seen in AD patients in our current study as well as in earlier reports [12]. Compared to age-matched control brains, this reduction in the CO/CS ratio in AD+ brains is statistically significant (p = 0.001). In fact, if the CO/CS ratio from the AD+ brain with the highest amount of mutant load (1702, 89% mutant load in this experiment) is compared to control brains, there is a 59% lower CO/CS ratio. The increased reduction in CO/CS in these AD+ samples compared to controls further suggests an association of the T9861C mutation with the compromised energy metabolism seen in AD, although this increased inhibition of the CO/CS ratio is not significant when compared to that seen in the AD samples (p = 0.317).
DISCUSSION
We have examined 40 archived AD brain samples and an equal number of age-matched controls. Six AD samples were found to harbor the T9861C mutation. No age-matched control brain samples were found to contain the mutation while thirteen reported instances of the mutation were uncovered in a survey of 9,986 human mtDNA sequences deposited in a variety of world-wide DNA databases including GenBank at the National Center for Biotechnology Information, EMBL (European Molecular Biology Laboratory) and DDBJ (DNA DataBank of Japan). The rate of occurrence, 15% in frozen AD brain tissue, is 115-fold higher than that in the population represented by the sequences deposited in the DNA databases (0.13%, Fig. 6). It is possible that all or a fraction of the thirteen sequences deposited in the database represent AD patients, either diagnosed or undiagnosed. Interestingly, in preliminary investigations of platelet mtDNA isolated from 25 AD patients and 18 control subjects we have not yet detected the presence of the T9861C mutation by the mismatched-PCR-RFLP assay (unpublished observation). Whether the T9861C mutation is tissue-specific requires further study.

Relative frequency of the T9861C mutation per thousand subjects. Of the 40 AD brains examined in this work, 15% possessed the T9861C mutation with a mutant load ranging from 20–94%. Of 9,986 human mtDNA sequences deposited in DNA data bases, only 13 or 0.13% contained the T9861C mutation. None of the 40 control brains tested possessed the T9861C mutation.
In this work, we have also shown that the mutation is not evenly distributed but it occurs at different levels in different regions of the brain (Fig. 7). A similar observation has been reported by Turnbull and co-workers in an analysis of a patient with mitochondrial encephalomyopathy, lactic acidosis and stroke-like episodes (MELAS) where the mutant load of the A3243G mutation varied from 54% in the cerebellar cortex to 81% in the choroid plexus [31]. In our AD+ samples, the mutant load appeared to be highest in the parietal or temporal cortex, with lesser amounts in the caudate. The T9861C mutation was essentially absent from the hippocampus. In the above MELAS study it was found that in the brain regions with the most severe pathological changes, such as the occipital cortex and the cerebellum, virtually no CO-deficient neurons were found. It is important to note that this lack of correlation does not necessarily mean that biochemical abnormalities within the neurons did not precede the cell loss. This loss of severely affected neurons in the hippocampus of our AD+ samples could explain the absence of the T9861C mutation in this brain region.

The distribution of the T9861C mutation in various regions of the brain. The brain region values are the average from 4 different AD samples that were found to carry the T9861C mutation. Unfortunately, multiple brain areas were not available for all brain samples obtained.
The presence of the T9861C mutation also seems to have a deleterious effect on CO activity. As Parker and others have demonstrated [12], AD patients will manifest an average decrease of 30% in CO activity when brain tissue or platelets are sampled. The data shown here indicate that the AD+ brain samples have a CO/CS specific activity ratio that is on average reduced by 48.5% and as much as 59% in certain samples relative to that of age-matched control samples. Due to the absence of clinical pathology on most of our archived brain samples, it has not been possible to correlate mutant load, CO deficit, and AD-stage or pathology.
However, an examination of the molecular structure modeled using the University of California San Francisco program Chimera shows that replacement of the phenylalanine with leucine disrupts a cluster of phenylalanines that could be providing a significant level of conformational stability in this region of the protein structure. Replacement of F219 with L219 would reduce the stabilizing aromatic interactions among the four phenylalanines seen in Fig. 8A while increasing the conformational flexibility in this region of the structure. This could generate sufficient instability to render the L219-containing subunit unable to fit properly into the biologically active structure comprising the remainder of the wild type cytochrome c oxidase enzyme complex. Such conformational change could reduce enzymatic activity, as we see in those brain samples containing this T9861C mutation. Support for this hypothesis is offered by analysis with the polymorphism analytic tool polymorphism phenotype v 2 (PolyPhen2). A score of 2.15 is obtained by transformed polyphen2 analysis and 1.9 is obtained with transformed SIFT (Sorting Intolerant From Tolerant) analysis. Scores of this magnitude are strongly correlated with a pathogenic nucleotide change as each of these programs categorizes the T9861C mutation as having High Impact as a deleterious mutation. Interestingly, a T ⟶ C mutation at a nearly position in subunit III (np 9957) also leads to replacement of a Phe with a Leu. This T9957C mutation has been linked to several mitochondrial disorders including MELAS [32], non-arteritic ischemic optic neuropathy and seizures [33], and chronic progressive external ophthalmoplegia [34].

Ribbon model of CO III containing the T9861C mutation. Molecular model of region of subunit III of cytochrome oxidase with the wild type Phe at position 219 shown in red (A) and the mutant Leu at that same position (B).
A complicating aspect of our investigations has been the focal nature of the affected mitochondria possessing the T9861 mutation. Although we have never failed to detect the mutation in sample AD1702, that has not been the case for the other AD+ samples. In each of the other samples, there have been instances when a 150–200 mg sample of the frozen brain has been processed only to find that that particular area of the brain little if any mutant mtDNA. A partial explanation for this observation is that the mtDNA mutation is not uniform in its distribution throughout the brain tissue. In addition, T9861C appears to occur in small, defined loci. Thus, it is quite possible to obtain a small section of brain tissue that is devoid of the mutation. This observation should not be unique to the T9861C mutation, so other focal mtDNA mutations may be or have been present but not detected in screens of AD brain tissue by other investigators. Such focal accumulations of mtDNA point mutations [35] and deletions [36] have been reported.
A more efficient approach to screening mtDNA mutations in affected cells within affected tissues would be of great benefit. In that vein, we have initiated a study to capture individual neurons from tissue slices stained with mitochondrial function-specific dyes, to isolate mtDNA from affected neurons, and to test for the T9861C mutation in those neurons manifesting abnormal mitochondrial staining.
With respect to the statistical analysis of the CO/CS ratios and the mean differences in the three populations (control, AD, and AD+), power to detect differences is not an issue due to this work serving as a pilot study to provide preliminary data for assessing the effect of T9861C on cytochrome oxidase structure and function. Results from the current study are based on small samples in each group. Nevertheless, like our small convenience samples, comparable small sizes have been reported in similar studies by Blanchard et al. (n = 6 for each group) [37], Hamblet et al. (n = 9 for each group) [20], Lezza et al. (n = 7 and n = 6) [38], and Foti et al. (n = 10 in each group) [39].
Footnotes
ACKNOWLEDGMENTS
This work was supported by grants from the Virginia Center of Aging Alzheimer’s and Related Diseases Research Award Foundation and from the Commonwealth Health Research Board. The funders had no role in study design, data collection and analysis, decision to publish, or preparation of the manuscript.
