



Abstract
Exosomes are nano-sized extracellular vesicles that are secreted by cells and usually found in body fluids. Since they freely cross the blood-brain barrier, neuronal exosomes respond directly to changes in the brain’s environment. Recent studies have shown that exosomes contain both amyloid-β (Aβ) and tau proteins and have a controversial role in the Alzheimer’s disease (AD) process. In this study, enzyme-linked immunosorbent assay was used to detect the levels of P-S396-tau and Aβ1–42 in plasma exosomes. We found that levels of P-S396-tau and Aβ1–42 in plasma exosomes of AD patients were significantly higher compared to those in matched healthy controls. The difference between plasma exosomes of AD patients and those of matched healthy controls was determined using transmission electron microscopy and nanoparticle tracking analysis. Exosomes from AD patients were smaller and lower in quantity. These data together may provide a basis for early diagnosis of AD.
Keywords
INTRODUCTION
Most neurodegenerative diseases are characterized by intracellular or extracellular protein accumulation, and one such disease is Alzheimer’s disease (AD) [1]. AD is an irreversible and progressive brain disorder associated with dysfunction in memory and cognition. Its incidence increases with age, affecting up to 40% of people over the age of 85. However, current treatments are very limited and only partially effective [2].
The main pathological markers of AD are extracellular amyloid deposition and intracellular neurofibrillary tangles, which are formed by the amyloid-β protein precursor (AβPP) cleavage product amyloid-β (Aβ) and the microtubule-associated protein tau [3]. New imaging methods (such as positron emission computed tomography and magnetic resonance imaging (MRI)) and cerebrospinal fluid (CSF) biomarkers have been developed in order to establish a multivariate classification for AD [4], but clinical implementation is difficult.
Since peripheral blood is more easily accessible than CSF, blood biomarkers would be more efficient for clinical diagnosis or screening. However, due to the blood-brain barrier effect, only a small fraction of brain protein enters the peripheral blood where it is greatly diluted. Furthermore, since they have no membrane protection, proteins are prone to protease degradation and liver clearance in the blood, making blood biomarkers less predictive of protein changes in the brain than CSF biomarkers. All these factors limit blood samples as potential biomarker sources for AD diagnosis [5]. But recent progress in the study of exosomes has provided an alternative approach.
Exosomes are important intercellular messengers and significant contributors to both health and disease [3]. The cell membrane buds inward to form small intracellular vesicles [6], gradually matures and finally fuses to form multivesicular bodies (MVBs). The MVBs then bud inward to form intraluminal vesicles. The fusion of an MVB to a lysosome leads to the degradation of its contents while fusion with the plasma membrane leads to the release of exosomes into the extracellular environment [7, 8]. Because exosomes freely cross the blood-brain barrier, neuronal exosomes respond directly to changes in the brain’s environment. Exosomal contents (including nucleic acids, proteins, and lipids) change under disease conditions, and exosomal membranes protect the contents from degradation. Exosomes can spread pathogenic proteins in high enough concentrations to improve the sensitivity of detection. All these characteristics make exosomes a valuable diagnostic tool [9]. Exosomes have been identified as one of the cellular mechanisms that may be associated with Aβ and tau secretions and subsequent toxicity and neurofibrillary lesions in AD [10]. Previous studies have indicated that P-tau and Aβ levels found in exosomes reliably predict the development of AD long before the onset of the disease [11].
In AD, toxic Aβ accumulates in the brain parenchyma. Exosomes receive AβPP from early endosomes after cleavage produces Aβ peptide fragments [12]. A portion of Aβ aggregates to form highly insoluble amyloid plaques. In this process, the most important protein is Aβ1–42 [13], since it is more hydrophobic than the shorter Aβ [14], and is more likely to accumulate in the brain. Normal non-amyloidogenic transport of AβPP involves its cleavage by α-secretase on the plasma membrane, which produces a transmembrane C-terminal fragment (CTFα) [15]. CTFα is further endocytosed and trafficked to early endosomes.
Unfortunately, it is still very challenging to study exosomes let alone use them as a diagnostic tool for AD due to their comparatively small size [16]. In this article, we use transmission electron microscopy (TEM) and another new technique, nanoparticle tracking analysis (NTA), to characterize the morphology and number of plasma exosomes.
The four transmembrane protein superfamily (TM4SF) (CD63, CD81) is expressed on the surface of all exosomes. Exosomal levels of CD63 indicated the total number of exosomes. Differences in the concentrations of P-S396-Tau and Aβ1–42, which were normalized by CD63, were compared [9, 17–19]. The aims of this article are to examine the differences in the morphology and number of plasma exosomes as well as biomarkers between AD patients and healthy controls.
MATERIALS AND METHODS
All samples were provided by Henan Provincial People’s Hospital. Inclusion criteria: all patients with AD were deemed likely to have AD according to the latest diagnostic criteria for NINCDS-ADRDA from 2011. Normal subjects were healthy individuals matched with AD patients in terms of age, region, education, and gender. Exclusion criteria: subjects with frontotemporal dementia, trauma, infection, epilepsy, vascular and other types of dementia based on medical history and magnetic resonance and CT examination were excluded. Plasma samples were collected from patients who met the inclusion criteria and did not meet the exclusion criteria in the neurology ward and outpatient clinic of Henan Provincial People’s Hospital after May 1, 2018. Plasma samples were collected concurrently from healthy subjects who matched the age, region, education level, and gender of AD patients at Henan Provincial People’s Hospital Medical Center. Each participant also underwent an MRI examination (Fig. 1) and cognitive assessment scale (Table 1). MRI of patients with AD could show significant atrophy of the cerebral cortex, especially the hippocampus and medial temporal lobe, and the severity of the disease is positively correlated with the degree of hippocampal atrophy. some representative images were selected (Fig. 1). The clinical manifestations of AD in the patients, all of whom were in the moderate to severe stages of disease progression, were characterized by varying degrees of memory loss, decreased language function, behavioral abnormalities, personality changes, social disorders, and gradual loss of daily living ability. 5 ml of blood was collected in EDTA anticoagulant tubes from all subjects and fasting plasma samples were collected 8 AM from all subjects. After being centrifuged at 3000×g for 1 min, isolated plasma was collected in 2 ml sterile tubes and stored at –80°C. Informed consent was obtained from all persons prior to their inclusion in the study. Details that might disclose the identity of the subjects under study have been omitted.
Demographic information for AD and control populations
Data for quantitative traits are mean±SD values. AD, Alzheimer’s disease; MoCA, Montreal Cognitive Assessment; MMSE, Mini-Mental State Examination.
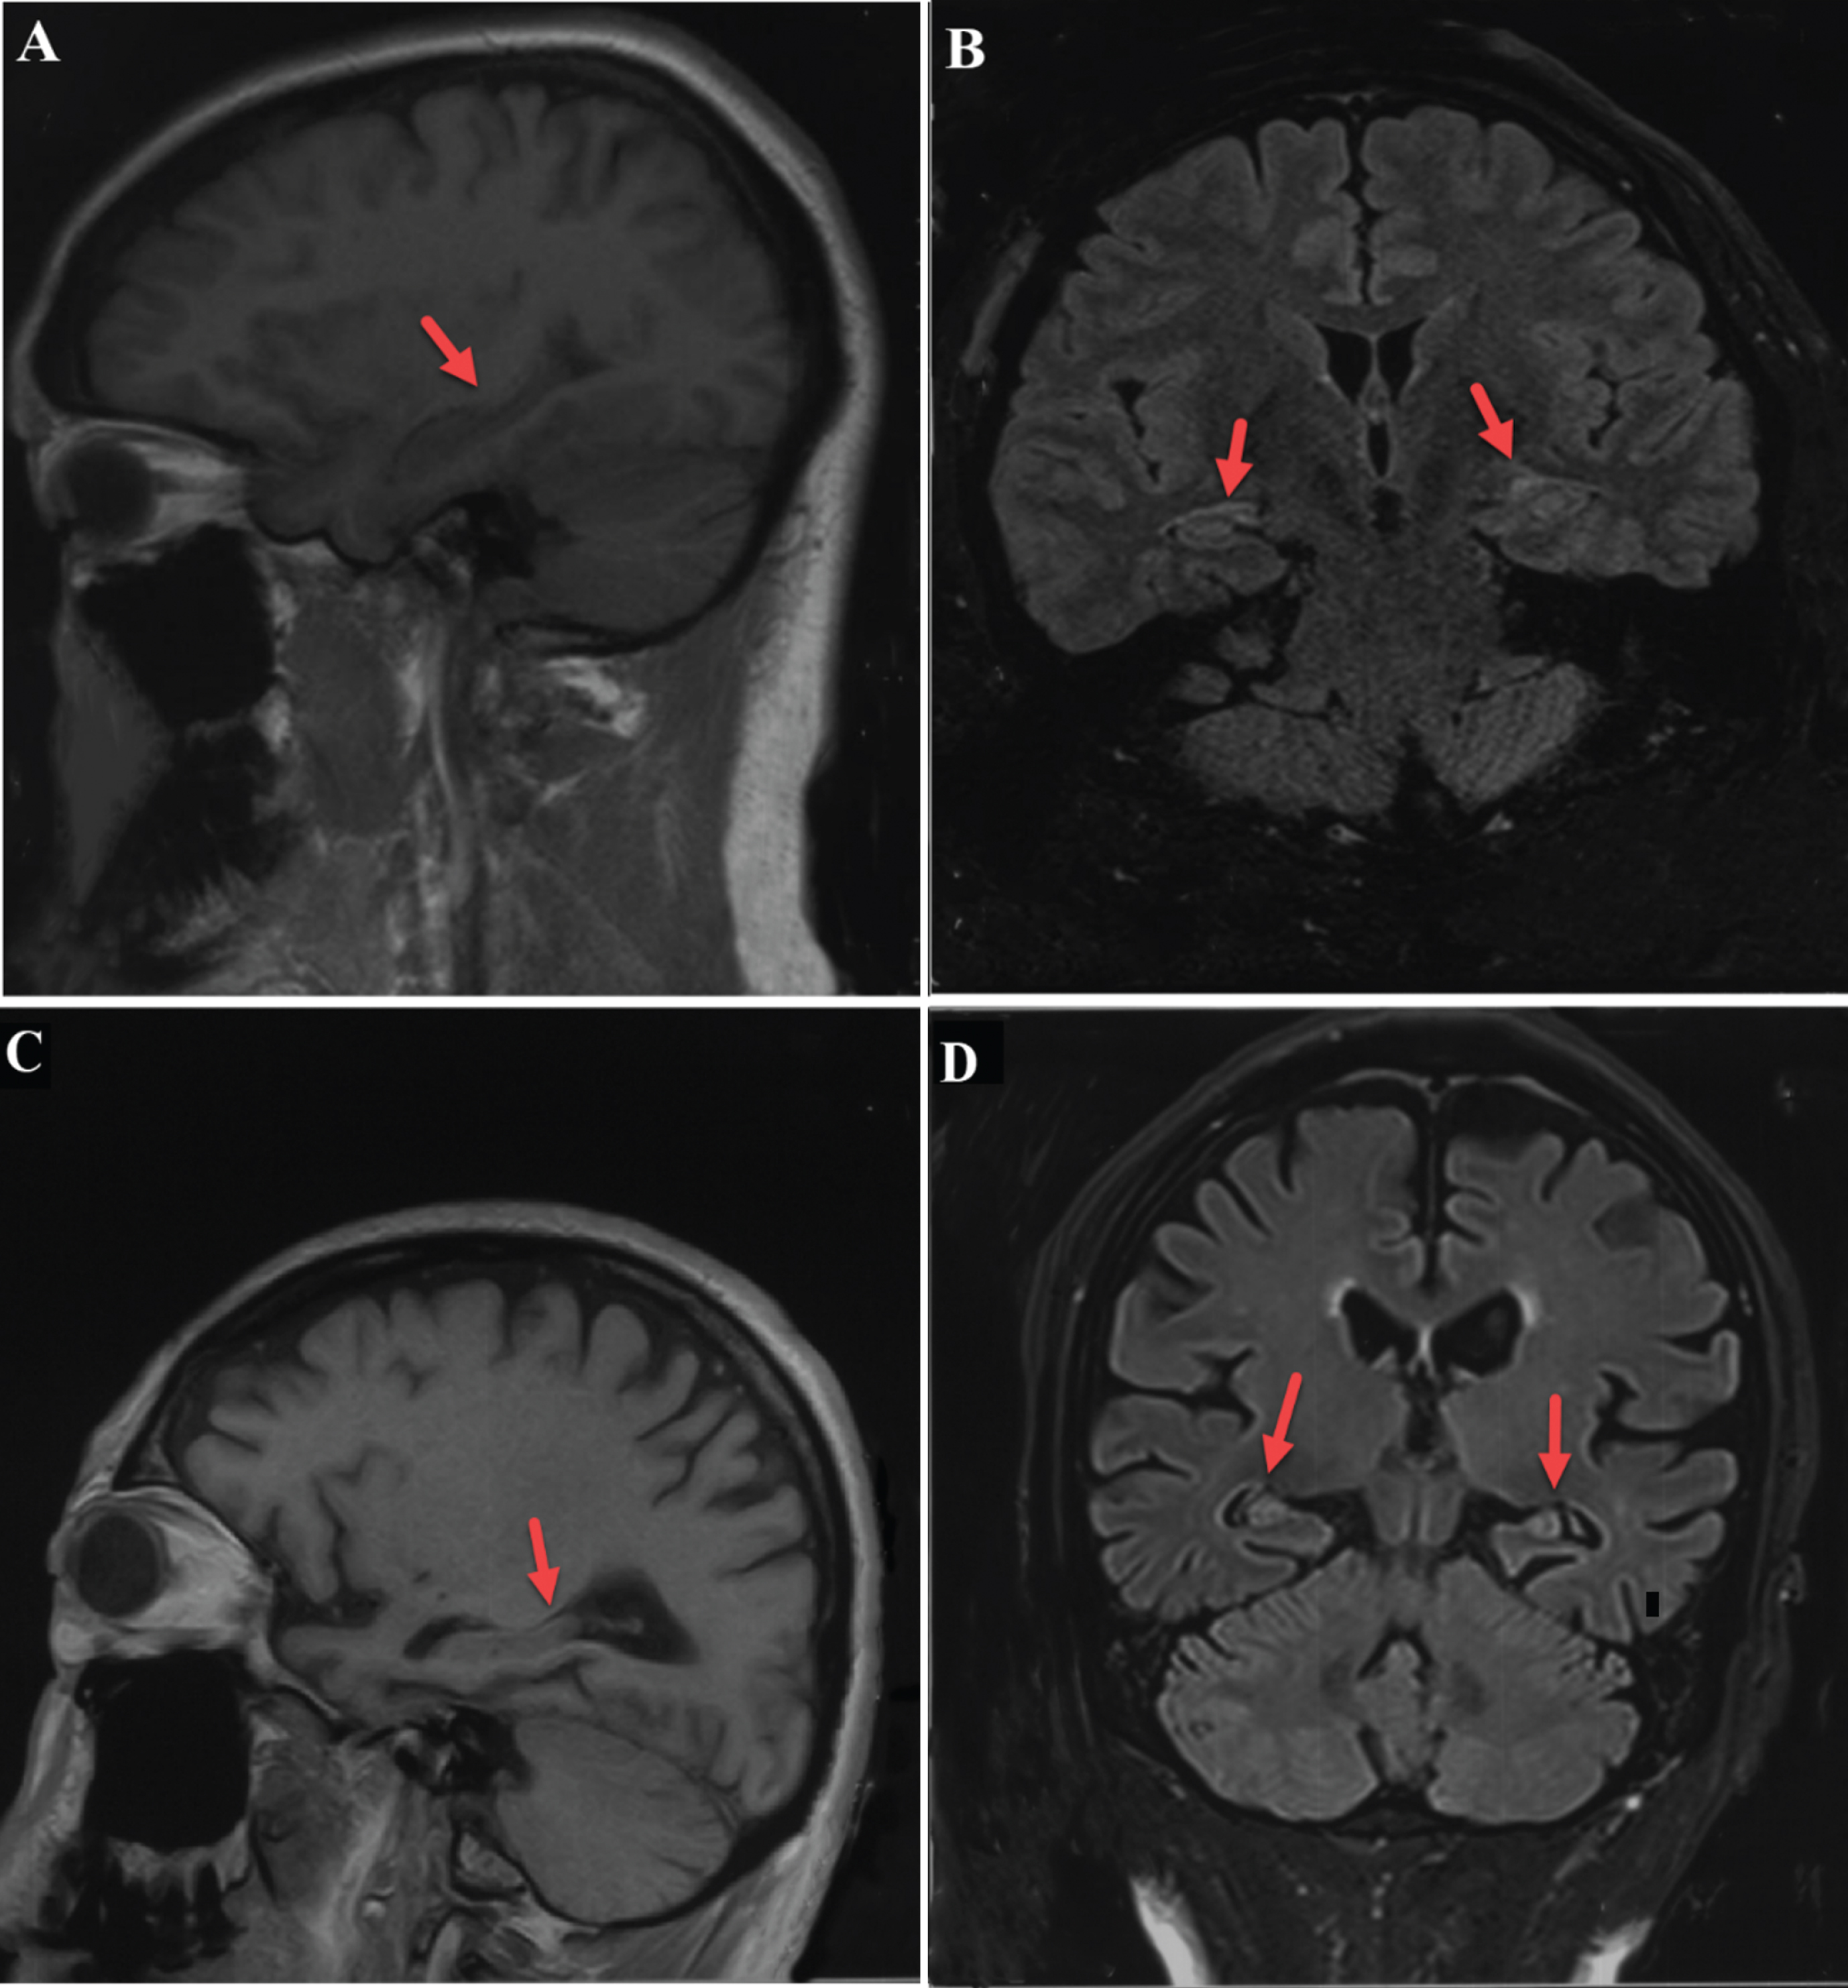
A,B) Head MRI of normal subject: the hippocampus appears to have normal volume in T1 sagittal view and T1 FLAIR coronal view. C, D) Head MRI of AD patient: The hippocampus appears severely atrophied in both T1 sagittal and T1 FLAIR coronal view.
Plasma exosome isolation
Plasma samples were thawed at 4°C. Then 250 μl of plasma was transferred to a sterile tube and centrifuged at 3000×g for 15 min to remove cells and cell debris. The supernatant was then transferred to a sterile vessel, mixed with 63 μl ExoQuick Exosome Precipitation (ExoQuickTM SBI)and incubated at 4°C for 30 min. Afterward, the ExoQuick/biofluid mixture was centrifuged at 1500×g for 30 min. After centrifugation, the exosomes appeared as a beige-colored mass at the bottom of the vessel. Finally, the supernatant was aspirated and samples were spun down in ExoQuick solution at 1500×g for 5 min. All traces of fluid were removed by aspiration, taking great care not to disturb the precipitated exosome pellet.
ELISA
The plasma exosome samples came from 120 participants, including 60 AD patients and 60 matched healthy controls who had no significant difference in age, gender, and education level. 300 μl lysate and 3 μl protein inhibitor was added to the exosomes extracted from plasma and the mixture was vortexed for 15 s and resuspended in solution. The solution was chilled at –80°C for 5 min then left at 25°C for 5 min, and 3 cycles of chilling and thawing were repeated. The solution was then stored at –80°C and taken out to thaw when needed. Proteins derived from plasma exosomes were quantified using enzyme-linked immunosorbent assay (ELISA) kits (Enzyme Biosystems) for Aβ1–42, P-S396-tau, and CD63, which was used for normalization of biomarkers. The specimen, standard and HRP-labeled detection antibodies corresponding to four specific proteins were sequentially added to microwells pre-coated with human amyloid Aβ1–42, P-S396-tau, and CD63 capture antibody, respectively. The microwells were incubated and washed thoroughly. The substrate TMB was used to develop color. TMB was first converted to a blue color under the catalysis of peroxidase and converted to the final yellow color by the action of an acid. The color depth was positively correlated with Aβ1–42, P-S396-tau, and CD63 in the sample.
Transmission electron microscopy
The plasma exosome samples came from 20 participants, including 10 AD patients and 10 matched healthy controls who had no significant difference in age, gender, and education level. The exosome pellet was resuspended in 30 μL PBS. 10 μL were then removed and diluted in 100 μL PBS. 3 μL of solution was placed onto a copper net grid with carbon film suitable for use in the electron microscope. After 1 min, excess fluid was wicked off and a drop of phosphotungstic acid dye solution was added. After 1 min, excess fluid was wicked off once more and the sample was allowed to air dry. Finally, the completely dry copper mesh was photographed using a Philips-FEI Tecnai TEM (FEI T12).
Nanoparticle tracking analysis
Plasma exosome samples were taken from 20 participants, including 10 AD patients and 10 matched healthy controls who had no significant difference in age, gender, or education levels. The exosome pellet derived from blood was resuspended in 300 μL PBS. The resultant mixture was diluted 100 times in preparation for testing using the NanoSight LM10 instrument (NanoSight Ltd., Amesbury, United Kingdom), which sends a finely focused laser beam through a glass prism to illuminate the sample (a liquid containing a dilute suspension of particles).
Each sample was run 3 times, and two 60 s videos were captured each time. All analysis settings were kept constant within each experiment. Size distribution profiles obtained from NTA were averaged for each sample across the video replicates and then averaged across samples to determine representative size distribution profiles.
Statistical processing
Statistical analysis was performed using SPSS Statistics 21.0 software. Two independent sample t-tests were run for the continuous variables (i.e., the number of exosomes and the level of protein) with normal distribution. The data obtained were represented by X±S. p < 0.05 was considered statistically significant.
RESULTS
ELISA
Levels of the pathological proteins P-S396-tau and Aβ1–42 in plasma exosomes were quantified using ELISA kits. The results showed that the levels of P-S396-tau and Aβ1–42 were significantly elevated in the AD population compared to levels in the control population (p = 0.007, p = 0.032, respectively; n = 60 AD, n = 60 controls). These data suggested that aggregation of these pathological proteins might occur in plasma exosomes in AD patients. Levels of these pathological proteins in plasma were also directly measured. Levels of P-S396-tau and Aβ1–42 were higher in the plasma of AD patients compared to healthy subjects; however, the difference was not statistically significant (p = 0.563, p = 0.635, respectively; n = 60 AD, n = 60 controls). The difference in CD63 levels between AD patients and matched healthy subjects was not statistically significant (p = 0.191 > 0.05; n = 60 AD, n = 60 controls) (Fig. 2).

Comparison of pathological protein levels from plasma exosomes of AD patients and matched healthy subjects: Levels of Aβ1–42, CD63, and P-S396-tau, respectively, in plasma exosomes of AD patients and matched controls. Error bars, representing one standard deviation of the sample mean, reflect the variance between sample means.
TEM
Ring-shaped plasma exosomes were observed in both AD patients and the healthy control group. Compared to those from the matched control group, the exosomes from AD patients were relatively concentrated. Previous studies have shown that exosomes may shrink or change size during preparation for TEM [20], but electron microscopy is still useful for observing the morphology of exosomes (Fig. 3).

Electron micrograph of plasma exosomes. A) Picture of plasma exosomes from normal subjects at 100 nm. B) Picture of plasma exosomes from AD patients at 100 nm.
NTA
Exosomes are believed to be most abundant in the lowest size range (30–150 nm) [21, 22], so the number of exosomes with diameters from 30–150 nm in the control and AD groups was compared. The number of plasma exosomes with diameters ranging from 30–150 nm in AD patients was greater than that in healthy subjects on the whole, but the difference was not statistically significant (p = 0.167 > 0.05). However, the mode size of plasma EVs in AD patients was smaller than that in the control group overall, and the difference was statistically significant (p = 0.048 < 0.05) (Fig. 4).
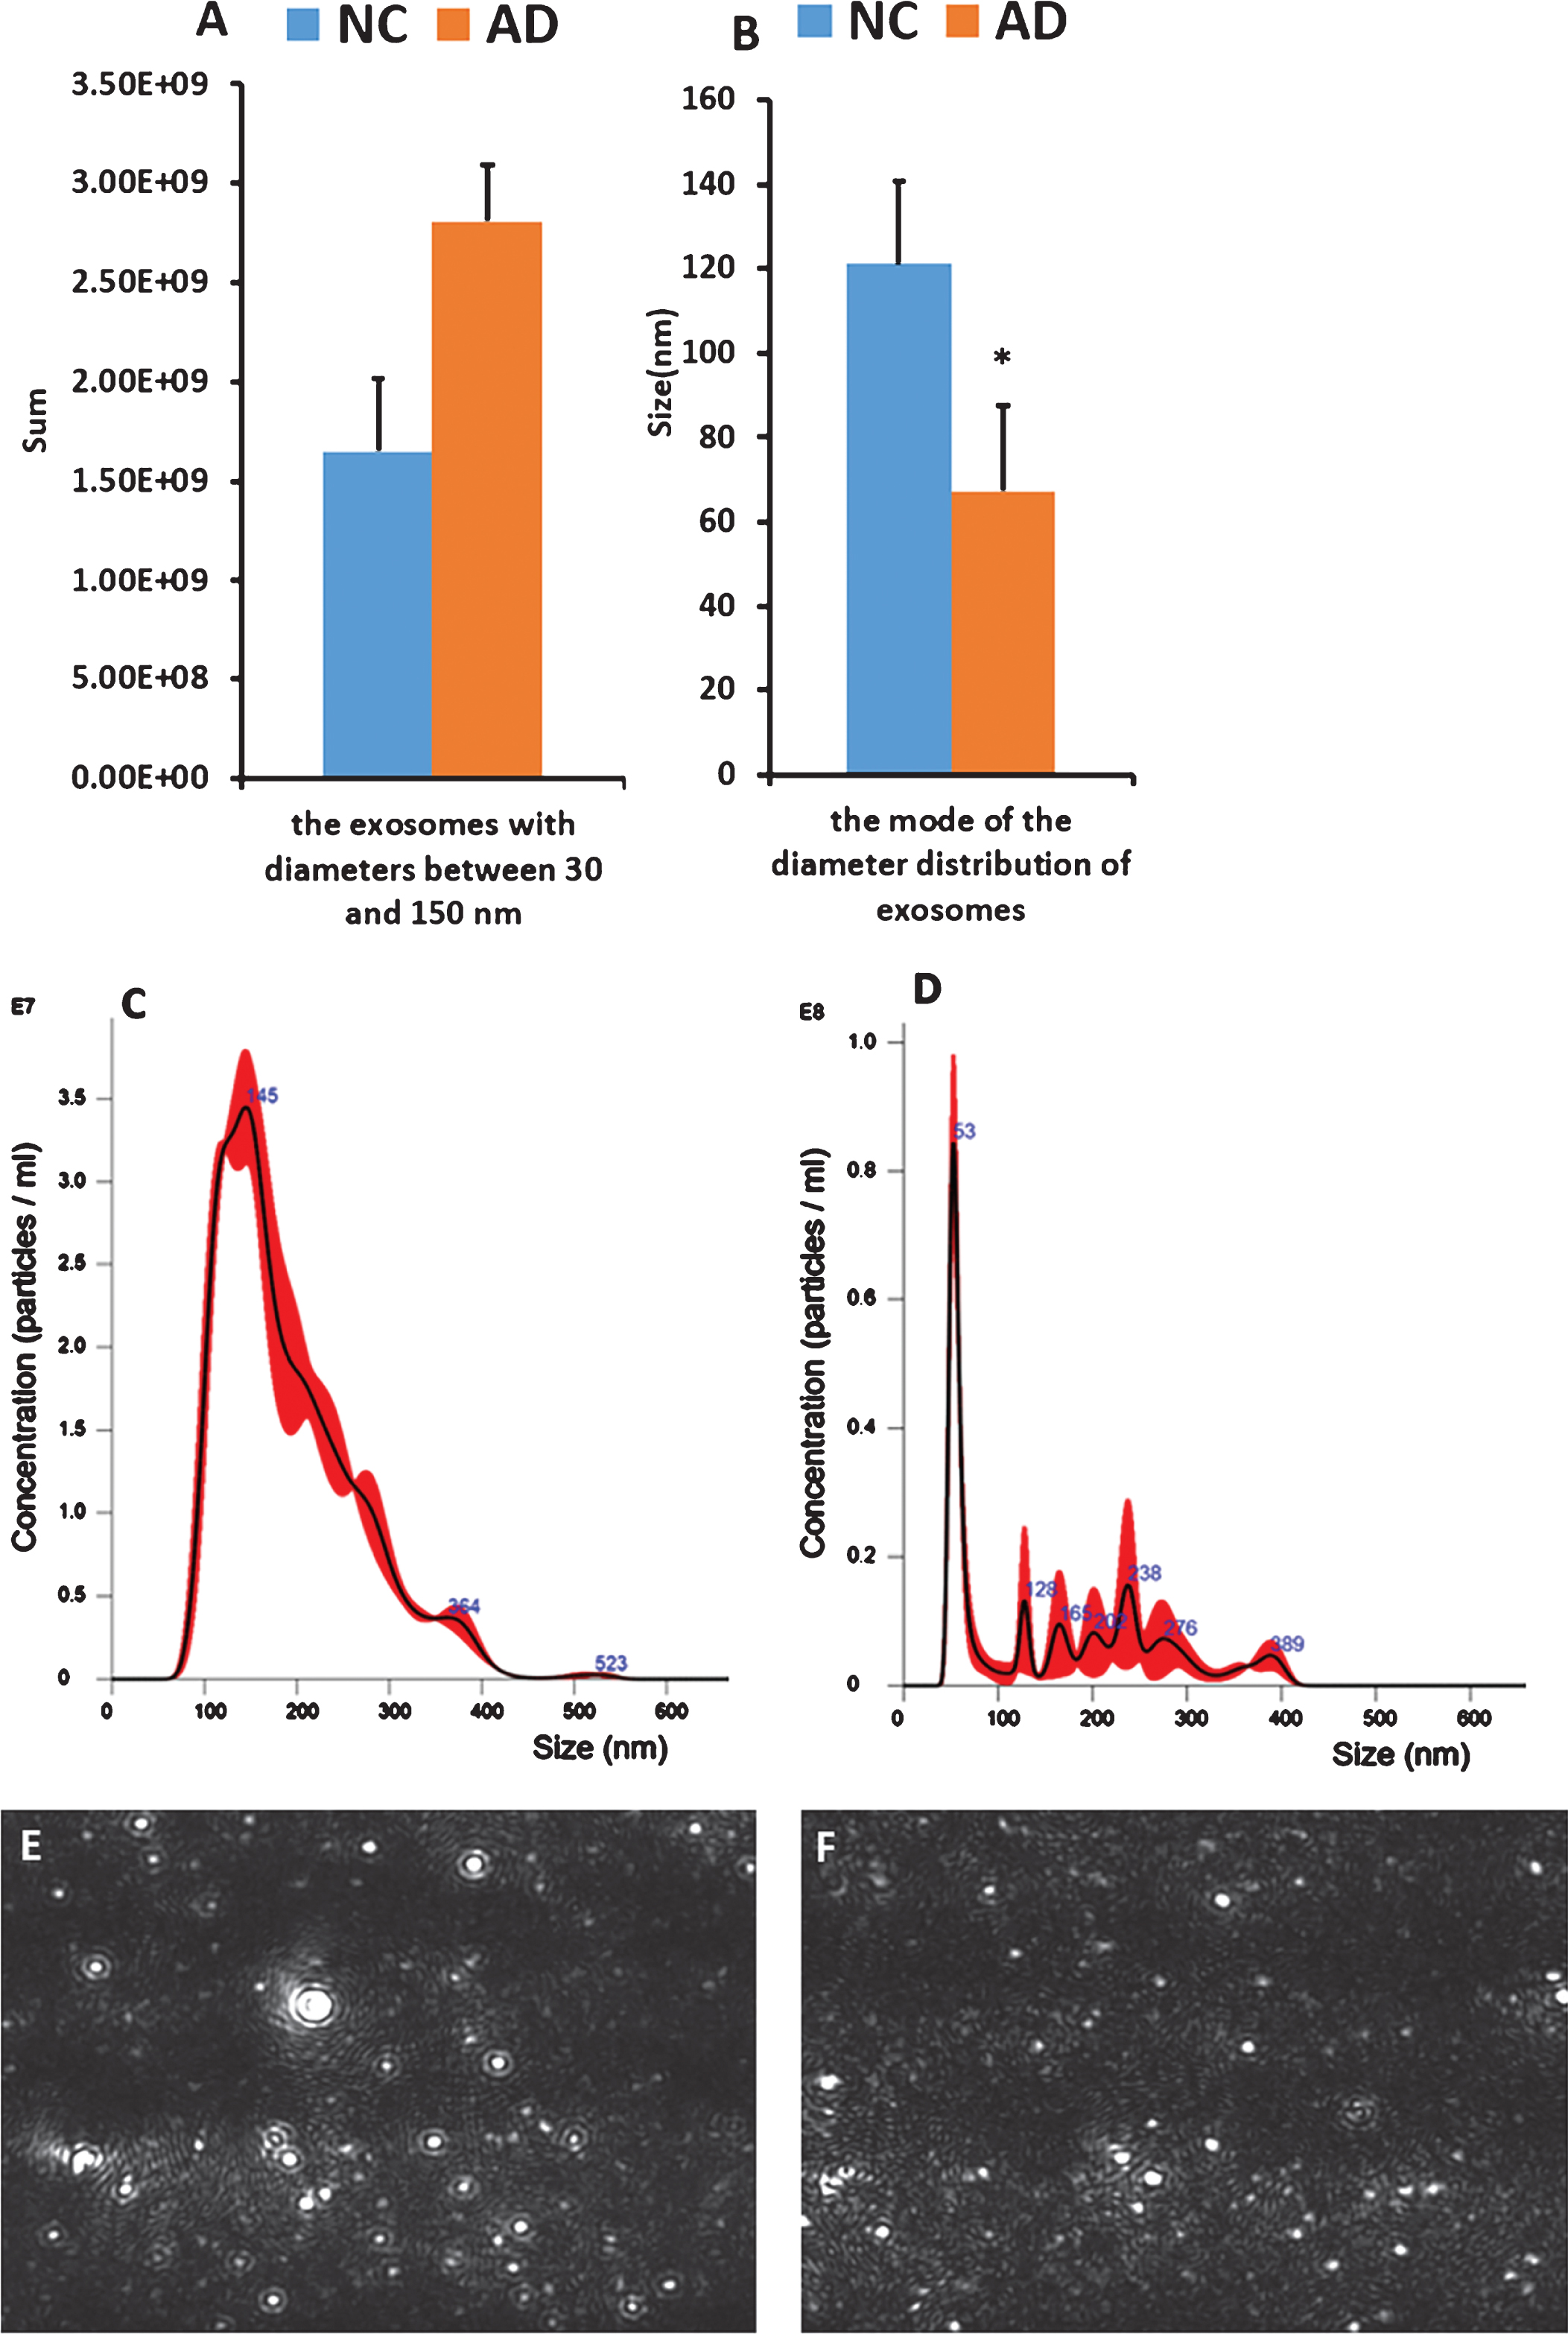
A,B) The number and size of plasma exosomes according to NTA. A) represents the number of exosomes with diameter in the range of 30–150 nm in healthy subjects and AD patients; B) represents the mode of the diameter distribution of plasma exosomes in healthy controls and AD patients; Error bars, representing one standard deviation of the sample mean, are a measure of the degree of dispersion of the mean sample distribution and the mean sample error, reflecting the variance between sample means. C,D) Diameter of the plasma exosomes plotted on the abscissa and concentration plotted on the ordinate. C) Peak map representing plasma exosomes from healthy subjects. D) Peak map representing plasma exosomes from AD patients. E,F) Video mapping of plasma exosomes using NTA. E) Video image of plasma exosomes from healthy subjects. F) Video image of plasma exosomes from AD patients.
After creation of a peak graph, in which the diameter of plasma EVs was plotted on the abscissa and their concentration was plotted on the ordinate, it was observed that compared to the graph for healthy controls, the graph of EVs in AD patients generally had an earlier and taller peak (Fig. 4).
As can be seen from the video image of NTA, EVs derived from healthy subjects had faster activity than those from AD patients, and the exosomes were fuller. These differences may also be useful for the diagnosis of AD (Fig. 4).
DISCUSSION
Neurodegenerative diseases are characterized by a prolonged prodromal period, with neuropathological and neurodegenerative changes preceded by significant neurological symptoms [23]. Andreasen et al. first reported that CSF-Aβ1–42 was lower in AD patients than in matched healthy subjects [24]. Later, it was discovered that triggering of Aβ protein in the disease process begins considerably earlier (15 years or more) than the onset of dementia [25]. Tau is a microtubule-associated protein and tauopathies, which are related to abnormalities of chromosome 17, encompass more than 20 different diseases (FTDP-17) [26]. As with Aβ protein, the progression time from the preclinical stage to clinically apparent AD with abnormal elevation of threshold CSF P-tau protein was estimated to be 17 years [11, 27]. It has been shown that subjects with mild cognitive impairment (MCI) who later developed AD were identified by the combination of decreased CSF concentrations of Aβ1–42 and increased levels of tau. These findings suggest that tau and Aβ1–42 in CSF may be valuable for detection of AD in preclinical stages [28].
This study shows that levels of the pathological proteins P-S396-Tau and Aβ1–42 in plasma exosomes of AD patients were significantly higher than those in matched healthy subjects, and the results showed statistical significance. TEM and NTA were applied in order to measure the morphology and size distribution of exosomes. Our data indicate that plasma exosomes in both AD patients and matched healthy controls are ring-shaped. Yet, compared to plasma exosomes in AD patients, the exosome distribution in healthy people is relatively scattered and uniform, and exosome diameter is relatively larger. Because our sample size was relatively small, the sample may not be representative and we would need more subjects for verification. Previous research has shown that blood exosome levels of Aβ1–42 progressively increase from preclinically high levels to significantly higher levels at the time of AD diagnosis, implying the value of exosomal Aβ1–42 as a biomarker [11] with good specificity. It was mentioned that exosomes played a role in the pathogenesis of AD in previous research. It was also mentioned that Aβ1–42 was more hydrophobic than the short Aβ in the cerebrospinal fluid and more likely to accumulate in the brain, but few researchers have examined Aβ1–42 in plasma exosomes for comparison, so we were innovative at this point. In addition, all of our experimental specimens were from Henan, representing the levels of Aβ1–42 and P-S396-tau in plasma exosomes in Henan could provide a little reference for a wider range of research.
In addition, previous studies have found that in the early and middle stages of AD, Aβ40 levels are reduced [29] and a decrease in the Aβ42/Aβ40 ratio accompanied by an increase in Aβ40 levels is associated with conversion to AD [30]. Jensen et al. also found that Aβ42 levels in their depression reference group were significantly higher than levels in the healthy control group, which suggests that Aβ42 is not only increased in AD but is also increased in other central nervous system conditions [29]. Another study found that injection of Aβ42 fibrils into the brains of transgenic mice resulted in a five-fold increase in the number of neurofibrillary tangles between neuron projections and the injection site in the amygdala, suggesting that Aβ42 fibrils can accelerate neurofibrillary tangle formation in vivo [31]. These changes are also notable for the diagnosis of AD.
In addition to proteins, various RNA species contained in exosomes may also be biomarkers of AD in the early stage [32]. Moreover, miRNA sequencing of plasma exosomes has revealed differential expression of a group of miRNAs between AD patients and healthy individuals [33, 34].
Although exosomes appear to contribute to the progression of neurodegenerative diseases in some studies, there is increasing evidence that they also have a protective role. Yuyama et al. showed that the upregulation of exosome secretion from neuronal cells significantly reduces the extracellular level of Aβ [35]. Furthermore, An and his team have indicated that N2a-derived exosomes have the ability to neutralize Aβ-induced disruptions in synaptic plasticity [36].
However, the study of exosomes is still in its infancy. We strongly believe that exosomes will eventually be used to benefit patients and may be part of the key to curing neurodegenerative diseases such as AD.
