
Abstract
Background:
Aberrant amyloid-β (Aβ) deposition in the brain occurs two decades prior to the manifestation of Alzheimer’s disease (AD) clinical symptoms and therefore brain Aβ load measured using PET serves as a gold standard biomarker for the early diagnosis of AD. However, the uneconomical nature of PET makes blood markers, that reflect brain Aβ deposition, attractive candidates for investigation as surrogate markers.
Objective:
Investigation of plasma Aβ as a surrogate marker for brain Aβ deposition in cognitively normal elderly individuals.
Methods:
Plasma Aβ40 and Aβ42 concentrations were measured using the ultrasensitive Single Molecule Array (Simoa) assay in 95 cognitively normal elderly individuals, who have all undergone PET to assess brain Aβ deposition. Based on the standard uptake value ratios (SUVR) obtained from PET imaging, using the tracer 18F-Florbetaben, plasma Aβ was compared between 32 participants assessed to have low brain Aβ load (Aβ–, SUVR <1.35) and 63 assessed to have high brain Aβ load (Aβ+, SUVR ≥1.35).
Results:
Plasma Aβ42/Aβ40 ratios were lower in the Aβ+ group compared to the Aβ–group. Plasma Aβ40 and Aβ42 levels were not significantly different between Aβ–and Aβ+ groups, although a trend of higher plasma Aβ40 was observed in the Aβ+ group. Additionally, plasma Aβ42/Aβ40 ratios along with the known AD risk factors, age and APOE ɛ4 status, resulted in Aβ+ participants being distinguished from Aβ–participants based on an area under the receiver operating characteristic curve shown to be 78%.
Conclusion:
Plasma Aβ ratios in this study are a potential biomarker for brain Aβ deposition and therefore, for preclinical AD. However, this method to measure plasma Aβ needs further development to increase the accuracy of this promising AD blood biomarker.
Keywords
INTRODUCTION
Alzheimer’s disease (AD) is the most common form of dementia. Presently, more than 50 million people worldwide are living with dementia and this statistic is expected to rise to over 150 million by 2050, if there is no medical breakthrough for prevention or effective treatment [1].
Given that the onset of aberrant amyloid-β (Aβ) deposition in the brain occurs about two decades prior to the manifestation of clinical symptoms [2, 3], brain Aβ load measured using positron emission tomography (PET) serves as a gold standard biomarker for the early diagnosis of AD well before the onset of symptoms. In addition, reduced cerebrospinal fluid (CSF) Aβ42 levels and low Aβ42/40 ratios are characteristic of AD [4], showing high concordance (>90%) with amyloid PET measures of brain amyloidosis [5]. Preclinical AD diagnosis employing these gold standard markers are facilitating the recruitment of participants for clinical trials investigating the efficacy of new drugs which target the preclinical phase of AD, prior to extensive neuronal damage. Additionally, preclinical AD diagnosis may also encourage the implementation of protective lifestyle changes [6]. However, the uneconomical nature of PET, and the need of lumbar puncture for CSF analyses, makes their usage unfeasible for population wide screening and therefore, blood markers that reflect brain Aβ deposition are attractive candidates for investigation as surrogate markers.
While several studies have investigated plasma Aβ in AD [7], two relatively recent studies reported that plasma Aβ ratios are significantly different between individuals with low brain Aβ load (Aβ –) versus those with high brain Aβ load (Aβ+) [8, 9]. The study by Ovod and colleagues reported that plasma Aβ42/Aβ40 ratios were lower in Aβ+ versus Aβ–participants and distinguished between Aβ+ versus Aβ–participants with approximately 88% accuracy [8]. Further, Nakamura and colleagues reported that plasma Aβ40/Aβ42 ratios were higher in Aβ+ versus Aβ–participants. Additionally, the composite scores they obtained from inclusion of the amyloid-β precursor protein fragment, APP669-711, to Aβ1-42 ratio and the Aβ1-40 to Aβ1-42 ratio predicted Aβ+ versus Aβ–participants with even greater accuracy (greater than 90%) [9]. However, both studies employed immunoprecipitation using monoclonal anti-Aβ antibodies (HJ5.1, anti-Aβ13 - 28 [8] and 6E10, anti-Aβ1 - 16 [9]) prior to a liquid chromatography coupled with mass-spectrometry approach which may be difficult to standardize and implement in many clinical laboratory settings, particularly outside the US and Europe due to the required investment in infrastructure acquisition and maintenance, specifically in developing and developed nations with large rural sectors. Additionally, both studies included participants with mild cognitive impairment and dementia in their Aβ–and Aβ+ groups.
Fandos and colleagues measured plasma Aβ in cognitively normal Aβ+ individuals compared to Aβ–individuals, utilizing an enzyme linked immunosorbent assay (employing monoclonal antibody 1F3 specific to the Aβ N-terminal and polyclonal antibodies pAB002 and pAB031 specific to the C-terminal end of Aβ40 or Aβ42, respectively) and observed lower plasma Aβ42/Aβ40 ratios in the Aβ+ group [10]. Further, Verberk and colleagues utilized the Single Molecule Array (Simoa) technology and observed lower plasma Aβ42/Aβ40 ratios in cognitively normal individuals with subjective cognitive decline (SCD; referring to self-reported decline in cognitive performance [11]) carrying aberrant brain Aβ deposition (assessed by CSF Aβ42 levels ≤813 pg/ml) compared to cognitively normal individuals with SCD carrying normal brain Aβ deposition [12]. Janelidze et al. also reported that plasma Aβ42/Aβ40 ratios measured by Simoa inversely correlated with brain Aβ load (assessed via PET) in cognitively normal individuals with SCD [13] (Supplementary Table 1).
The current study aimed to validate the above studies utilizing the ultra-sensitive Simoa technique to investigate whether plasma Aβ42/Aβ40 ratios are significantly different between Aβ–cognitively normal participants compared to Aβ+ cognitively normal participants determined by PET neocortical amyloid-Aβ measurements in the Kerr Anglican Retirement Village Initiative in Ageing Health (KARVIAH) cohort. Additionally, the current study also evaluated the potential of plasma Aβ42/Aβ40 ratios in differentiating Aβ–and Aβ+ participants.
METHODS
Participants
The two hundred and six individuals who volunteered for the KARVIAH cohort were screened for the inclusion and exclusion criteria to be eligible. The inclusion criteria comprised an age range of 65–90 years, good general health, no known significant cerebral vascular disease, fluent in English, adequate/corrected vision and hearing to enable testing, and no objective cognitive impairment as screened by a Montreal Cognitive Assessment (MoCA) score ≥26. MoCA scores lying between 18–25 were assessed on a case by case basis by the study neuropsychologist following stratification of scores according to age and education [14]. The exclusion criteria comprised, the diagnosis of dementia based on the revised criteria from the National Institute on Aging-Alzheimer’s Association [15], presence of acute functional psychiatric disorder (including lifetime history of schizophrenia or bipolar disorder), history of stroke, severe or extremely severe depression (based on the Depression Anxiety Stress Scales [16]) and uncontrolled hypertension (systolic BP >170 mm Hg or diastolic BP >100 mm Hg).
From the 134 volunteers who met the inclusion and exclusion criteria, 105 participants underwent neuroimaging, neuropsychometric evaluation, and blood collection since the remaining participants declined undergoing neuroimaging or withdrew from the study. Within these 105 participants, 100 participants were considered to have normal global cognition based on their Mini-Mental State Examination score [17] (MMSE ≥26). Both plasma Aβ40 and Aβ42 concentrations were measured in 95 of these 100 participants. Additionally, participants with a Memory Assessment Clinic - Questionnaire (MAC-Q) score of 25–35 were considered as subjective memory complainers (SMC, n = 72; a specific form of SCD defined by self-reported memory complaints) while those with a MAC-Q score ≤24 were considered as non-complainers (n = 23) (See Fig. 1 for flowchart). All volunteers provided written informed consent prior to participation, and the Bellberry Human Research Ethics Committee, Australia, and the Macquarie University Human Research Ethics Committee provided approval for the study.
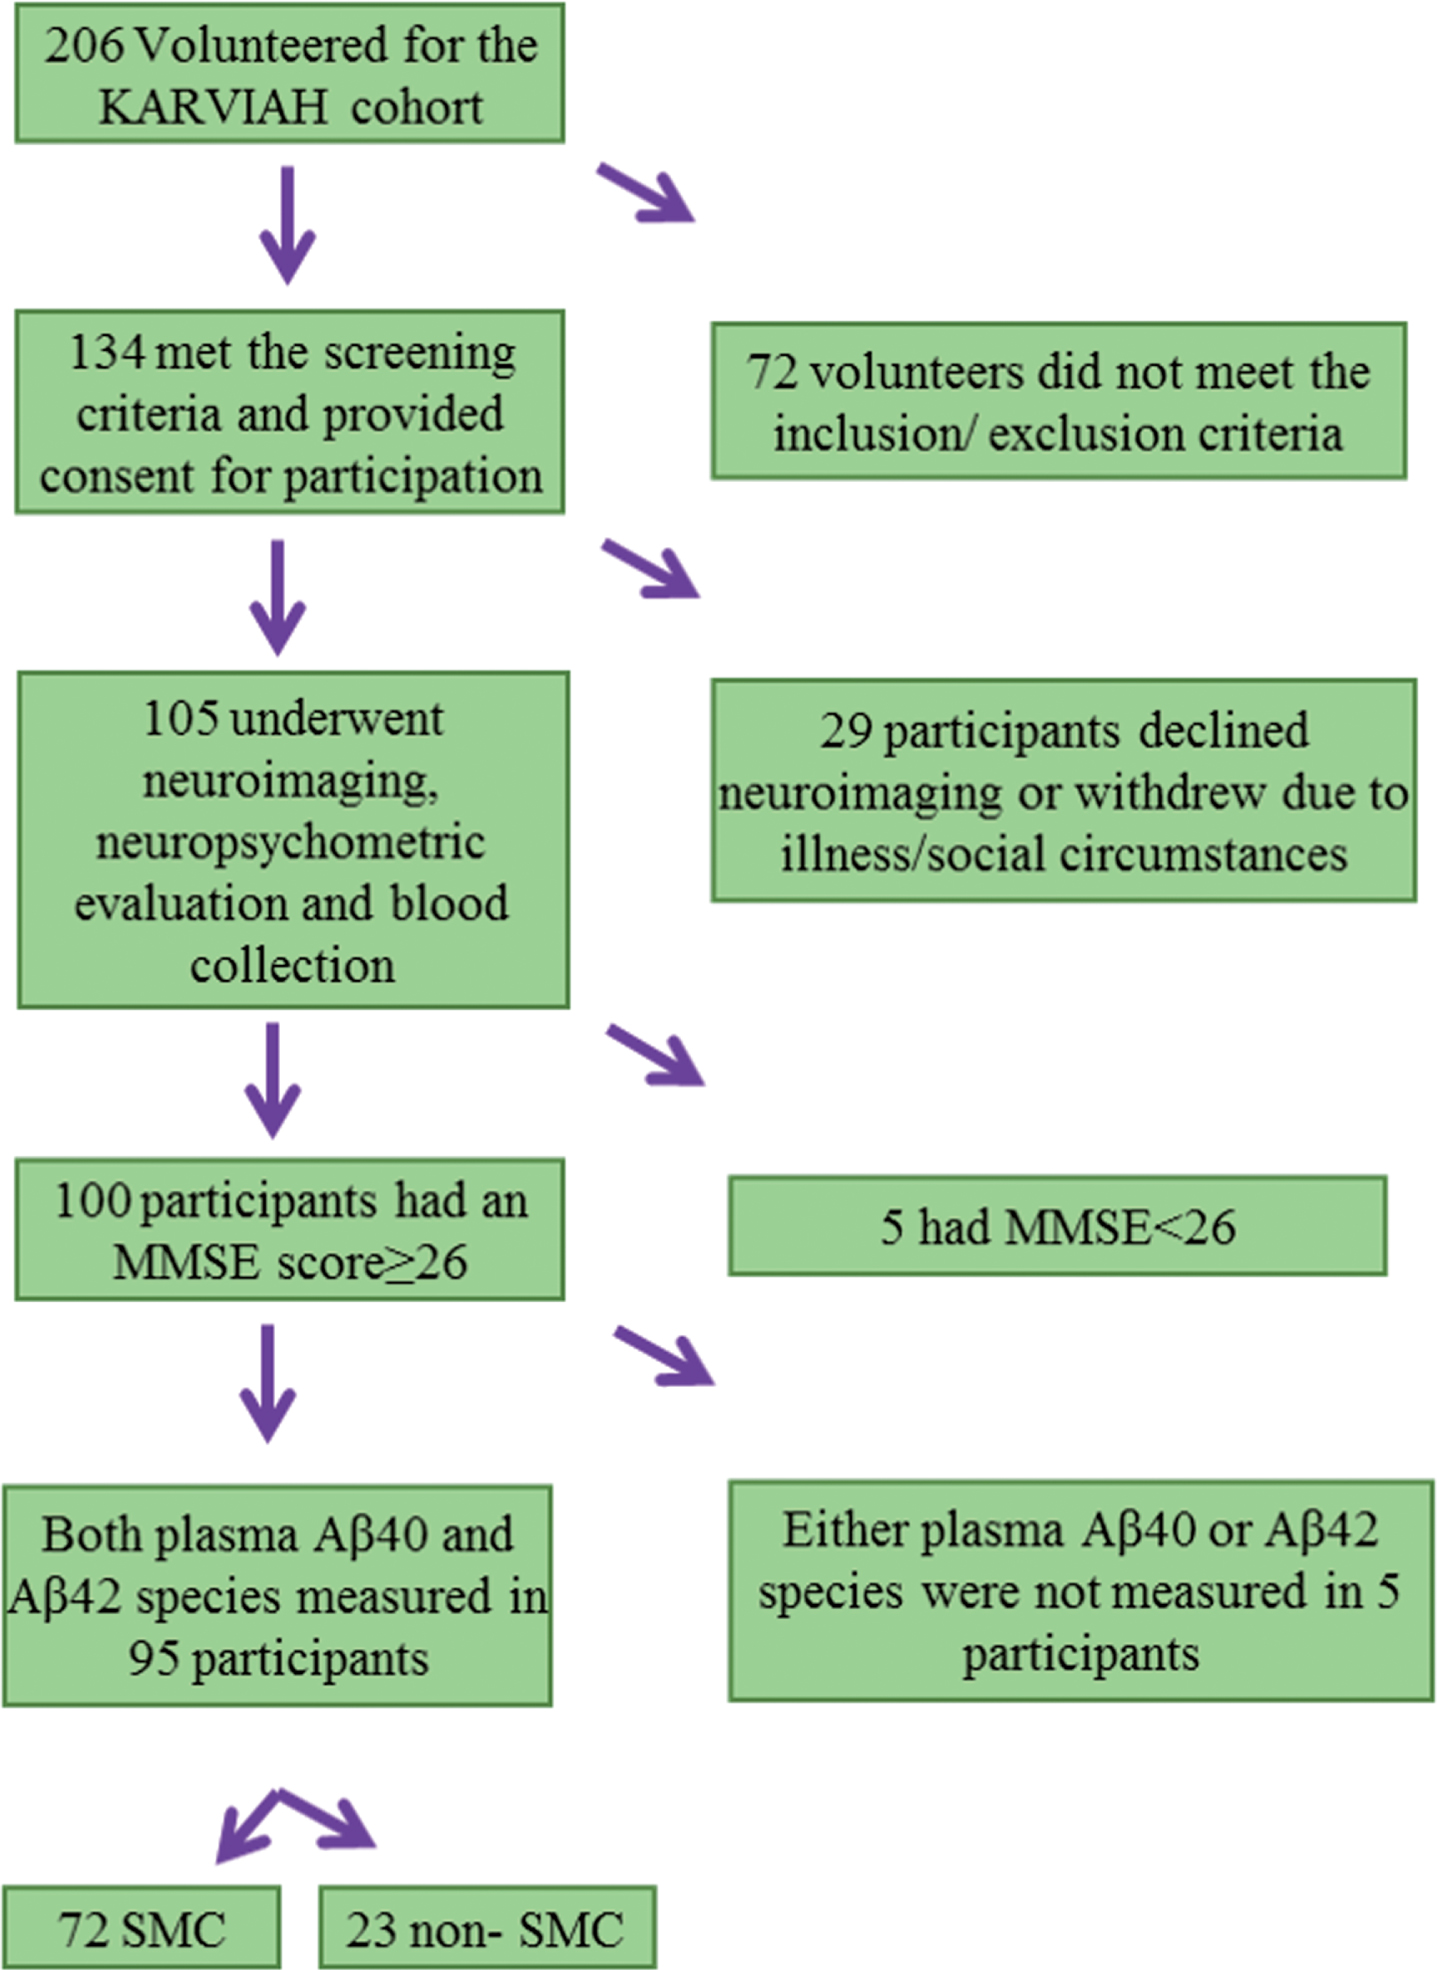
Flow chart representing the Kerr Anglican Retirement Village Initiative in Ageing Health (KARVIAH) cohort participants included within the current study. MMSE, Mini-Mental State Examination score; SMC, subjective memory complainers.
Evaluation of neocortical amyloid-β load via PET
All study participants were imaged within three months of blood collection wherein participants underwent PET using ligand 18F-Florbetaben (FBB) at Macquarie Medical Imaging in Sydney. Participants were administered an intravenous bolus of FBB slowly over 30 s, while in a rested position. Images were acquired over a 20-min scan, in 5-min acquisitions, beginning 50-min post injection. Brain (neocortical) Aβ load was calculated as the mean standard uptake value ratio (SUVR) of the frontal, superior parietal, lateral temporal, lateral occipital, and anterior and posterior cingulate regions using the image processing software, CapAIBL [18, 19] to classify participants as Aβ–or Aβ+ using an SUVR cut-off = 1.35 [20] within the current study.
Blood collection, measurement of plasma Aβ, and APOE genotyping
All study participants fasted for a minimum of 10 h overnight prior to blood withdraw employing standard serological methods and processing [20]. Blood samples were collected in K3-EDTA coated tubes and the time between blood collection and obtaining plasma fractions varied between 60 to 90 min. Plasma Aβ concentrations were measured employing the ultra-sensitive Single Molecule Array (Simoa, Quanterix) platform according to the manufacturer’s instructions. Briefly, plasma samples were diluted eight times for Aβ40 and four times for Aβ42. Diluted plasma samples were then combined with paramagnetic beads coated with a capture antibody specific to the N-terminus of both Aβ40 and Aβ42 and two different C-terminus biotinylated detection antibodies specific to Aβ40 and Aβ42. After washing, the capture beads were mixed with a streptavidin β-galactosidase conjugate. After a second wash, the capture beads were resuspended in a substrate solution (resorufin β-D-galactopyranoside), following which they were transferred to the Simoa disc for detection and measurement [13]. For Aβ40, the quality control (QC, non-spiked pooled plasma) sample had a concentration of 219 pg/mL with repeatability 6.9% and intermediate precision 7.9%. For Aβ42, the QC sample had a concentration of 12.9 pg/mL with repeatability 2.4% and intermediate precision 5.6%. Apolipoprotein E (APOE) genotype was determined from purified genomic DNA extracted from 0.5 ml whole blood as previously described [20].
Statistical analyses
Descriptive statistics including means and standard deviations were calculated for Aβ–and Aβ+ groups, with comparisons employing Student’s t-tests or Chi-square tests as appropriate. Linear models were employed to compare continuous variables between Aβ–and Aβ+ groups corrected for covariates age, gender, and APOE ɛ4 carrier status. Plasma Aβ concentrations and their ratios were log transformed to better approximate normality and variance homogeneity as required. Logistic regression with Aβ–/+ as response was used to evaluate predictive models and receiver operating characteristic (ROC) curves constructed from the logistic scores. All analyses were carried out using IBM® SPSS® Version 23 and receiver operating characteristic curves were generated using the package Deducer on R (version 3.2.5).
RESULTS
Cohort characteristics
Demographic characteristics of study participants are presented in Table 1. No significant differences were observed in gender, age, body mass index, MMSE scores, and the number of SMC between Aβ–and Aβ+ cohort participants. However, the APOE ɛ4 carriage frequency was significantly higher in the Aβ+ group compared to Aβ–group as expected [21] (Table 1).
Demographic characteristics of cohort participants
Baseline characteristics including gender, age, body mass index (BMI), APOE ɛ4 status, Mini-Mental State Examination (MMSE) scores, subjective memory complainer status, and brain Aβ load represented by the standard uptake value ratio (SUVR) of ligand 18F-Florbetaben (FBB) in the neocortical region normalized with that in the cerebellum, have been compared between Aβ–(SUVR <1.35) and Aβ+ (SUVR ≥1.35) study participants. Chi-square tests or linear models were employed as appropriate.
Comparison of plasma Aβ40, Aβ42, and Aβ42/Aβ40 ratios in Aβ–versus Aβ+ participants
Plasma Aβ40 and Aβ42 concentrations and plasma Aβ42/Aβ40 ratios, measured in the study participants have been presented in Table 2. While no significant differences were observed in plasma Aβ40 and Aβ42 concentrations between the Aβ–and Aβ+ groups, significant differences in plasma Aβ42/Aβ40 ratios were observed between the two groups, wherein Aβ42/Aβ40 ratios were lower in the Aβ+ group compared to the Aβ–group with and without correcting for covariates age, gender and APOE ɛ4 status (Table 2, Fig. 2).
Comparison of plasma Aβ40, Aβ42, and Aβ42/40 ratios between Aβ–and Aβ+ participants
Plasma Aβ concentrations and their ratios were compared between cognitively normal individuals with low brain Aβ load (Aβ–) and high brain Aβ load (Aβ+) using linear models. All participants were further categorized into subjective memory complainers (SMC, n = 72) and non-SMC (n = 23). †represents p-values obtained from log transformed plasma Aβ concentrations or ratios to better approximate normality when required. pa represents p-values adjusted for age, gender, and APOE ɛ4 status. Data are presented in mean±SD.
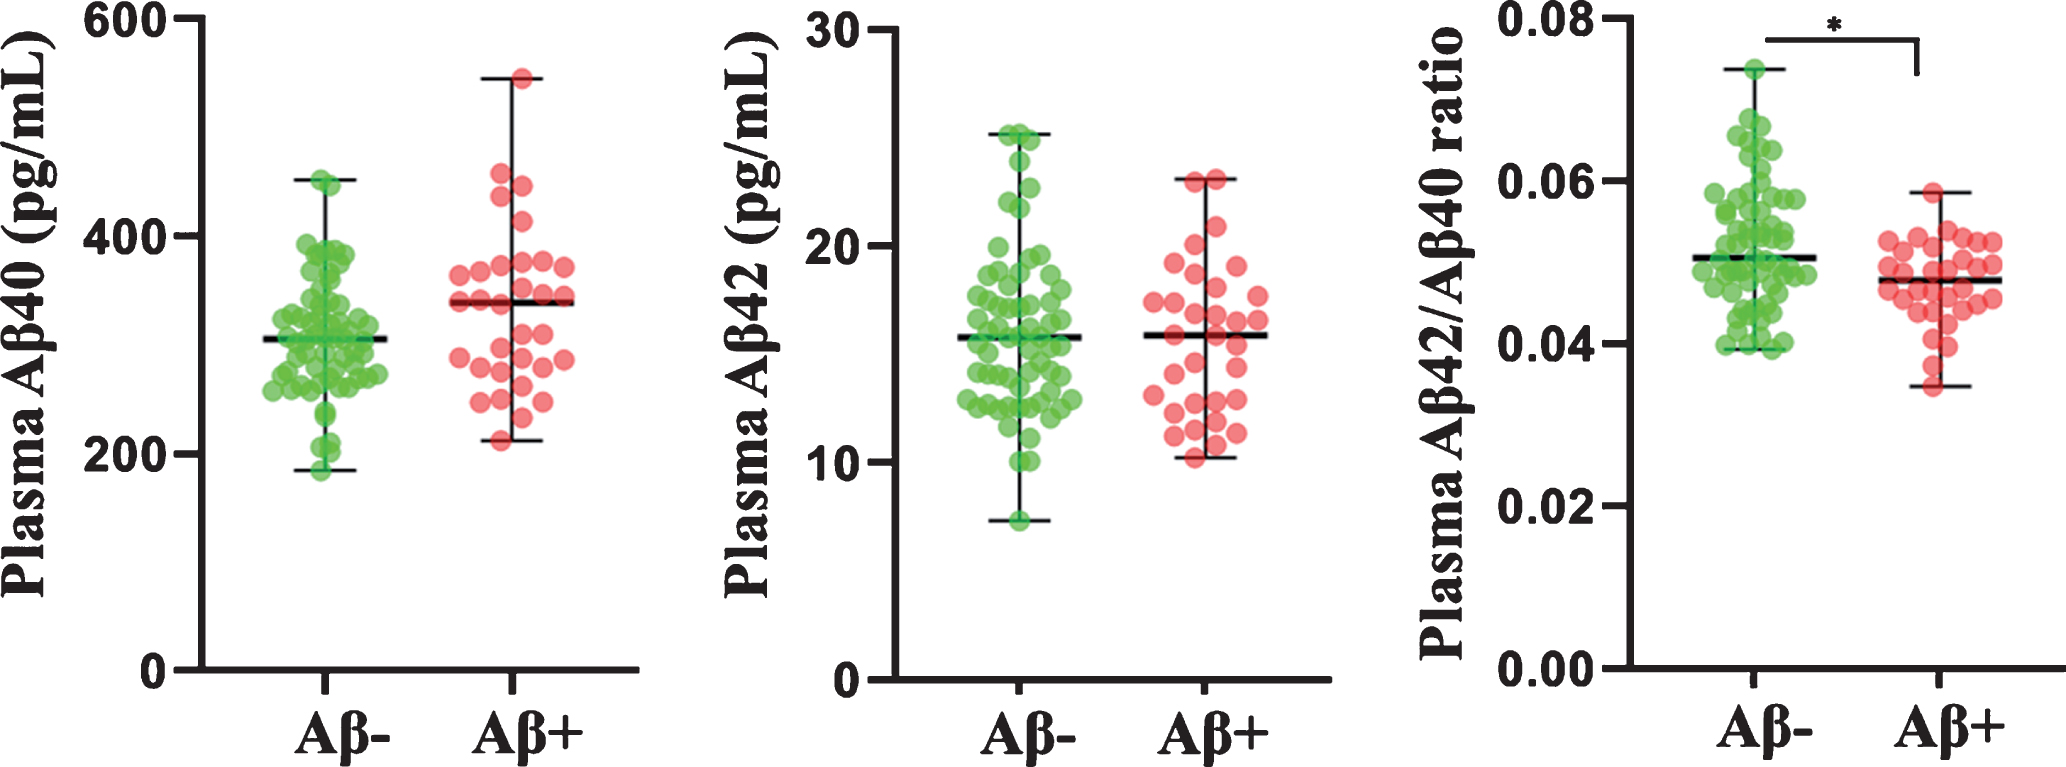
Comparison of plasma Aβ40, Aβ42, and Aβ42/Aβ40 ratios between Aβ–versus Aβ+ participants. Plasma Aβ concentrations (in pg/mL) and their ratios were compared between participants with neocortical Aβ load (assessed by the standard uptake value ratio observed via PET using ligand 18F-florbetaben)<1.35 (Aβ–) and ≥1.35 (Aβ+) using linear models. Plasma Aβ42/Aβ40 ratios were significantly lower in Aβ+ (N = 32) participants compared to Aβ–(N = 63) participants. The line segment within each jitter plot represents the median of the data and error bars in the graphs represent the data range for the Aβ–and Aβ+ groups. p-values were obtained from log transformed plasma Aβ concentrations and ratios to better approximate normality and variance homogeneity when required. * p < 0.005.
On stratifying study participants into SMC (n = 72) and non-SMC (n = 23), plasma Aβ42/Aβ40 ratios continued to remain significantly lower in the Aβ+ SMC compared to Aβ–SMC with and without correcting for covariates age, gender, and APOE ɛ4 status (Table 2). However, no significant difference was observed in plasma Aβ42/Aβ40 ratios between Aβ+ and Aβ–non-SMC.
Evaluation of plasma Aβ42/Aβ40 ratio as predictor of brain Aβ status
Plasma Aβ42/Aβ40 ratios were evaluated as potential markers to predict Aβ+ status using logistic regression with Aβ+ or Aβ–as response. A ‘base’ model incorporating the major risk factors for AD, namely age and APOE ɛ4 allele status, was generated and compared to the ‘base+ Aβ42/Aβ40 ratio’ model wherein plasma Aβ42/Aβ40 ratios were added to the base model (Fig. 3). The area under the ROC curve (AUC) of the ‘base+ Aβ42/Aβ40 ratio’ model (AUC = 77.6%, specificity = 67% at sensitivity = 78%, 95% CI = 68–88%) outperformed the ‘base’ model (AUC = 75.3%, specificity = 56% at sensitivity = 78%, 95% CI = 65–86%) in distinguishing Aβ+ from Aβ–participants.
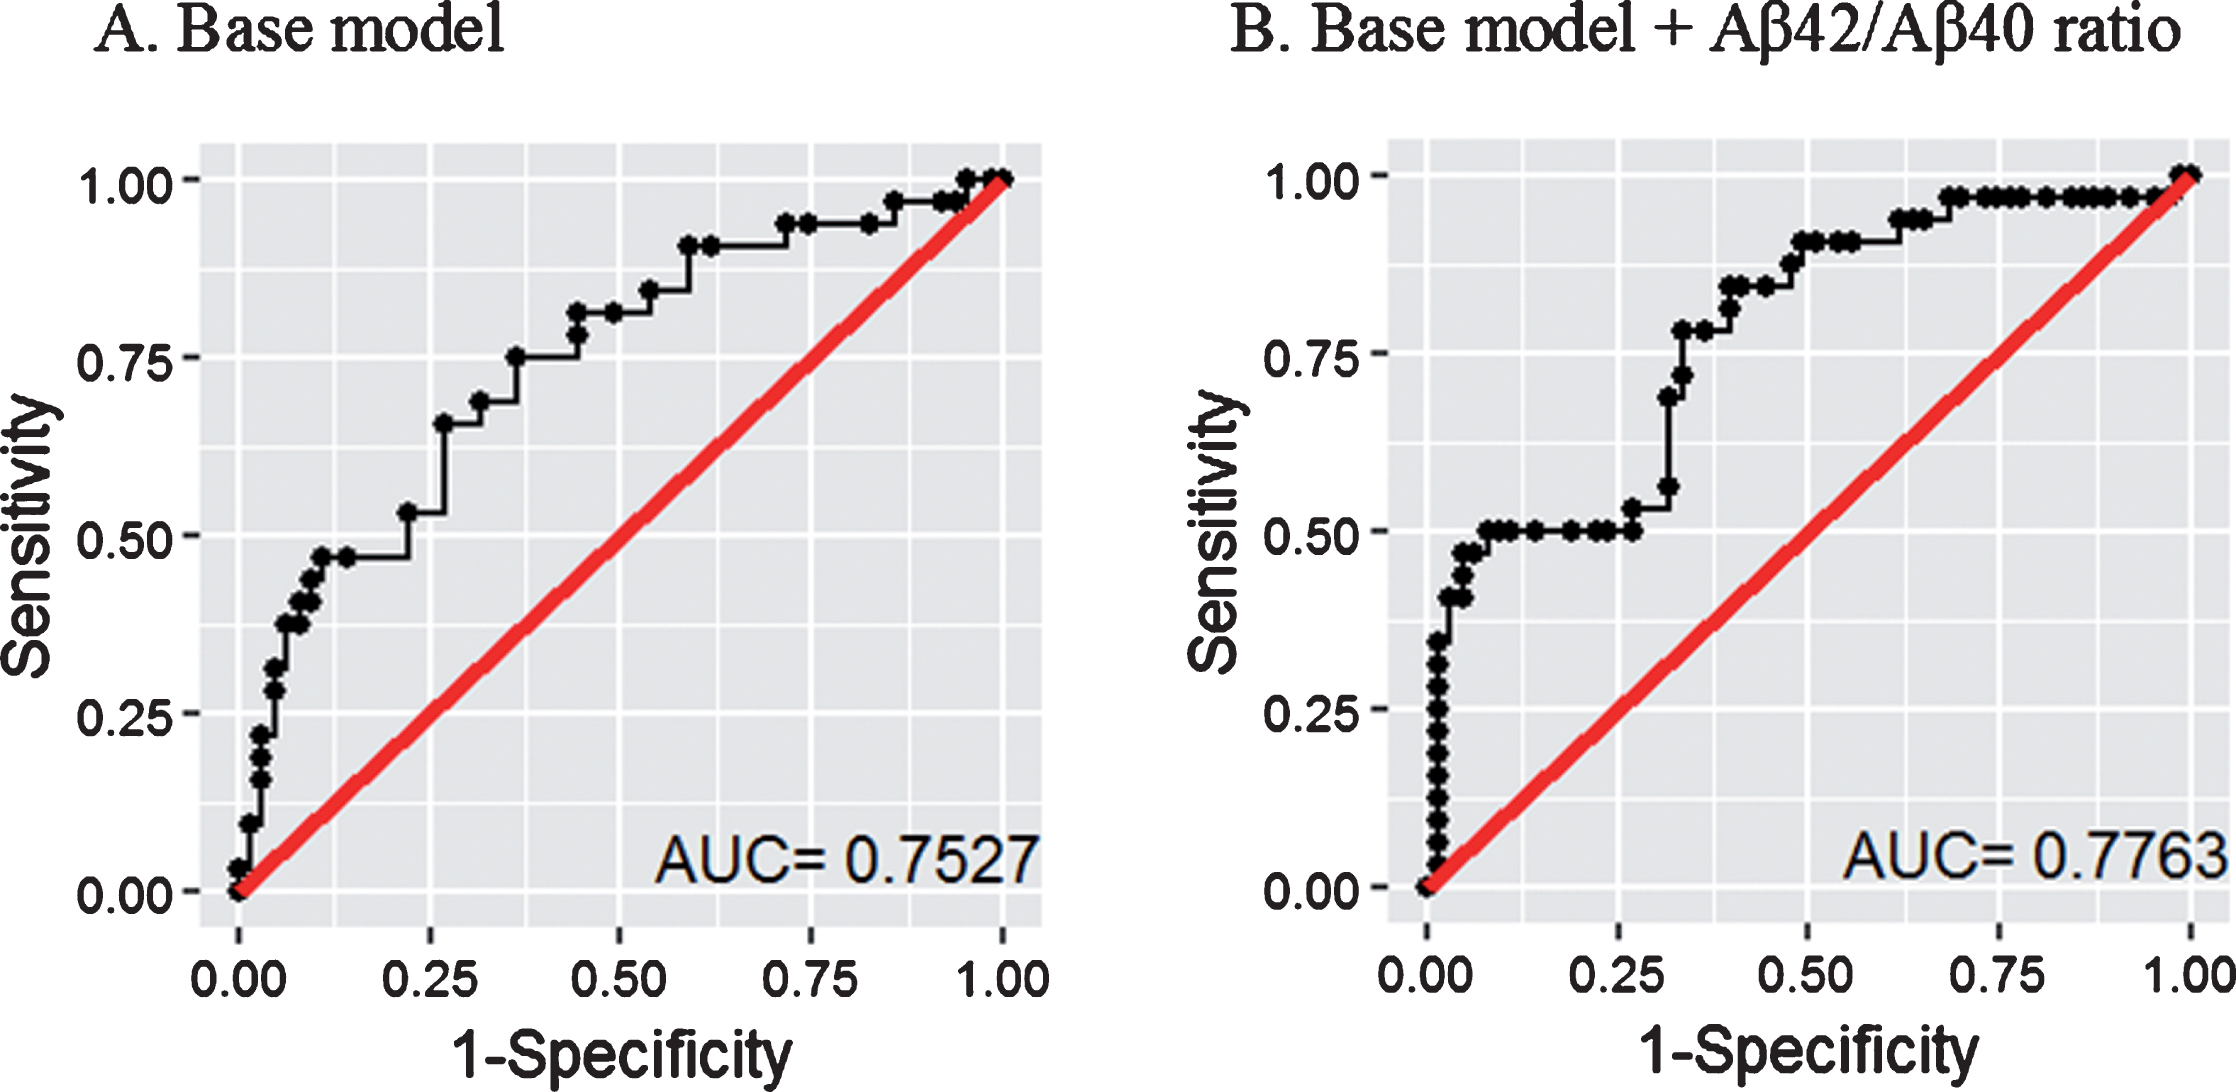
Receiver operating characteristic curves for the prediction of Aβ+ versus Aβ–participants. The ‘base’ model comprising major risk factors age and APOE ɛ4 allele status (A) was outperformed by the ‘base + plasma Aβ42/Aβ40 ratio’ model (B). Logistic regression models were employed to perform the analyses. AUC: area under the curve. 95% CI for A = 65–86%, 95% CI for B = 68–88%.
DISCUSSION
The current study found that while plasma Aβ40 and Aβ42 concentrations were not significantly different between Aβ–and Aβ+ participants, the ratio of Aβ42/Aβ40 was significantly lower in Aβ+ participants compared to Aβ–participants. Lower Aβ42/Aβ40 ratios (or Aβ42 concentrations relative to Aβ40 concentrations) in the Aβ+ group compared to the Aβ–group is consistent with Aβ aggregation in the brain. On stratifying cohort participants into SMC and non-SMC, the ratio of Aβ42/Aβ40 was significantly lower in Aβ+ SMC compared to Aβ–SMC. While the mean of the ratio of Aβ42/Aβ40 was lower in Aβ+ non-SMC compared to Aβ–non-SMC, it did not reach statistical significance, which could be due to the small sample size following stratification based on self-reported memory complaints. Further, plasma Aβ42/Aβ40 ratios along with AD risk factors age and APOE ɛ4 status in all participants predicted Aβ+ individuals with approximately 78% accuracy. Interestingly, Nakamura et al. employed Aβ40/Aβ42 ratios to predict individuals with aberrant brain Aβ deposition while Ovod et al. employed Aβ42/Aβ40 ratios. Within the current study we observed similar AUCs for both ratios (Supplementary Figures 1 and 2) [8, 9].
Two relatively recent studies also investigated plasma Aβ as a surrogate marker for abnormal brain Aβ deposition in cognitively normal individuals [10, 12]. Fandos and colleagues measured plasma Aβ levels using enzyme-linked immunosorbent assays (ELISA) (Araclon Biotech Ltd., Zaragoza, Spain) in individuals with normal and abnormal brain Aβ deposition classified by PET and reported that plasma Aβ42/Aβ40 ratios were lower in individuals with abnormal brain Aβ deposition [10], which is in line with observations from the current study. Further, employing the ultra-sensitive Simoa assay (Quanterix) to measure plasma Aβ, Verberk and colleagues also observed significantly lower plasma Aβ42/Aβ40 ratios in individuals with abnormal brain Aβ deposition defined by CSF Aβ42 levels (≤813 pg/ml) [12].
Along with AD risk factors, age and APOE ɛ4 carriage, Fandos et al. reported an AUC of 79% and Verberk et al. reported an AUC of 83% in distinguishing between individuals with abnormal brain Aβ deposition and those with normal brain Aβ deposition [10, 12]. However, only a trend of lower plasma Aβ42/Aβ40 ratios (p = 0.057) was observed in individuals with abnormal brain Aβ deposition (n = 23) determined using PET, in the subset of participants that underwent PET (n = 69) in the Verberk et al. study [12]. This observation could be attributed to the modest sample size of individuals who underwent PET and the multiple PET ligands employed within their study. Additionally, while the study by Fandos and colleagues accounted for employing multiple PET ligands using the “Before the Centiloid Kernel Transformation” (BeCKeT) scale, they employed a plasma Aβ measurement assay with a relatively lower sensitivity (lower limit of quantification, LOQ; Aβ40: 7.60 pg/ml, Aβ42: 3.60 pg/ml) [10, 22] compared to the Simoa assay used by Verberk and colleagues (LOQ; Aβ40: 0.16 pg/ml, Aβ42: 0.34 pg/ml) [12]. The current study utilized the ultrasensitive Simoa assay, to measure plasma Aβ concentrations, along with PET data (using a single ligand), to identify individuals with abnormal brain Aβ deposition, and validated findings from the above two studies wherein plasma Aβ42/Aβ40 ratios were lower in individuals at risk of AD (Aβ+).
Several studies have investigated plasma Aβ in AD; however, findings have been inconsistent. For example, a number of studies reported that lower plasma Aβ42 and higher plasma Aβ40 were associated with increased AD or dementia risk [23, 24], while other studies did not observe any association of plasma Aβ42 or Aβ40 with clinically diagnosed AD [25, 26]. Further, several other studies also reported that lower plasma Aβ42/Aβ40 ratios were significantly associated with increased AD risk [27–30], although other studies did not observe these associations [31, 32]. These inconsistencies could be attributed to a number of factors particularly poorly characterized cohorts, comparing clinically diagnosed AD and unimpaired elderly instead of brain amyloidosis positive and negative evaluated by PET scans, and non-sensitive plasma Aβ assays, variations between study designs (fasting bloods, time of blood collection, and processing time) and inadequate sample sizes. While the current study endeavored to address these issues by employing a highly characterized cohort that has undergone PET to measure brain Aβ deposition (with a single Aβ specific ligand), an ultra-sensitive plasma Aβ measurement assay and a sample collection and processing design similar to that used by Fandos and colleagues [10], it is also acknowledged that the study has its limitations which include a relatively modest sample size and a cross-sectional study design.
In conclusion, our current observations together with those of Fandos et al. and Verberk et al. are consistent with demonstrating that plasma Aβ ratios (Aβ42/Aβ40) are altered in cognitively normal individuals with aberrant brain Aβ deposition. Our approach utilizing the Simoa is promising as its ultrasensitive method together with its global accessibility makes it a highly attractive candidate for the development of a blood test for AD. However, since the accuracy of the plasma Aβ42/40 ratio attained using the current Simoa method will not be sufficient as a standalone marker to differentiate between Aβ–and Aβ+ individuals, further optimization such as using high affinity antibodies to measure plasma Aβ levels with more sensitivity is required. Additionally, several plasma Aβ+ biomarkers have been reported [20, 33–35] and further studies need to determine whether the combination of plasma Aβ ratios along with previously reported plasma Aβ+ biomarkers might potentially improve the diagnostic accuracy in differentiating between Aβ–and Aβ+ individuals. Furthermore, studies comparing Simoa and mass spectrometry assays are needed to examine which methodology performs best to identify brain amyloidosis. Additionally, a better understanding on the pre-analytical variables for sample collection and/or storage of blood samples might increase the clinical utility of blood-based biomarker assays.
Footnotes
ACKNOWLEDGMENTS
This study was funded by Anglicare, Sydney, the Australian Alzheimer Research Foundation (AARF), Perth and the KaRa Institute of Neurological Diseases (KaRa MINDS), Sydney. We thank the participants and their families for their participation and cooperation, and the Anglicare, KaRa MINDS and AARF research and support staff for their contributions to this study. We specially thank Ms. Candice ManYan, Ms. Bethany Ball, Ms. Emma Toovey, Ms. Kate Fredericks, and Ms. Catherine Brown for their contributions to this study. We also thank the staff of the Macquarie Medical Imaging centre in Macquarie University Hospital, Sydney, for their contributions. PC, TS, HRS and CBD are supported by Macquarie University. KG is a recipient of the Cooperative Research Centre for Mental Health top-up scholarship. HZ is a Wallenberg Academy Fellow supported by grants from the Swedish Research Council (#2018-02532), the European Research Council (#681712) and Swedish State Support for Clinical Research (#ALFGBG-720931). Florbetaben is a proprietary PET radiopharmaceutical owned by Piramal Imaging SA. For this study, Florbetaben was manufactured and supplied under GMP conditions by Cyclotek (Aust) Pty Ltd.