
Abstract
Background:
Visual search abilities are essential to everyday life activities and are known to be affected in Alzheimer’s disease (AD). However, little is known about visual search efficiency in mild cognitive impairment (MCI), a transitive state between normal aging and dementia. Eye movement studies and machine learning methods have been recently used to detect oculomotor impairments in individuals with dementia.
Objective:
The aim of the present study is to investigate the association between eye movement metrics and visual search impairment in MCI and AD.
Methods:
127 participants were tested: 43 healthy controls, 51 with MCI, and 33 with AD. They completed an eyetracking visual search task where they had to find a previously seen target stimulus among distractors.
Results:
Both patient groups made more fixations on the screen when searching for a target, with longer duration than controls. MCI and AD fixated the distractors more often and for a longer period of time than the target. Healthy controls were quicker and made less fixations when scanning the stimuli for the first time. Machine-learning methods were able to distinguish between controls and AD subjects and to identify MCI subjects with a similar oculomotor profile to AD with a good accuracy.
Conclusion:
Results showed that eye movement metrics are useful for identifying visual search impairments in MCI and AD, with possible implications in the early identification of individuals with high-risk of developing AD.
Keywords
INTRODUCTION
Alzheimer’s disease (AD) is a progressive neurodegenerative disease and the most prevalent type of dementia in older adults. It is characterized by early impairment of episodic and semantic memory, and recent findings have shown early deficits in other cognitive domains such as executive functions, attention, and visuospatial abilities. Visual processing skills have also been tentatively studied, but so far yielding inconsistent results. Visual deficits may be related to both ventral and dorsal pathways [1]. The distribution of neurofibrillary tangles and amyloid deposits in typical AD include the visual system, including the primary visual and association areas. In the dorsal visual pathway, there is a significant loss of long corticocortical projections from early visual areas to medial temporal areas (e.g., visual area V5). Visual search is altered in AD and patients often have an increased difficulty detecting objects both in simple and complex scenes. This difficulty translates into deficits in recognizing salient features, an increased time to detect the target, and difficulty in shifting attention between global and local features [2, 3]. Also, AD patients may have a narrower zone of focal attention, with an increased difficulty in shifting between central and peripheral areas of a scene [4]. Neuroimaging studies suggested that AD patients have a reduced parietal activation and increased temporal activation in visuospatial processing, which leads to impairments in ‘top-down’ control during visual search [5, 6].
Eye tracking technology has been used as a reliable and cost-effective technique to collect visual processing data in clinical populations [7–10]. The minimal verbal or motor requirements subjacent to the method makes it particularly suitable for older participants. Visual impairments have been related to the progression of AD in the literature [11, 12]. Hence the analysis of eye movement has been suggested as a potential and accurate surrogate method of assessing cognitive impairments in the course of AD. These visual deficits translate into impairments in eye movement behavior, with AD patients showing saccadic intrusions, increased saccade latencies, increased catch-up saccades, deficits in fixation. and slow pursuit movement [13–17]. Moreover, oculomotor variables seem to aid in the detection of dorsolateral prefrontal cortex (DLPFC) degeneration in AD. These patients seem to make more incorrect saccades toward the target in an antisaccade task [18, 19], with fewer corrective saccades after the error, and increased latencies when performing this task. These variables seem to correlate with cognitive measures of inhibition, attention and working memory [20, 21].
Eye movement metrics may also be useful in the assessment of visual deficits in AD patients when performing basic and high-order visual perceptive tasks. Mosimann and colleagues [22] analyzed visual exploration in AD patients during a clock-reading task and collected eye movement data while the patients performed the task. They observed that these subjects had different patterns of visual exploration, with a less focused exploration with fewer fixations inside the regions of interest (ROI), longer fixations in different areas, and smaller saccade amplitudes. Healthy controls tend to focus their attention in more central areas of visual scenes, whereas AD patients seem to spread their gaze mostly in peripheral areas of these fields, exhibiting more fixations with an increased duration in these peripheral ROI. This could be explained by an impairment in disengaging their attention from peripheral targets [23].
Recently, the literature has been pointing out early visual impairments in mild cognitive impairment (MCI), an intermediate condition between normal aging and dementia, with an increased risk of progression to AD [24]. Some studies have found memory impairments in MCI using eye movement metrics with novelty preference tasks [25, 26], where the number of fixations and fixation duration was related to short-term memory impairments and damage to the hippocampus in MCI subjects. Also, more recently some authors have used eye movement representation features and machine learning methods to improve diagnostic accuracy by distinguishing MCI subject from healthy controls with high accuracy rates [27, 28].
Attention is also early affected in MCI. In a study comparing different types of visual attention, MCI patients evidenced greater deficits in divided attention as compared to cognitively unimpaired elders [29]. In addition, antisaccade oculomotor measures were found to identify subtle executive changes in MCI similar to those found in subjects with AD, in particular selective attention and inhibitory control [30–32]. In these studies, both patient groups (MCI and AD) displayed a similar oculomotor pattern with longer latencies in correct saccades and a higher number of antisaccade errors. These impairments had strong correlations with neuropsychological measures of selective attention and executive function. Altogether, these findings reflect decreased activation in frontal eye fields in MCI patients, and bring new insights into early manifestations of AD pathology [13, 33].
On the other hand, while visuospatial deficits have been associated with cognitive decline typical of AD, is it still unclear to what extent visuospatial abilities are affected in MCI, specifically if there is a particular pattern of visual exploration associated to this condition. Recent findings suggest that top-down attentional control is affected in MCI, namely a reduction of attention shifting in visual search efficiency [34, 35]. However, little is known about the oculomotor metrics that best describe this decline in MCI patients.
A growing number of studies indicate that machine learning represents a valuable method to integrate large-scale datasets in the diagnosis of complex clinical conditions such as AD. Thus, algorithm-based approaches are likely to bring more accuracy by using multiple features of different subjects to classify them into different clinical groups [27, 37]. The incorporation of analytical methods using machine learning in eyetracking studies may contribute not only to the identification of early cognitive changes in oligosymptomatic individuals that might go unnoticed by more traditional methods of cognitive assessment, but also to monitor disease progression over time with high sensitivity to detect subtle decline.
The aim of the present study was to investigate the association between eye movement metrics and visual search impairment in a sample of older adults with MCI and AD, as compared to cognitively unimpaired elders (healthy controls). We hypothesized that subjects with mild or severe impairments will display abnormalities in oculomotor patterns, which might be attributable to an early visual search impairment in the MCI-AD continuum. In addition, using oculomotor metrics, we expect to demonstrate that machine learning classification methods will discriminate individuals with AD from healthy controls and also help identify the sub-sample of MCI subjects who actually present with a similar oculomotor impairment as observed in AD.
MATERIALS AND METHODS
Participants and setting
The present study was conducted at a specialized memory clinic located in a tertiary university hospital in São Paulo, Brazil. The study group comprised 127 older adults allocated into three groups according to their global cognitive capacity: controls, if cognitively unimpaired (CTRL group, n = 43), mild cognitive impairment (MCI group, n = 51), and mild dementia due to Alzheimer’s disease (AD group, n = 33). Participants were community dwelling outpatients recruited from the hospital catchment area and from psychogeriatric services. A detailed medical, social, and family history was obtained for each subject including, when needed, additional information from caregivers or informants. Participants underwent a comprehensive neuropsychological and clinical assessment (clinical, imaging, and laboratory data), and the diagnosis was established by a multidisciplinary team (including neurologists, psychiatrists, neuropsychologists, and speech therapists). Patients with moderate or severe dementia, as well as those with non-AD dementia were ruled out. Clinical diagnosis of MCI required evidence of a decline in baseline function of memory and possibly additional cognitive domains, according to the Mayo Clinic criteria [38], with the severity of symptoms or consequent functional limitations insufficient to meet diagnostic criteria for dementia, according to the Diagnostic and Statistical Manual of Mental Disorders, 4th edition (DSM-IV-R). The eligibility criteria for AD patients included diagnosis of possible or probable AD based on the DSM-IV-TR and the National Institute of Neurological and Communicative Disorders and Stroke-Alzheimer’s Disease and Related Disorders Association (NINCDS-ADRDA) criteria [39]. Exclusion criteria were the following: neurological or psychiatric conditions/events, ocular diseases, moderate dementia or other type of dementia, calibration problems or low percentage of eye movement recordings. Demographic information is shown in Table 1. All participants gave their written informed consent prior to inclusion into the study, or in the case of dementia patients, a legally authorized representative. All experimental procedures were approved by the institution’s research ethics board, in accordance with the declaration of Helsinki.
Subjects demographics (mean / standard deviation)
If the data did not comply with the ANOVA parameters (heterogeneity and normality), Kruskal– Wallis K-tests was used as a nonparametric statistical test (K column). (p*) significant difference <0.05.
Procedures
Neuropsychological testing
All participants completed an extended battery of neuropsychological assessment, including: the Brazilian versions of the Rivermead Behavioral Memory Test and the Rey Auditory Verbal Learning Test (memory) [40], Rey-Osterrieth Complex Figure Test [41] copy and delayed recall tests (visuospatial abilities, visuospatial memory, and executive functions), Trail Making Test [42] – versions A and B (visual attention and executive functions - task switching and working memory), Stroop Color-Word Test [43] (inhibition), the Verbal Fluency Test [44] (phonemic fluency) and Wechsler Adult Intelligence Scale-Digit Span test [45] – forward and backward versions (attention span and working memory).
Apparatus and eye movement recording
Eye movement was registered with a Tobii TX300 eyetracker. The visual angle was calculated using the relative position of the center of the cornea and the pupil with an accuracy of±0.75°. The system sampling capacity was of 300 Hz, processing latency of 1– 3.3 ms, and the participants were seated at a distance of approximately 65 cm from a 23” screen, where the stimuli were presented. An I-VT fixation filter was used with standard settings, as this specific filter provides highly accurate fixation classifications for commonly used eyetracking paradigms. No movement restraint was used and the participants had a range of freedom of head movements of 37×17 cm. Each subject was asked to shift the eyes between peripheral and central stimulus locations in order to calibrate the eye tracker, using a 9-point calibration system. Eye movement data were recorded using Tobii Pro Studio® software. Once the calibration was successfully completed, the experimenter started the recording session.
Eye movement paradigm
The test protocol was designed by the research team using simple drawn images and public domain pictures (Fig. 1). The protocol contained three clusters of trials. The first was composed of simple geometric forms, the second contained abstract forms, and the last cluster included visual scenes. Each trial consisted of a familiarization encoding phase and a test recognition phase. Trials in one cluster contained images with common features. During the task, participants were asked to carefully observe one stimulus on the screen, and to recognize it afterwards among other three distractor images. All participants were asked to explain the task to the experimenter in order to demonstrate their understanding of the tasks requirements before the experiment started. The familiarization phase lasted between 2 and 5 seconds, according to the complexity of the image (clusters 1 and 2 – 2 seconds; cluster 3 – 5 seconds), after which the participant was instructed on how to respond to the following (test) phase. Images presented on the screen in the test phase were numbered 1 to 4. No limit of time was imposed for the participant to provide his/her answer, meaning that the test phase ended when he/she provided a verbal answer indicating the number of the selected response (image). The correct answer (the same image that had been presented during the familiarization phase) was randomly placed in different areas of the screen (Fig. 2). Once this step was accomplished, the command to start the next trial was given by the examiner.

Representative examples of the images that were used as stimuli in the present study. A) Geometric forms. B) Abstract forms. C) Visual scenes.

Visual search task. T1, T2, and T3 represent three successive moments during the same task. Board A. T1: stimulus presentation; T2: instructions; T3: recognition task. Board B. T1 and T3: representations of the eye movement behavior during test phase.
Eyetracking variables
Eye fixation and eye movement data for each participant were extracted and analyzed using Tobii Pro Studio® software. Eye movement measures were analyzed from trial onset to the subject’s verbal answer that terminated the trial. Fixation was defined as a point of gaze continually remaining within 1° of visual angle for a period of, at least, 100 ms.
The following eye movement characteristics were analyzed in the experiment: 1) time to first fixation (TFF), i.e., time (in milliseconds) taken before the participant fixates gaze on a region of interest (ROI) for the first time; 2) fixations before (FB), i.e., number of fixations before the first fixation on any ROI for the first time; 3) fixation count (FC), i.e., number of fixations made in a specific ROI; 4) duration of fixations (DF), i.e., total duration (in milliseconds) of fixations within an ROI. In the current data analysis, oculomotor parameters were analyzed within two different types of ROI: the ROI where the target is located, and the ROI where the distractors are located.
Statistical analyses
The present set of data is described as mean and standard deviations for numerical variables and absolute and relative frequencies for factors. Baseline sociodemographic characteristics of groups were compared with one-way ANOVA models, Kruskal-Wallis tests and chi square tests. Eye movement variables on target and distractor stimuli were compared among groups with generalized linear mixed models (GLMM) for Gaussian (LMM) and Poisson families, to check for any eventual effect of ‘Group’ (CTRL, MCI, AD), ‘Stimulus’ (Target, Distractors) and any interaction of ‘Group’ x ‘Stimulus’. Age and Education were used as covariates in this statistical procedure.
Machine learning models
The variables considered in this model include the variables previously described and analyzed using statistical software (TFF, FB, FC, DF) and additional filtered variables extracted from Tobii Studio software (first fixation duration - FFD, visit duration - VD, total visit duration - TVD, visit count - VC). Variables were addressed to the ROI related to target stimuli and distractors. In total, there were 13 screen trials in the assay. Minimum, maximum, sum, mean and median values were calculated for all variables, resulting in 3.250 measures for each sample. In total, 1.400 measures were represented in at least 50% of the data samples in one group. These measures were summarized by average using all screen trials. Missing values were not accounted into the final averaged values, resulting in 135 variables. Eight variables were cut out, because variance was equal to zero, i.e., all samples showed the same value, resulting in 127 variables. In order to avoid redundant variables, a Pearson’s pairwise correlation was performed and variables with r≥0.98 were represented by only one randomly chosen variable inside the group. This way 72 variables were represented by 39 variables, resulting in a dataset of 94 non-redundant variables. In order to identify variables to be used in the classification task, three different feature selector algorithms were used: 1) Sequential Feature Selector (SFS), with k spanning 2 to 10, forward and back method with floating and scoring accuracy parameters; 2) Las Vegas Weight (LVW), with iteration 1000, score base 0.8, number of folds 3 and accuracy parameters; and 3) Genetic Algorithm (GA) with cv of 5, score accuracy, crossover probability 0.5 and mutation probability of 0.2. Features selected were used in three different machine learning algorithms: Support Vector Machine (SVM), Random Forrest (RF), and Neural Network (NN). For the SVM algorithm all features were tested with linear, radial basis function (RBF) and polynomial and C and gamma parameters were optimized with GridSearchCV. For the RF model all feature selection model were tested with 300 estimators and balanced weight. For NN only, all variables available or the ones selected by LVM were used, the number of neurons were 55 and hidden layers equaled 2. All algorithms were used from scikit-learn package in python 3.6. Training and test dataset were split into 90% and 10% respectively, and performed 10-fold, which means that the model used was trained, tested and evaluated ten times. The evaluation of each model was performed according to accuracy, precision, recall, F1-score, and area under the curve (AUC). Briefly, the accuracy measures the overall rate of true positives and true negatives over all tested classes. Precision represents the rate of true positive overall number of samples classified as positive (true positive + false positive). Recall calculates the rate of true positive over all samples truly positive (true positive + false negative). F1-score is a mean of precision and recall to give a balance addressing both measures. AUC summarized the model used representing a balanced measure of accuracy and specificity. The former calculates the true positive rate and the latter measures the true negative rate. All the calculations were performed 10 times for each model tested.
RESULTS
Sociodemographic analyses were computed on 43 control subjects (33 women), 52 MCI (41 women), and 43 AD (20 women), as presented in Table 1. Mean (M) age [F(2) = 13.37; p = 0.001] and years of education [F(2) = 22.94, p < 0.001] differed between groups, with AD subjects being significantly less educated (AD: M = 10.42; SD = 5.23) than the other groups (CTRL: M = 15.28, SD = 2.52; MCI: M = 13.10, SD = 3.84) and older (M = 72.97, SD = 6.26) than them (CTRL: M = 67.98, SD = 7.15; MCI: M = 68.62, SD = 7.94). Neuropsychological test scores for each group are also presented in Table 1, indicating, as expected, statistically significant differences across groups. A Pearson correlation analysis failed to demonstrate any potential association between the oculomotor parameters and the neuropsychological measures used in the present study, as seen in previous studies [8, 27]. Accuracy of answers (i.e., percentage of target stimuli correctly recognized among distractor images) produced by each group was calculated. Accuracy rate was very high (>90%) for all three groups. The lowest accuracy was observed in the AD group, with 96.5% of correct answers, followed by MCI (97.3%) and CTRL (98.3%) groups. No differences in accuracy were found between groups (p > 0.05). In addition, correlations between accuracy rates and oculomotor parameters were established, however no statistically significant correlations were found between any of these variables. Given that the aim of the study was to determine differences in oculomotor patterns in people with different degrees of cognitive impairment, and given the similar rate of accuracy of responses observed across groups, the remain analyses were performed only on eye movement variables.
The analysis of eye tracking variables (TFF, NF, FC, and DF) are schematically presented in Table 2 and Fig. 3, and detailed in the following paragraphs.
Eye movement metrics, group comparisons
1Linear mixed effect models, 2Generalized linear mixed model for Poisson family.
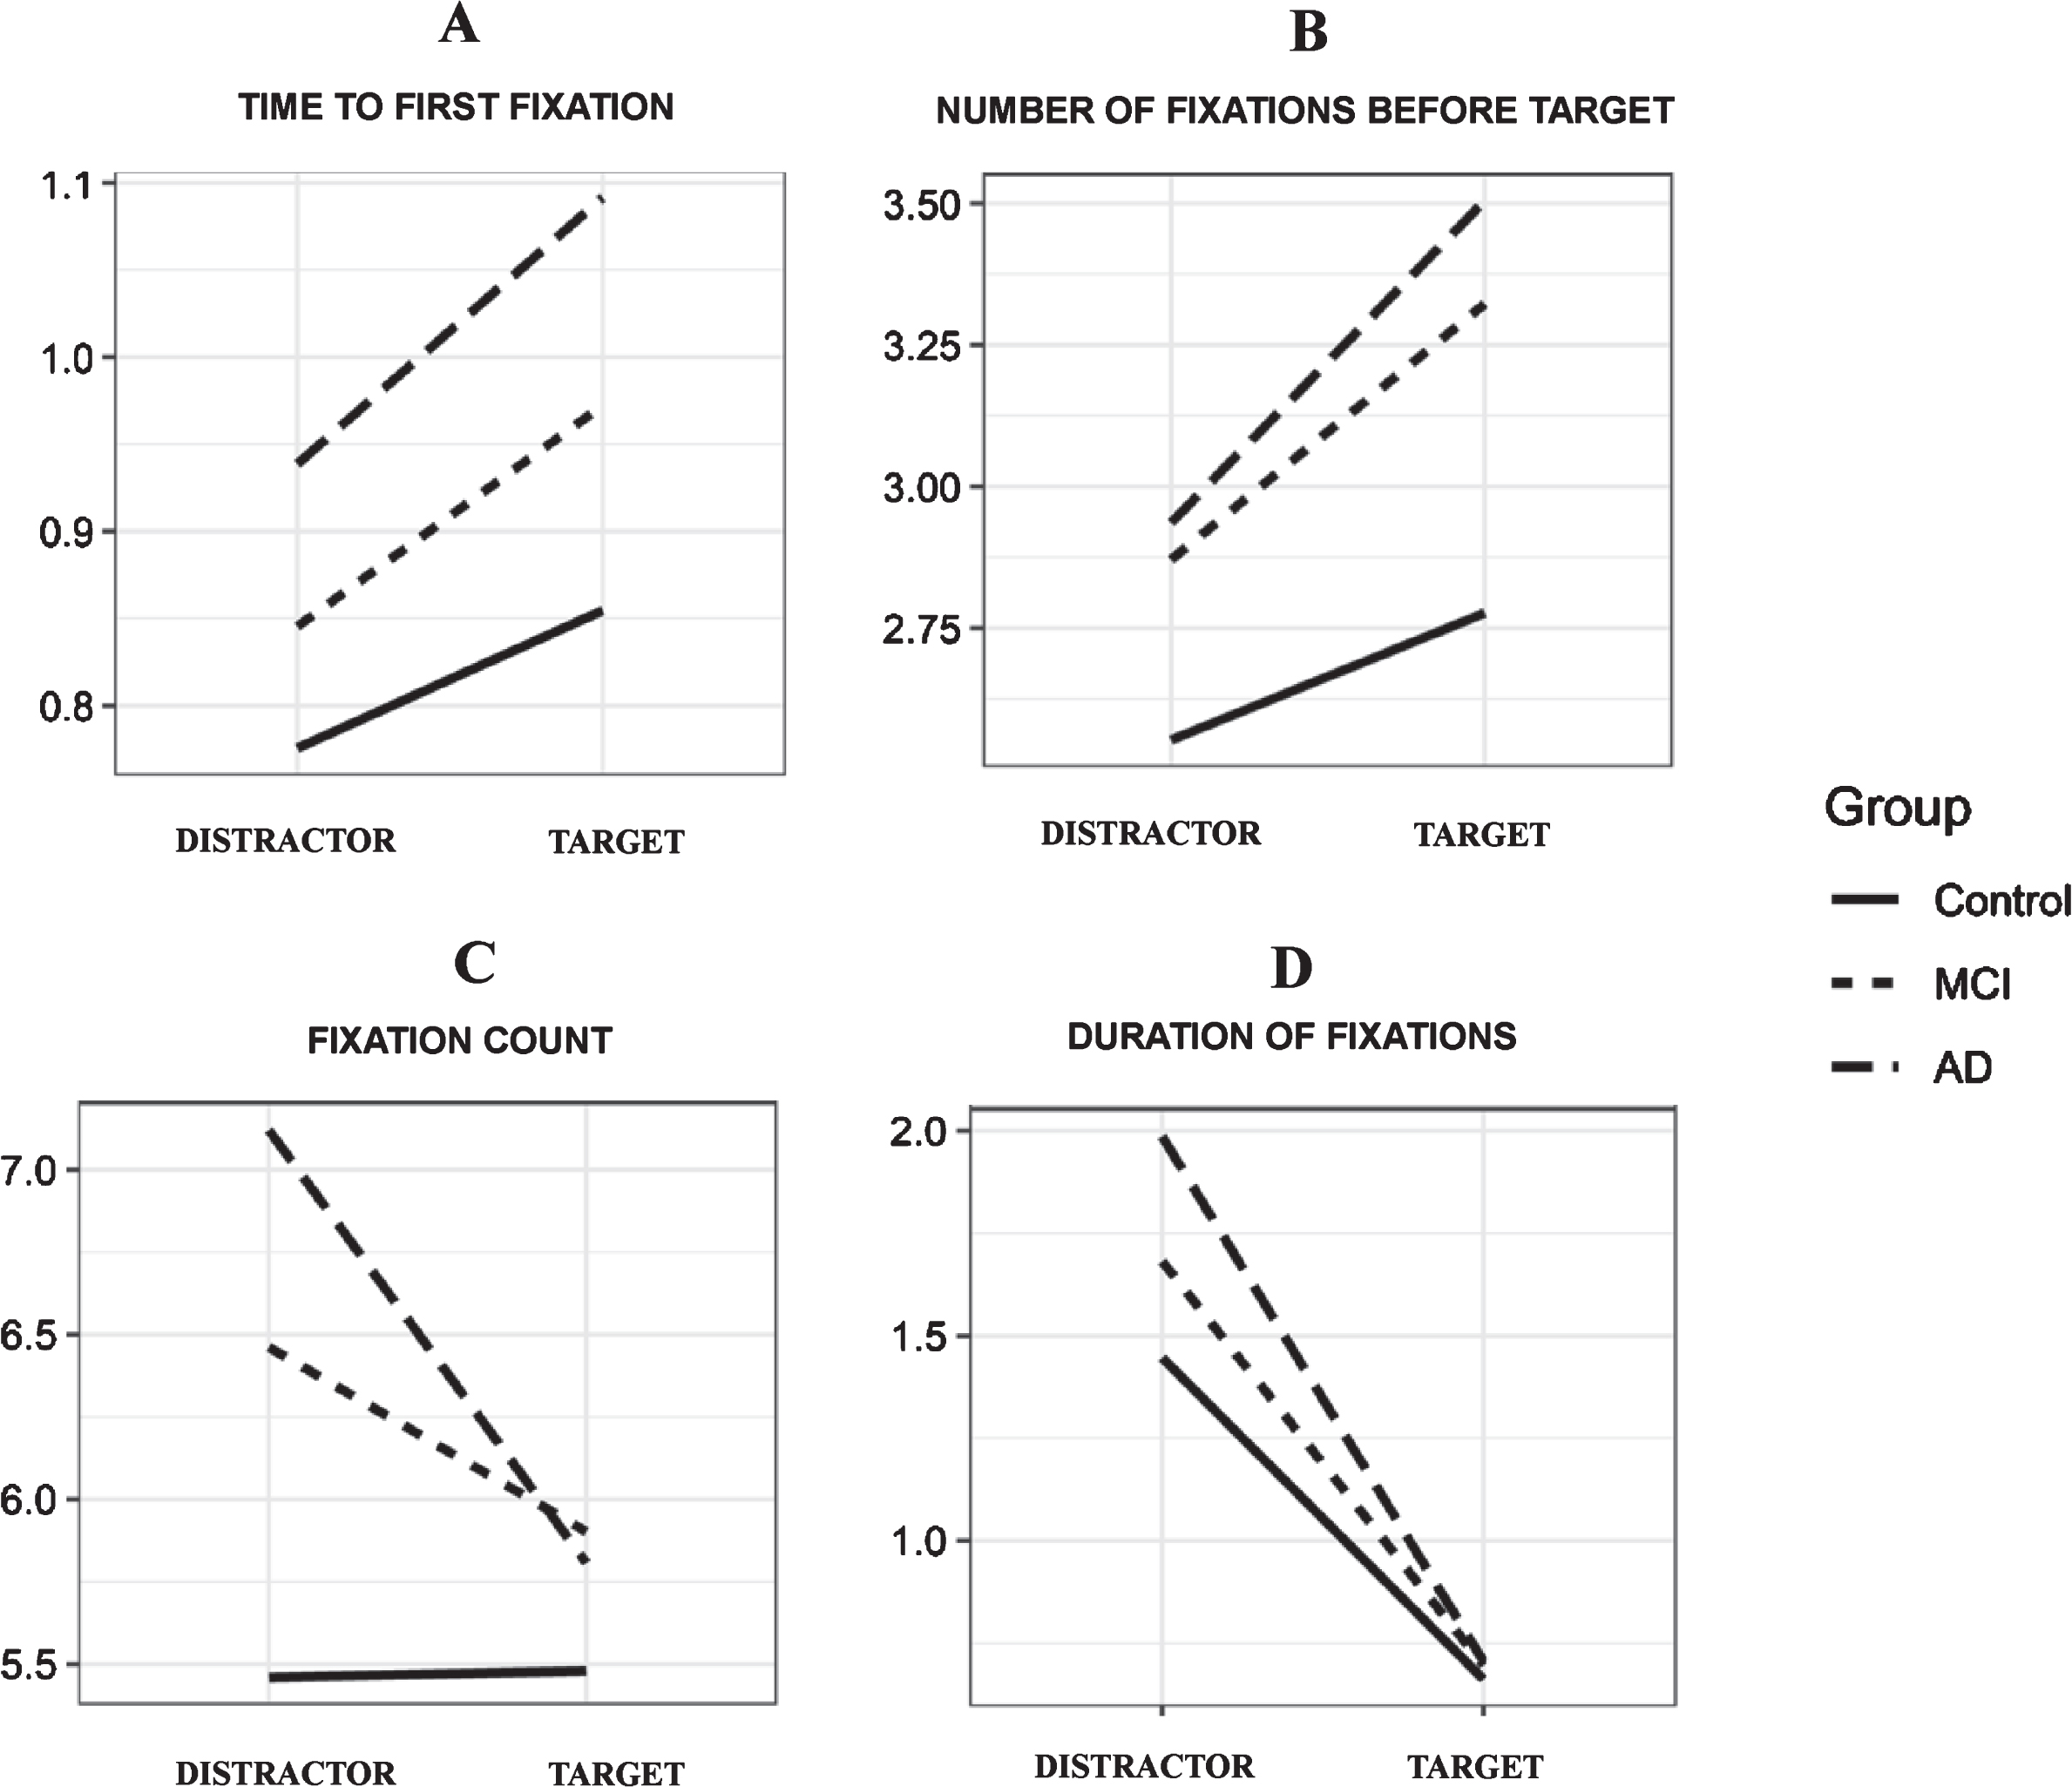
Eye movement metrics in healthy controls, MCI and AD subjects: (A) Time to first fixation (TFF); (B) Number of fixations before target (FB); (C) Fixation count (FC); (D) Duration of fixations (DF).
Time to first fixation (TFF)
In the recognition (test) phase, we found statistically significant differences in mean values for TFF across all groups (p < 0.001), indicating that, in average, participants in distinct diagnostic groups spent a different amount of time looking at different points on the screen before fixating on a stimulus for the first time, irrespective of this first fixation being on the correct or distractor stimulus. AD subjects had significantly higher mean values for TFF than MCI and CTRLS (AD: M = 1.09, SD = 1.06; MCI: M = 0.97, SD = 0.72; CTRL: M = 0.86, SD = 0.68). A statistically significant difference was also found between the MCI and the other groups, with MCI subjects presenting with intermediate TFF values, i.e., between AD and CTRL subjects. Considering the “stimulus” condition (i.e., target versus distractors), all three groups had a significantly higher TFF on the target than on distractors (p < 0.001) (Table 2, Fig. 3A).
Number of fixations before the first fixation on the target stimulus (FBT)
ANOVA revealed that both patient groups (MCI and AD) made significantly more fixations on the screen before looking for the first time at any stimulus (AD: M = 0.97, SD = 1.34; MCI: M = 0.87, SD = 1.03) compared to controls (M = 0.79, SD = 0.89; p < 0.001). As expected, all groups showed a statistically significantly (p < 0.001) higher number of fixations before finding the target stimulus than before finding any of the distractor images, which can be explained by the 3-fold number of distractors present in each trial compared to the (single) target stimulus. Although the interaction ‘Group’ x ‘Stimulus’ failed to reach statistical significance, a trend towards this significance was observed, with both AD and MCI patients (AD: M = 3.50, SD = 3.37; MCI: M = 3.32, SD = 2.32) making more fixations before detecting the target stimulus for the first time than cognitively unimpaired subjects (CTRL: M = 0.86, SD = 0.68; p = 0.055). The same oculomotor behavior was observed for the distractors, with both patient groups fixating more times in the screen than controls before finding a distractor for the first time (AD: M = 0.94, SD = 1.41; MCI: M = 0.85, SD = 1.10; CTRL: M = 0.78, SD = 0.94) (Table 2, Fig. 3B).
Fixation count (FC)
Results of the variable FC did not show any main effects of ‘Group’ (p = 0.228) regarding the number of fixations made inside of the ROI when considering all four stimuli as a whole. However, a main effect of ‘Stimulus’ was observed (p < 0.001), with more fixations being made in the distractors than in the target. A ‘Group’ x ‘Stimulus’ interaction was observed, both patient groups exhibiting significantly more fixations than controls in the distractor ROIs (AD: M = 7.12, SD = 9.58; MCI: M = 6.46, SD = 8.17; CTRL: M = 5.46, SD = 6.57; p < 0.001). The same eye movement pattern was registered in the target ROI, with controls making significantly less saccades (CTRL: M = 5.48, SD = 3.09) than MCI and AD. Nonetheless, despite the similar performance, subjects with MCI made slightly more fixations than those with AD (MCI: M = 5.90, SD = 3.99; AD: M = 5.81, SD = 4.32) when looking at the target stimulus. Interestingly, CTRL subjects seem to exhibit approximately the same number of fixations, regardless the type of stimulus (Table 2, Fig. 3C).
Duration of fixations (DF)
A main effect of ‘Group’ (p = 0.006) and ‘Stimulus’ (p = 0.001) was found for the variable DF (duration of fixations). Controls spent less time fixating on a ROI than patients with MCI and AD, who spent the longest time looking at a specific ROI (CTRL: M = 1.27, SD = 1.85; MCI: M = 1.46, SD = 2.32; AD: M = 1.70, SD = 3.01). Subjects (irrespective of group allocation) spent significantly less time fixating on target stimuli than on distractors present in each trial, as seen by the ‘Stimulus’ effect. ‘Group’ x ‘Stimulus’ interaction was statistically significant (p = 0.013). Specifically, both MCI and AD patients spent significantly less time fixating on target stimuli than control subjects (MCI: M = 0.70, SD = 0.41; AD: M = 0.71, SD = 0.45; CTRL: M = 0.66, SD = 0.38). Time spent looking at distractor stimuli was significantly different between each group (AD: M = 1.99, SD = 3.35; MCI: M = 1.68, SD = 2.58; CTRL: M = 1.45, SD = 2.06) (Table 2, Fig. 3D).
Machine learning classification models
After filtering all the data and removing the redundancy, 94 non-redundant variables were selected. Feature selection resulted in divergent number of variables. Sequential Feature Selector (SFS) analysis resulted in two variables: variable (1), first fixation duration (FFD) and variable (2), number of fixations before fixating on a target ROI (FBT). The Genetic Algorithm (GA) resulted in 11 variables and Las Vegas Weight (LVW) in 13 variables. Using all 4 datasets (all, SFS, GA, and LVW), five algorithms were tested in machine learning. In the present study, we only considered results from models with AUC≥0.75 and accuracy≥0.70 (Table 3). All models were similar to each other; however, the model with the best combination of parameters (accuracy, precision and recall) is LVW Random Forest (RF), with 13 features. However, in order to generalize the model, SFS Support Vector Machine (SVM) with radial basis function (RBF) fitted better the purpose of the analysis. The performance of this model was AUC = 0.79 with accuracy of 0.72, precision of 0.72 and recall of 0.69 (Fig. 4). Calculations were performed with 10 k-fold, with 90% samples for training and 10% samples for validation.
Summary of classification model performance

Receiver Operating Characteristic. Curve using SFS features in SVM RBF model. The AUC is calculated and showed in the bottom. Gray area represents cover for all test performed and dark gray line represents the mean for all tests performed, which was 10 k-fold.
The distribution of sample values in the variable “number of fixations before” (variable 2, FB) showed to be higher in AD than in controls, while “first fixation duration” (variable 3, FFD) was low for both groups (Fig. 5). Only the variable “number of fixations before” (FB) indicated statistically significant higher values in AD as compared to controls (p = 0.00022). This variable showed a mean value of 3.21 (SD = 0.89) in the control group and 4.45 (SD = 1.60) in the AD group, while mean FFD was 0.039 (SD = 0.06) in controls and 0.042 (SD = 0.07) in AD. When this model was used to re-classify subjects in the MCI group (n = 51) as AD or controls, according to the presence of a patterns similar to these other two groups (respectively), this analysis resulted in 25 former MCI subjects re-classified as AD, and 26 former MCI subjects re-classified as controls. In order to verify the potential of this classification, we compared the “number of fixations before” (FB) between groups; we found highly significant statistical differences between AD and controls, the former displaying higher values in this variable as compared to controls (p = 1e-9). The mean value for this variable was 3.05 (SD = 0.43) for patients with MCI re-classified as AD (MCI-AD subjects) and 4.68 (SD = 0.79) for those re-classified as controls (MCI-CTRL subjects) (Fig. 6).

Distribution of SFS variables values into AD and control groups. Upper panel shows a genometric density plot, the areas inside the graphic with geometric figures shows higher amount of samples; x axis represents ‘First fixation duration’ and y axis represent ‘Fixations before focus in AOI’, Lower panel shows the boxplot among groups, dark gray represents AD subjects and light gray represents control subjects; asterisks indicate significance level of p-value (*<0.05, **<0.01, ***<0.001).
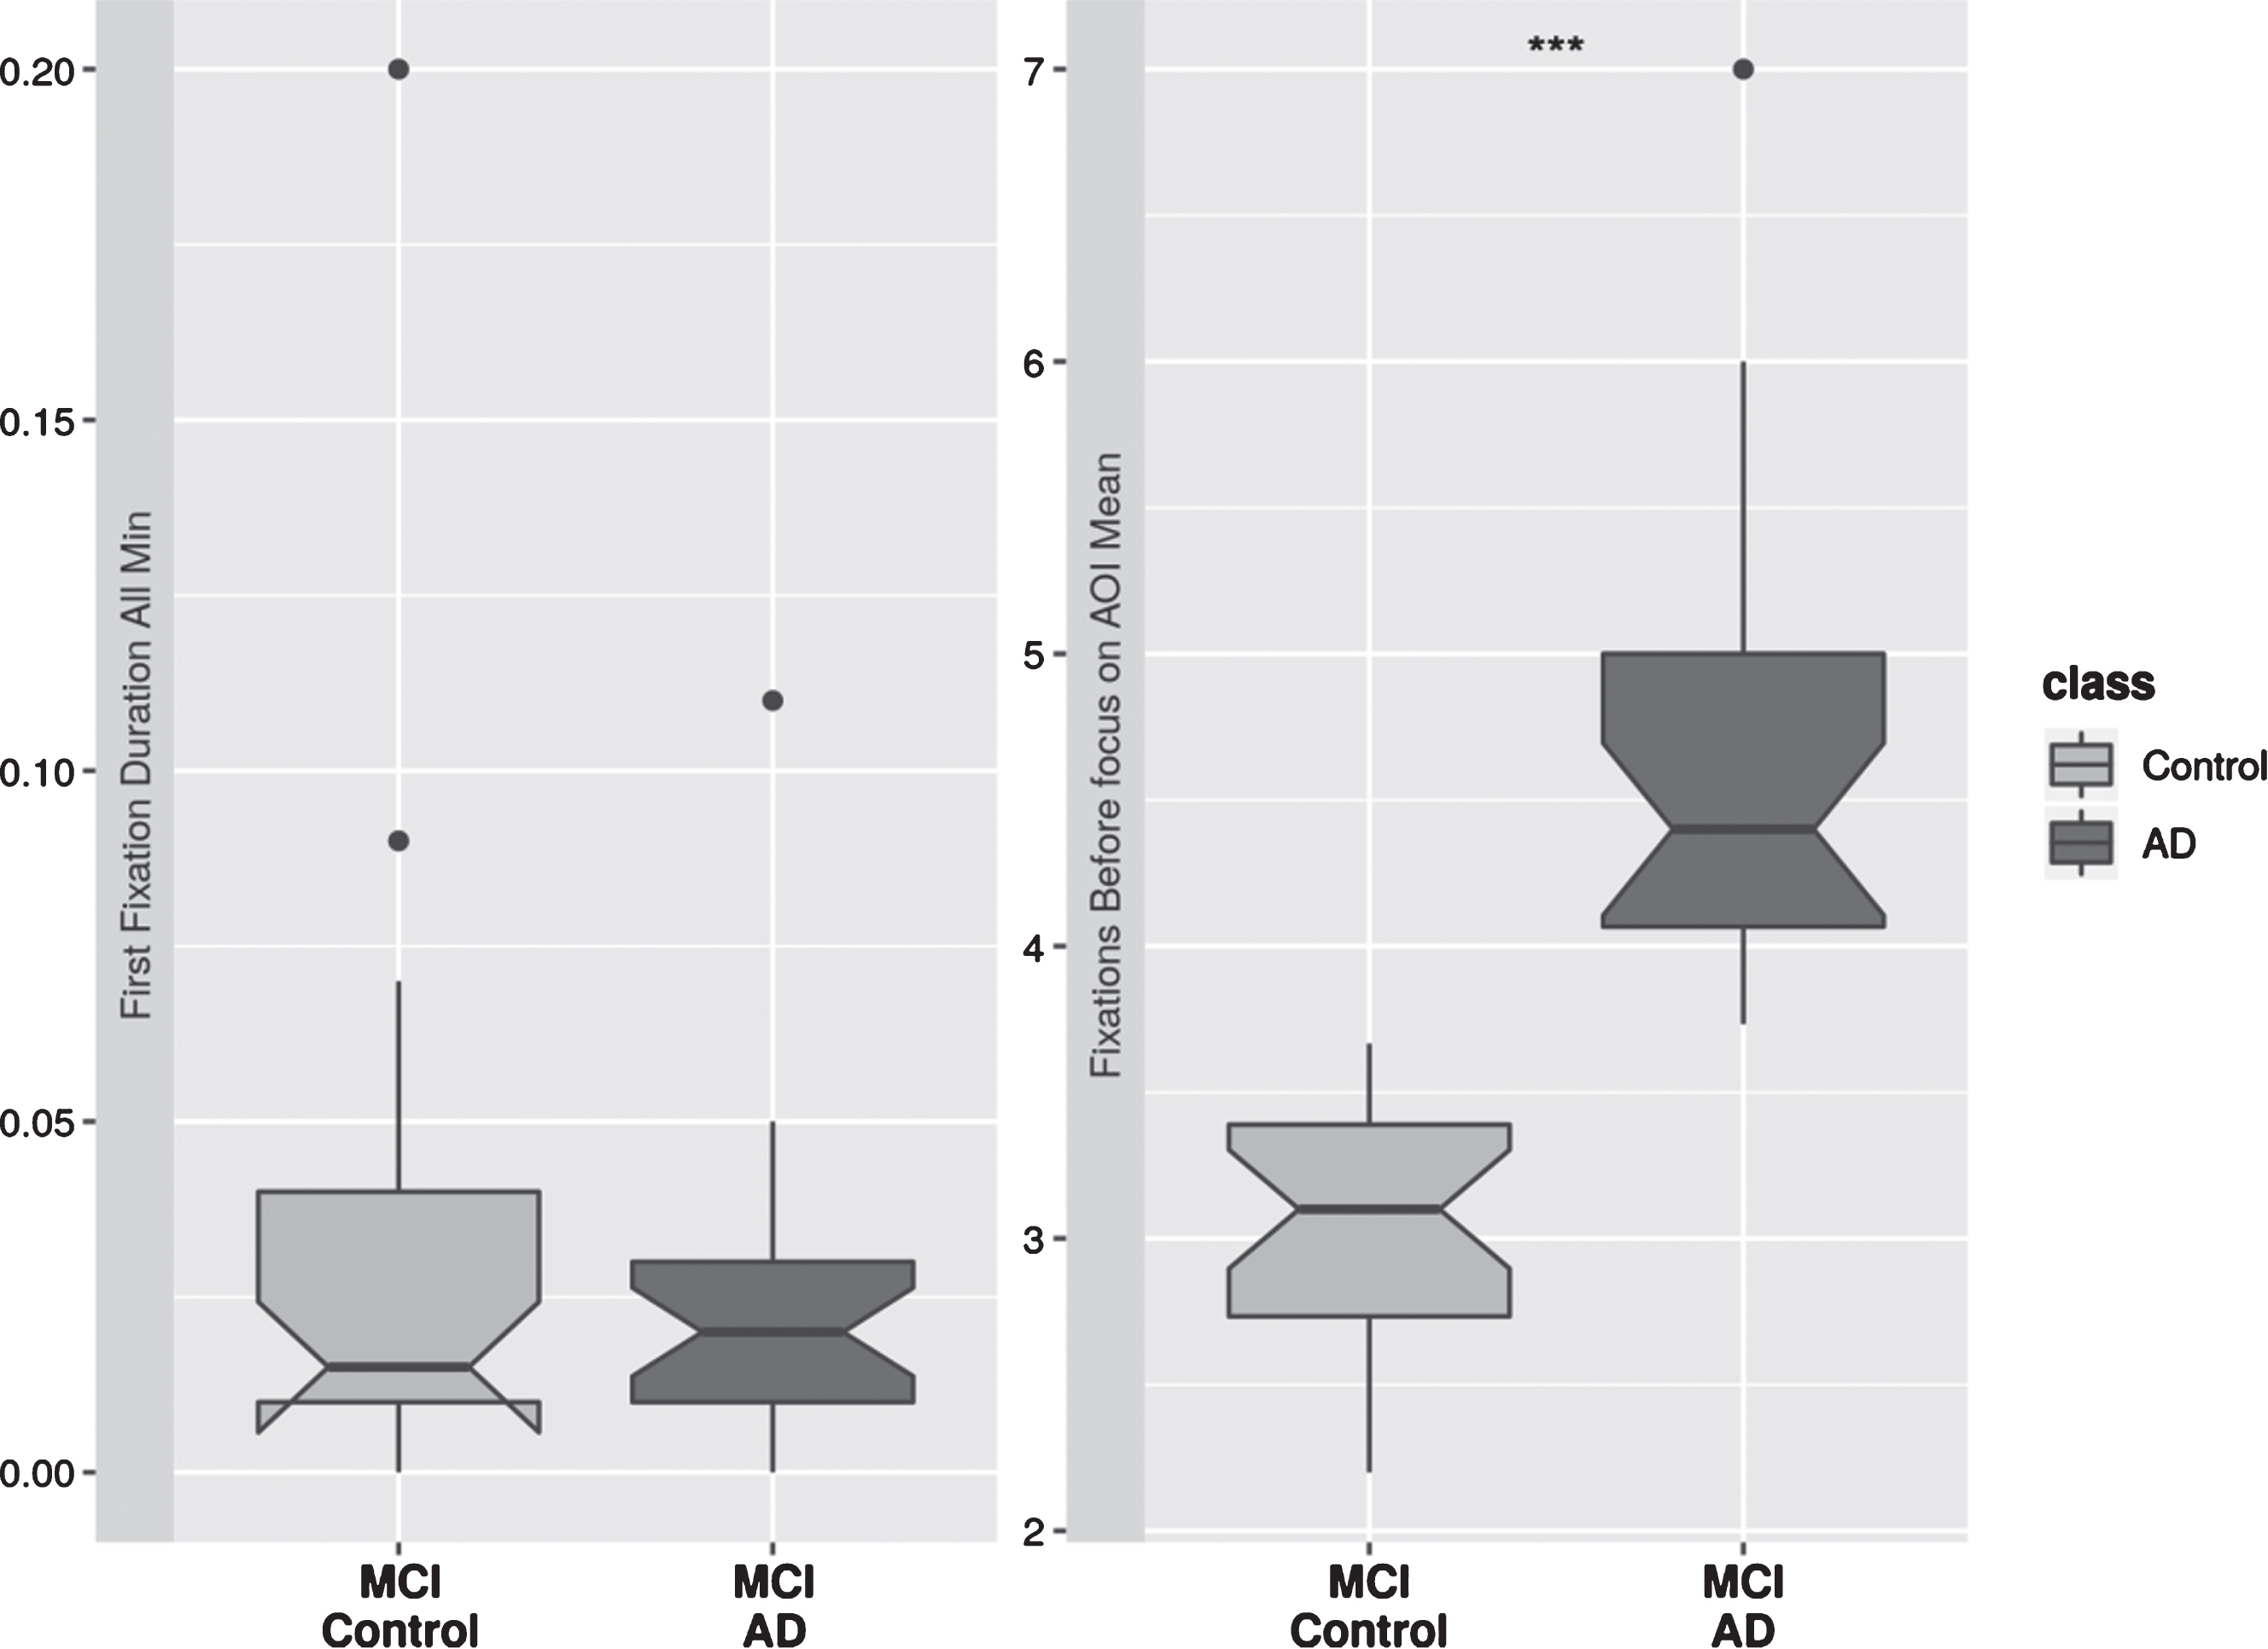
Distribution of variables in MCI subjects classified as AD or Control. Dark gray represents MCI-AD and light gray MCI-Control; asterisks indicate significance level of p-value (*<0.05, **<0.01, ***<0.001).
DISCUSSION
The aim of the present study was to investigate the association between eye movement metrics and visual search impairment in a sample of older adults with normal cognitive function and elderly patients with MCI and AD. Using a conventional statistical approach in the analysis of a set of four eyetracking parameters, our results suggest that MCI and AD patients have a similar pattern of visual search impairment, as reflected by an abnormal eye movement behavior. These findings were corroborated by a more sophisticated, large-scale, analytical approach using machine learning methods to address nine eyetracking variables. Therefore, by addressing visual search behavior with the aid of eyetracking technology, we could accurately discriminate patients with mild dementia due to AD from healthy controls, and to further identify, within the MCI group, a subset of patients with an oculomotor behavior similar to the one found in AD.
In general, cognitively unimpaired subjects tended to have a more efficient visual search pattern by looking a similar number of times at both target and distractor stimuli. However, they seem to spend more time in each fixation when analyzing the distractors than when analyzing the target stimulus. Conversely, patients with cognitive impairment (MCI or AD) showed a less efficient visual search behavior. Both MCI and AD fixated more often on the screen when searching for target stimuli and spent more time doing this than controls. Specifically, both patient groups fixated on distractors more often and for a longer period of time than on the target stimulus. Eye movement control was also not random during the initial screening of the image for all groups. Healthy controls tended to be faster to make the first fixation on the screen, requiring less time to detect distractors than to detect target stimuli. Also, they needed to fixate a smaller number of times on the screen in order to detect any stimulus than cognitively impaired patients in both groups (i.e., MCI and AD). Altogether, these findings seem to be in agreement with the literature confirming that impairments in top-down visual processing may be found early in the course of AD [12, 46]. The decline observed in AD patients in visual search has been associated with decreased gray matter in bilateral parietal lobes, precuneus, occipital, temporal, and frontal lobes [47].
Impairments in time-dependent variables, such as latencies, fixation duration or reaction times, proved to be specific to AD and not just a global slowing of information processing speed due to cognitive aging [3, 48]. A decline in visuo-spatial attention resources is responsible for reduced search efficiency and for a potential neglect of important details when searching for a target. Eye movement paradigms are an objective and accurate behavioral response of these deficits in AD [4, 49]. AD patients reveal slower reaction times due to an inability to move their eyes with the necessary precision and time-efficiency required to perform a thorough scanning of the visual field. Globally, these patients reveal an increase in the number and duration of eye fixations during visual search, narrowing the locus of their attention, which results in deficits on planning their future fixations. This pattern largely contributes to the lengthening of target detection time [14, 50]. Our findings seem to reflect this oculomotor pattern, with both MCI and AD patients not only making more fixations with longer durations, but also making more fixations before finding the target for the first time. This may be explained by slower saccade initiation times due to a decline in the ability to initiate eye movements. However, these explanations should be considered carefully, as some authors failed to find differences in temporal and spatial eye movement parameters between AD subjects and age-matched controls in object categorization studies [51]. Conversely, individuals from the control group showed a much more efficient visual screening, with less fixations before finding the target and with a reduced fixation duration compared to both patient (i.e., cognitively impaired) groups. We can assume that healthy controls were able to limit their random fixations in order to optimize the search for the target ROIs or to optimize their search in the most relevant regions before making a final decision.
In the present study, all three groups distinctively scrutinized targets and distractors. We were able to observe that both patients groups detected distractors faster than target stimuli, spending more time in the corresponding distractor ROIs. This finding was demonstrated by the fact that MCI and AD subjects, as compared to controls, made an increased number of fixations around the distractors, along with a decreased number of fixations, before looking at any distractor for the first time. In parallel, all three groups revealed increased fixation duration around distractors than in target stimuli, with AD patients spending more time looking at the distractors than the other groups, along with MCI subjects spending more time than controls. Therefore, the present set of data suggests that the effectiveness of visual search, regarding the ability to discard incorrect options in a setting with multiple choices, is inversely related to the degree of cognitive impairment. In the present experiment, subjects were expected to find a target stimulus among a larger number of distractors in the visual scene, invariably in the ratio of three distractor items to one single target item, which represents the effective recall of the stimulus presented in the familiarization phase. These results corroborate the literature demonstrating that the visual search in AD patients were significantly slowed by an increased number of fixations on distractors, which causes a negative impact on visual search efficiency [52, 53]. Spatial attention is necessary for accurate perception of complex objects, so impairments in attention could impede stimulus processing. Also, one must acknowledge the fact that similarity between distractors and the target greatly affects AD performance in tasks that depend on memory encoding and subsequent recall. Some authors have advocated that visual search requires high-order processing of multiple features of the target (e.g., shape, color, pattern) [54], and these features must be conjoined so that the target can be correctly discriminated from distractors that might share some of these features. Moreover, the higher the number of distractors present in a visual scene, the longer the time required to find the target [54, 55], Feature-conjunction search is known to be mediated by occipitoparietal cortical areas, which are known to be also affected by AD pathology [56], In a study with feature-conjunction tasks conducted by Cormack and colleagues [52], AD patients made more errors than control subjects in detecting a target when the number of distractors were higher. In the present study, although subjects with MCI spent significantly less time in the distractor ROI (probably due to a less impaired processing of visual information), they exhibited a number of fixations in the distractor ROI similar to the AD group. This finding suggests that impairments in feature-conjunction processing might be already present at incipient stages of the disease process, such as the MCI condition.
Previous studies have proved that impairments in attentional shifting, combined with a marked slowing in information processing speed, prevents AD patients from effectively searching for a target [34, 57]. Interestingly, MCI patients had an altered visual search pattern similar to the one observed in AD. More fixations were made on distractor stimuli than on target stimuli, around which both patient groups (i.e., MCI and AD) made approximately the same number of fixations. In terms of time-dependent measures, MCI subjects had a distinct eye movement pattern, placing themselves between the other two groups in terms of performance. While they presented the same mean values for ‘fixation duration’ as the other two groups when looking at a given target, they spent less time than AD subjects but more time than controls fixating on distractor stimuli. The same pattern can be observed specifically in the ‘time to first fixation’ variable, where MCI occupied an intermediary position between controls and AD. One possible explanation for these findings is that an early impairment in attentional shifting can already be found in MCI condition. This precludes the effective scanning a visual scene and the ability to quickly switch between stimuli, as also occurs in AD. Similarly, a failure in the disengagement of attention from distracting stimuli that display a close resemblance to the target stimulus can lead to failures in planning for a strategic visual search. This finding was corroborated by other studies [35, 58], where the task-related selection of the target (top-down control) was already shown to be impaired already in the MCI stage, and declined further in AD. The observed decline in visual search efficiency might result from an early cortical disconnection in the frontoparietal attention network in patients with MCI, followed by an additional loss of nerve cells in corresponding association areas later on in MCI-AD continuum [58].
In the current study, we analyzed eye movement variables using a machine learning classification model to: 1) distinguish AD participants from healthy controls and 2) to re-classify MCI subjects into CTRL or AD according to their oculomotor profiles. In particular, Support Vector Machine (SVM) algorithm with radial basis function (RBF) yielded the best classification performance, distinguishing groups with an AUC of 0.79, with a precision of 72% and recall of 69%. In addition, the metric of the variable ‘Number of fixations before the first fixation in the target ROI’ exhibited the best discrimination between AD and healthy controls. The same model was able to identify subjects with MCI who had an oculomotor performance similar to healthy elders or similar to AD patients in a statistically significant manner (p < 0.0001). The literature is still very scarce on the use of machine learning methods applied to eyetracking parameters to ascertain variant conditions related to cognitive decline in the elderly. Nonetheless, previous studies seem to corroborate our results, indicating that these methods can aid the detection of cognitive decline based on the analysis of eye tracking data. In a study with a novelty preference task that measures visual memory impairments, an SVM classification algorithm was able to distinguish MCI patients from healthy controls, using eye movement features [37]. Similarly, a hidden Markov model (HMM) distinguished with good accuracy a sample of young-onset AD patients from healthy controls, by means of the analysis of gaze movements in a smooth pursuit task [27]. Other authors reported the use of deep-learning neural networks in identifying AD patients using a reading task with a good accuracy [59]. The large amount of data that can be extracted from an eye movement experiment raises an important issue in terms of data analyses, given that data extraction and processing can be quite time-consuming. In this sense, computer science has drastically changed how eye movement data are analyzed. Nowadays, this is almost exclusively done by using detection algorithm in the raw gaze data. Thus, the combination of machine learning techniques and eyetracking technology opens new possibilities in research and/or clinical settings. Considering elderly people and clinical populations, it allows overcoming motor and physical interference in cognitive assessment and it contributes to a more accurate and reliable clinical diagnosis. In combination with other biomarkers, this might help not only to better identify individuals at risk of conversion in a pre-symptomatic stage of AD pathology, but also it allows to closely monitor disease progression over time.
We must acknowledge that the present study may have some potential methodological limitations. First, with respect to sample size, although larger than most studies conducted so far in this field the present sample was relatively small for machine learning classification analyses. Therefore, a larger sample with more eye movement features might have contributed to a better performance of the machine learning algorithms we tested. Second, regarding the characteristics of the patient group: the MCI sample comprised different sub-types (amnestic, non-amnestic, and multiple-domain) of MCI, which may not be the best approach to address eye movement profiles in non-demented elders. That is to say, more heterogeneous test groups might be more suitable to ascertain subtle changes in visual search related either with amnestic and non-amnestic impairments. Nonetheless, previous studies [60] exploring visual search impairments in MCI samples have shown altered visual search patterns associated with amnestic MCI patients are not the result of normal aging, which suggests that visual search impairments may be an underappreciated area of impairment in pre-clinical stages of AD. Third, in the present analysis, oculomotor metrics did not correlate with neuropsychological or other cognitive measures (data not shown), preventing us to draw further conclusions about the underlying cognitive deficits that might affect visual search abilities in MCI and AD. This is in line with previous research, where no correlations were found between oculomotor fixation patterns in simple visual tasks and specific cognitive tests other than visuospatial / visual recognition tests (e.g., [8, 50]). Future studies should include specific neuropsychological measures of visuospatial abilities but also other executive function measures of cognitive flexibility, inhibitory control, visual attention, and working memory that are known to affect eye movement behavior in these clinical populations [32, 61].
In summary, we have shown that eye movement metrics reveal top-down control during visual search and that they can improve the definition of early cognitive decline in pre-symptomatic stages of AD. Our set of data further suggests that the combination of machine learning methods with eye tracking metrics can be a powerful tool not only in the identification of individuals with high-risk of developing neurodegenerative conditions such as AD, but also in tracking disease progression over time.
Footnotes
ACKNOWLEDGMENTS
This study was supported by Fundação de Amparo à Pesquisa do Estado de São Paulo (FAPESP) (projects 2017/12339-3, 2013/23135-9 and 2015/19632-2). The Laboratory of Neuroscience (LIM-27) receives financial support from Fundação de Amparo à Pesquisa do Estado de São Paulo (FAPESP, Project 2014/20913-3) and Associação Beneficente Alzira Denise Hertzog da Silva (ABADHS).