
Abstract
Background:
Eye-movement behavior has been used as a reliable tool to identify cognitive and behavioral patterns in individuals with different neuropsychiatric disorders including Alzheimer’s disease (AD). Most studies in the field have been dedicated to evaluating eye-movement behavior during cognitive tasks in different protocols using multiple parameters.
Objective:
We aimed to evaluate the differences of eye-movement behavior in healthy subjects, subjects with mild cognitive impairment (MCI), and those with AD in a simple color task with and without cognitive demand.
Methods:
91 subjects: 18 AD, 47 MCI, and 26 healthy controls had their oculomotor parameters assessed during baseline (no cognitive demand involved) and during a simple computational color memory task using an eye-tracker.
Results:
Baseline showed statistically different and heterogeneous results between normal cognition and MCI groups. Familiarization phase of the task could not discriminate between groups in any of the analyzed parameters. AD subjects made longer fixations and visits on distractors, and more frequent fixations and visits on the target areas than other groups during the response phase.
Conclusion:
Eye-tracking time-related parameters differentiate AD subjects from other groups under cognitive demand even in a simple color memory task.
Keywords
INTRODUCTION
The underlying pathogenic processes in Alzheimer’s disease (AD) are present several years before the onset of clinical symptoms and the diagnosis should ideally be established at the pre-dementia stages. Fluid and neuroimaging biomarkers provide in vivo evidence of these pathogenic processes in patients in the AD continuum, from preclinical AD to mild cognitive impairment (MCI) and dementia [1]. These biomarkers are now well-established and available in research settings. However, their clinical use is still limited by the high cost and invasive nature of some procedures (e.g., lumbar puncture). Non-invasive methods for early diagnosis and more accessible biomarkers have been the focus of research in recent years.
Over the years, different research fields analyzed eye movement behavior using eye-tracking (ET) to identify cognitive and behavioral patterns in individuals with different neuropsychiatric disorders [2–4]. Preliminary data suggest that eye-tracking and cognitive computational testing combined to access eye-movement parameters may favor the identification of impairment in memory processes. Furthermore, the detection of those impairments could improve the discrimination of MCI patients from healthy subjects, with possible implications for the early identification of individuals with a high risk of developing AD [5, 6].
Eye movement can be analyzed in the form of saccades and fixations. Saccades are quick shifts in eye position. Fixations refer to the subject’s vision focused on a point in space over time. Different fixation characteristics can be measured, such as duration, count, and rate [6, 7]. Using these oculomotor parameters, approaches focused on high-order cognitive functions (cognitive demand or cognitive load) have established fixation duration and pupil response as relevant tools for assessing attention, memory, and processing load. Fixation duration is sensitive to the attentional dedication to a fixated location and will be lengthened by memory load. On the other hand, fixation duration increases as processing becomes more effortful [8–11]. Most studies using eye-tracking metrics to assess brain functions in AD have been dedicated to evaluating eye movement behavior during tasks involving cognitive effort. However, literature on eye-tracking shows multiple protocols and chosen parameters of study with a major focus on fixation duration and saccadic movements. Other parameters, i.e., fixation count and visit count or duration on targets or regions of interest, are less studied. In addition, it is essential to determine whether the differences in eye movement patterns of AD subjects are related to the task’s cognitive demand or if it is also present at baseline when no high-order brain function is involved. In a previous study held by our group, we investigated the association between eye movement patterns and visual search impairment in a sample of older adults with MCI and AD comparing them with cognitively healthy subjects [3]. Similar to most literature on the subject, it was an exploratory study in which we analyzed multiple parameters not following a defined protocol. Furthermore, we did not analyze differences between the parameters during baseline and during tasks.
Therefore, in this current study, we aimed to evaluate the differences in eye-movement behavior in healthy subjects, subjects with MCI, and those with AD, assessing oculomotor parameters during baseline and using a simple memory color task, previously defined as a protocol to study oculomotor behavior in older adults. We hypothesize that even simple protocols are sufficient to determine differences between diagnostic groups.
METHODS
Overview and design
We present a study of eye movement patterns in older adults using an eye-tracking device. All subjects were submitted to a baseline assessment phase before the memory task when no action was required. The color task was divided into “familiarization” and “response” phases, each consisting of 16 screens. During these three phases, specific parameters were measured and analyzed (see below). Written informed consent was obtained specifying volunteer participation, anonymous handling of data, safety guidelines, and good clinical practice at the local institution. The study was approved by the local Ethics Committee.
Population
For this study, a convenience sample was formed. Participants either sought medical attention at our service due to actual memory complaints/symptoms or voluntarily joined the cohort of older adults to learn about their cognitive state. The sample size was not previously calculated since the objective of the study is to analyze another method’s ability to demonstrate differences in oculomotor behavior between diagnostic groups, adding to our traditional neuropsychological assessment.
Inclusion and exclusion criteria
Participants were sixty years or older with or without cognitive complaints, with normal or corrected-to-normal vision. Patients with moderate or severe dementia due to AD were excluded from the study. In addition, subjects with non-AD dementia, visual or oculomotor disabilities, monocular vision, illiterates, and those with other neurological or psychiatric comorbidities were also ruled out.
Cognitive and functional assessments
The attending psychiatrist performed a general mental state examination, and the protocol included the Brazilian versions of the Montreal Cognitive Assessment [12], Geriatric Depression Scale (GDS) [13], and Scale of Instrumental Activities of Daily Living [14].
Clinical assessment
Laboratory tests (blood count, biochemistry, serum levels of glucose, thyroid hormones, folic acid, vitamin B12, lipid profile, and immune tests for syphilis) and neuroimaging scans such as computerized tomography (CT) or magnetic resonance imaging (MRI) were obtained for all participants as per protocol, and additional tests/scans were requested on a clinical basis.
Neuropsychological assessment and clinical diagnosis
All participants underwent a comprehensive neuropsychological examination, including Rivermead Behavioral Memory Test [15, 16]; Trail Making Test [17, 18]; Digit Span [19, 20]; FAS-COWA [17]; Rey Auditory Verbal Learning Test - RAVLT [21, 22], Stroop test [17, 18], and Rey-Osterrieth Complex Figure [23, 24].
Diagnosis and respective group definitions were established by multidisciplinary consensus considering all available clinical information and carried out by an experienced physician team, including psychiatrists and neurologists, and well-trained neuropsychologists who performed the cognitive evaluation. The diagnosis of MCI followed the Mayo Clinic guidelines [25], and the diagnosis of probable AD was made according to the National Institute of Neurological and Communicative Disorders and Stroke-Alzheimer’s Disease and Related Disorders Association (NINCDS-ADRDA) [26].
Apparatus
We used a Tobii TX300 eye-tracker to record eye movements. The system sampling capacity was 300 Hz, with a processing latency of 1–3.3 ms. The participants were seated 65 cm from the 23” screen presenting the stimuli (total visual angle of 10.1°). Head movements were not restrained: participants’ head movement could vary freely by±37 cm along the horizontal, and by±17 cm vertically. We conducted an eye movement register and the following data filtering using the Tobii Studio Software. Images were presented in colors on a white background and were designed specifically for this project.
Eye-tracking assessment
Calibration
Before the task presentation, a nine-point (3×3 greed) calibration procedure was accomplished by having the participant fixate nine points at specific locations on the screen by following a moving marker (red circle) that appeared across the nine points. The calibration occurred until the equipment accurately mapped the participant’s gaze on the screen. We excluded participants to whom the equipment could not be calibrated.
Baseline
Images used on baseline protocol consisted of two types of shapes: regular (familiar) geometric shapes, and irregular hexagons. Regular shapes were colored, while irregular hexagons could be either colored or black. We presented stimuli (Fig. 1) on the computer screen and asked all the subjects to look carefully at those images, with no specific cognitive goal or active response required. The protocol consisted of sixteen test screens containing two different images each, presented for 3 s. The two images were either regular shapes or irregular hexagons. A fixation point was presented for 900 ms at the center of the screen between each stimulus to avoid participants gazing at any other part of the monitor when we presented the next stimulus screen. The first eight screens (cycle 1) were presented again (cycle 2), in the same order after the eighth screen.

Baseline protocol - the stimuli selected were distributed in eight different test screens, each containing two different images presented for 3 s. A fixation point was presented for 900ms at the center of the screen between each stimulus presentation to avoid participants gazing at any other part of the monitor when we presented the next stimulus screen.
Color protocol
Only one type of irregular hexagon was used in this task so that color would be the only changing element on the screen (Fig. 2). The colors used in this protocol were orange, green, blue, yellow, black, pink, gray, brown, purple, and red. During the familiarization phase, subjects should memorize the color of the pair of images presented on the screen to tell whether the ones presented afterward (response phase) had the same or different colors from those previously seen. The position of the hexagons on the left or right side of the screen during the response phase was irrelevant.

Color protocol - was divided into “familiarization” and “response” phases. During the familiarization phase, the screen presented two identical irregular hexagons of two different colors for 2000 ms. Another pair of irregular hexagons of two different colors (either equal or different from the familiarization phase) were presented at the response phase. A fixation point presented for 900 ms separated the two phases, and another one was presented for 1500 ms before each new familiarization screen.
This test comprised 32 screens: 16 familiarization and 16 response screens containing two stimuli, eight of which will be similar, and eight will differ from those presented in the familiarization phase. The colors were distributed to avoid the consecutive presentation of the same colors that could give distracting characteristics to the screens. The 32 screens (cycle 1) were presented again in the same order after the first cycle (cycle 2).
Parameters of analysis
We defined fixations as the constant gaze direction to a point on the screen of 1° of visual angle for a minimum of 100 ms. Regions of interest (ROI) were defined as the spatial delimitation in which fixations and other ocular movements were counted (Fig. 3). Every figure in this protocol contained four ROIs, which consisted of the four quadrants of each figure.
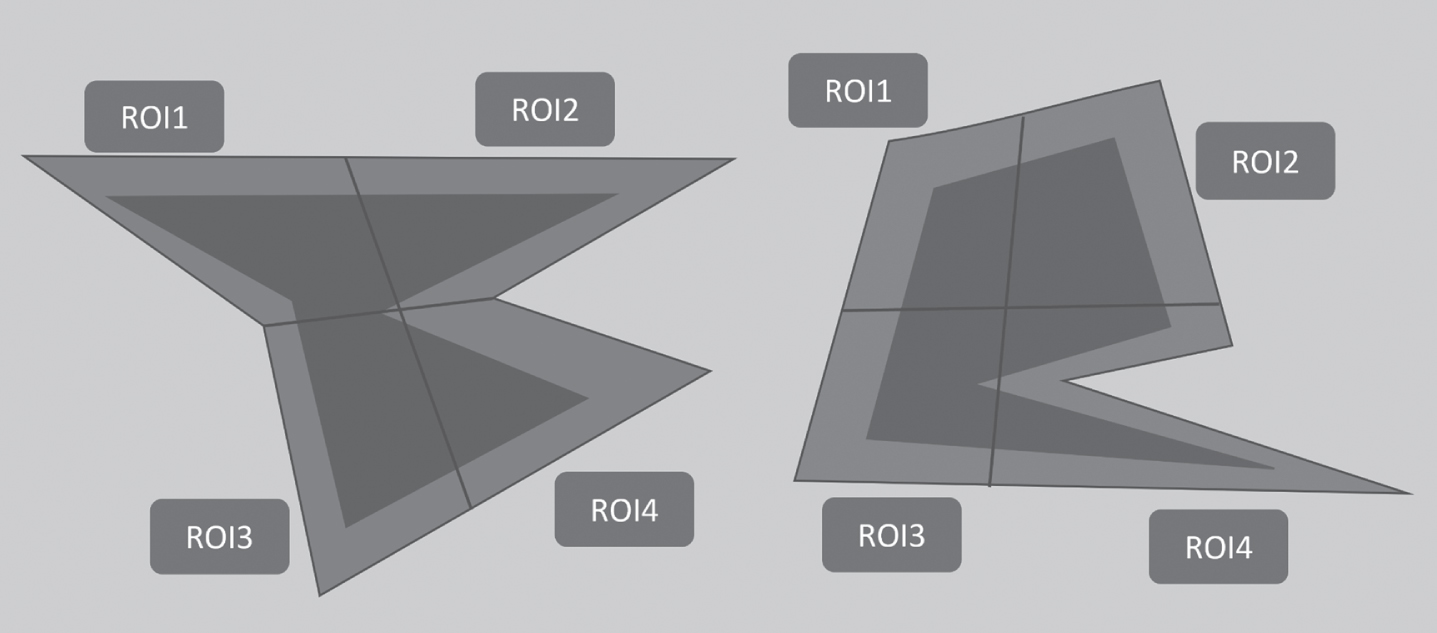
Example of a stimulus screen adapted to present the designed regions of interest. Every figure contained four ROI, which consisted of the four quadrants of each figure.
Delimitation of the quadrants was essential for a better analysis of the oculomotor behavior, especially in tasks that required a verbal answer with underlying cognitive demand. We hypothesize that memorizing the colors of the images in the Color protocol would not require gazing at any specific part of the image, but the fixation point presented between every screen could make fixations happen closer to the center of the screen.
We analyzed the following oculomotor parameters: (a) fixation duration (FD): the total sum of the duration for all fixations inside an ROI; (b) fixation count (FC): the number of fixations made on a specific ROI; (c) visit duration (VD): the total sum of the duration for all visits inside an ROI; (d) visit count (VC): the sum of all visits inside an ROI during a single visit. Noteworthy, during a single visit the subject can fixate different parts of the ROI and each fixation can have different durations. Superior central quadrants were considered targets after the visual analysis of control subjects’ eye movement behavior. We then named the superior central quadrants target areas, and the remaining regions were distractors.
Statistical analysis
Continuous variables were described as means and standard deviation and baseline measurements were compared between groups using an ANOVA model or Kruskal-Wallis test, and chi-square test. In addition, pairwise comparisons were carried out with Tukey or Steel-Dwass-Critchlow-Fligner (SDCF) methods. As for the eye-tracking data, normal linear mixed-effects models (LMM) were fit. Interaction graphs were constructed to aid the interpretation of results as well as estimated marginal means. Residual normality assumption was verified by inspecting the QQ plots for each case and Levene’s test was used to test for homoscedasticity. Significance was set at 0.05.
RESULTS
Overview
We studied a total of 93 individuals. Subjects were divided into three groups, 28 in the NC group, 44 in the MCI group, and 21 were AD patients. All participants were able to complete the study and perform all tasks.
Sociodemographic characteristics
As presented in Table 1, subjects were equally distributed in gender and age (p > 0.05). AD patients were found to have significantly fewer years of education than NC (p < 0.05) and MCI (p < 0.05).
Sociodemographic and neuropsychological assessment data of all three diagnostic groups
NC, normal cognition; MCI, mild cognitive impairment; AD, Alzheimer’s disease; df, degrees of freedom; MoCA, Montreal Cognitive Assessment; GDS, Geriatric Depression Scale; RBMT, Rivermead behavioral memory test; RAVLT, Rey Auditory Verbal Learning Test; TMT, Trail Making test; DSF, digit span forward; DSB, digit span backwards; aPearson’s Chi-squared test; H, Kruskal-Wallis test was used as non-parametric statistical test; bPost-hoc comparison used Bonferroni alpha adjustment; Significance set at 0.05 (*).
Eye-movement metrics, group comparisons
1Linear mixed-effects models (LMM).
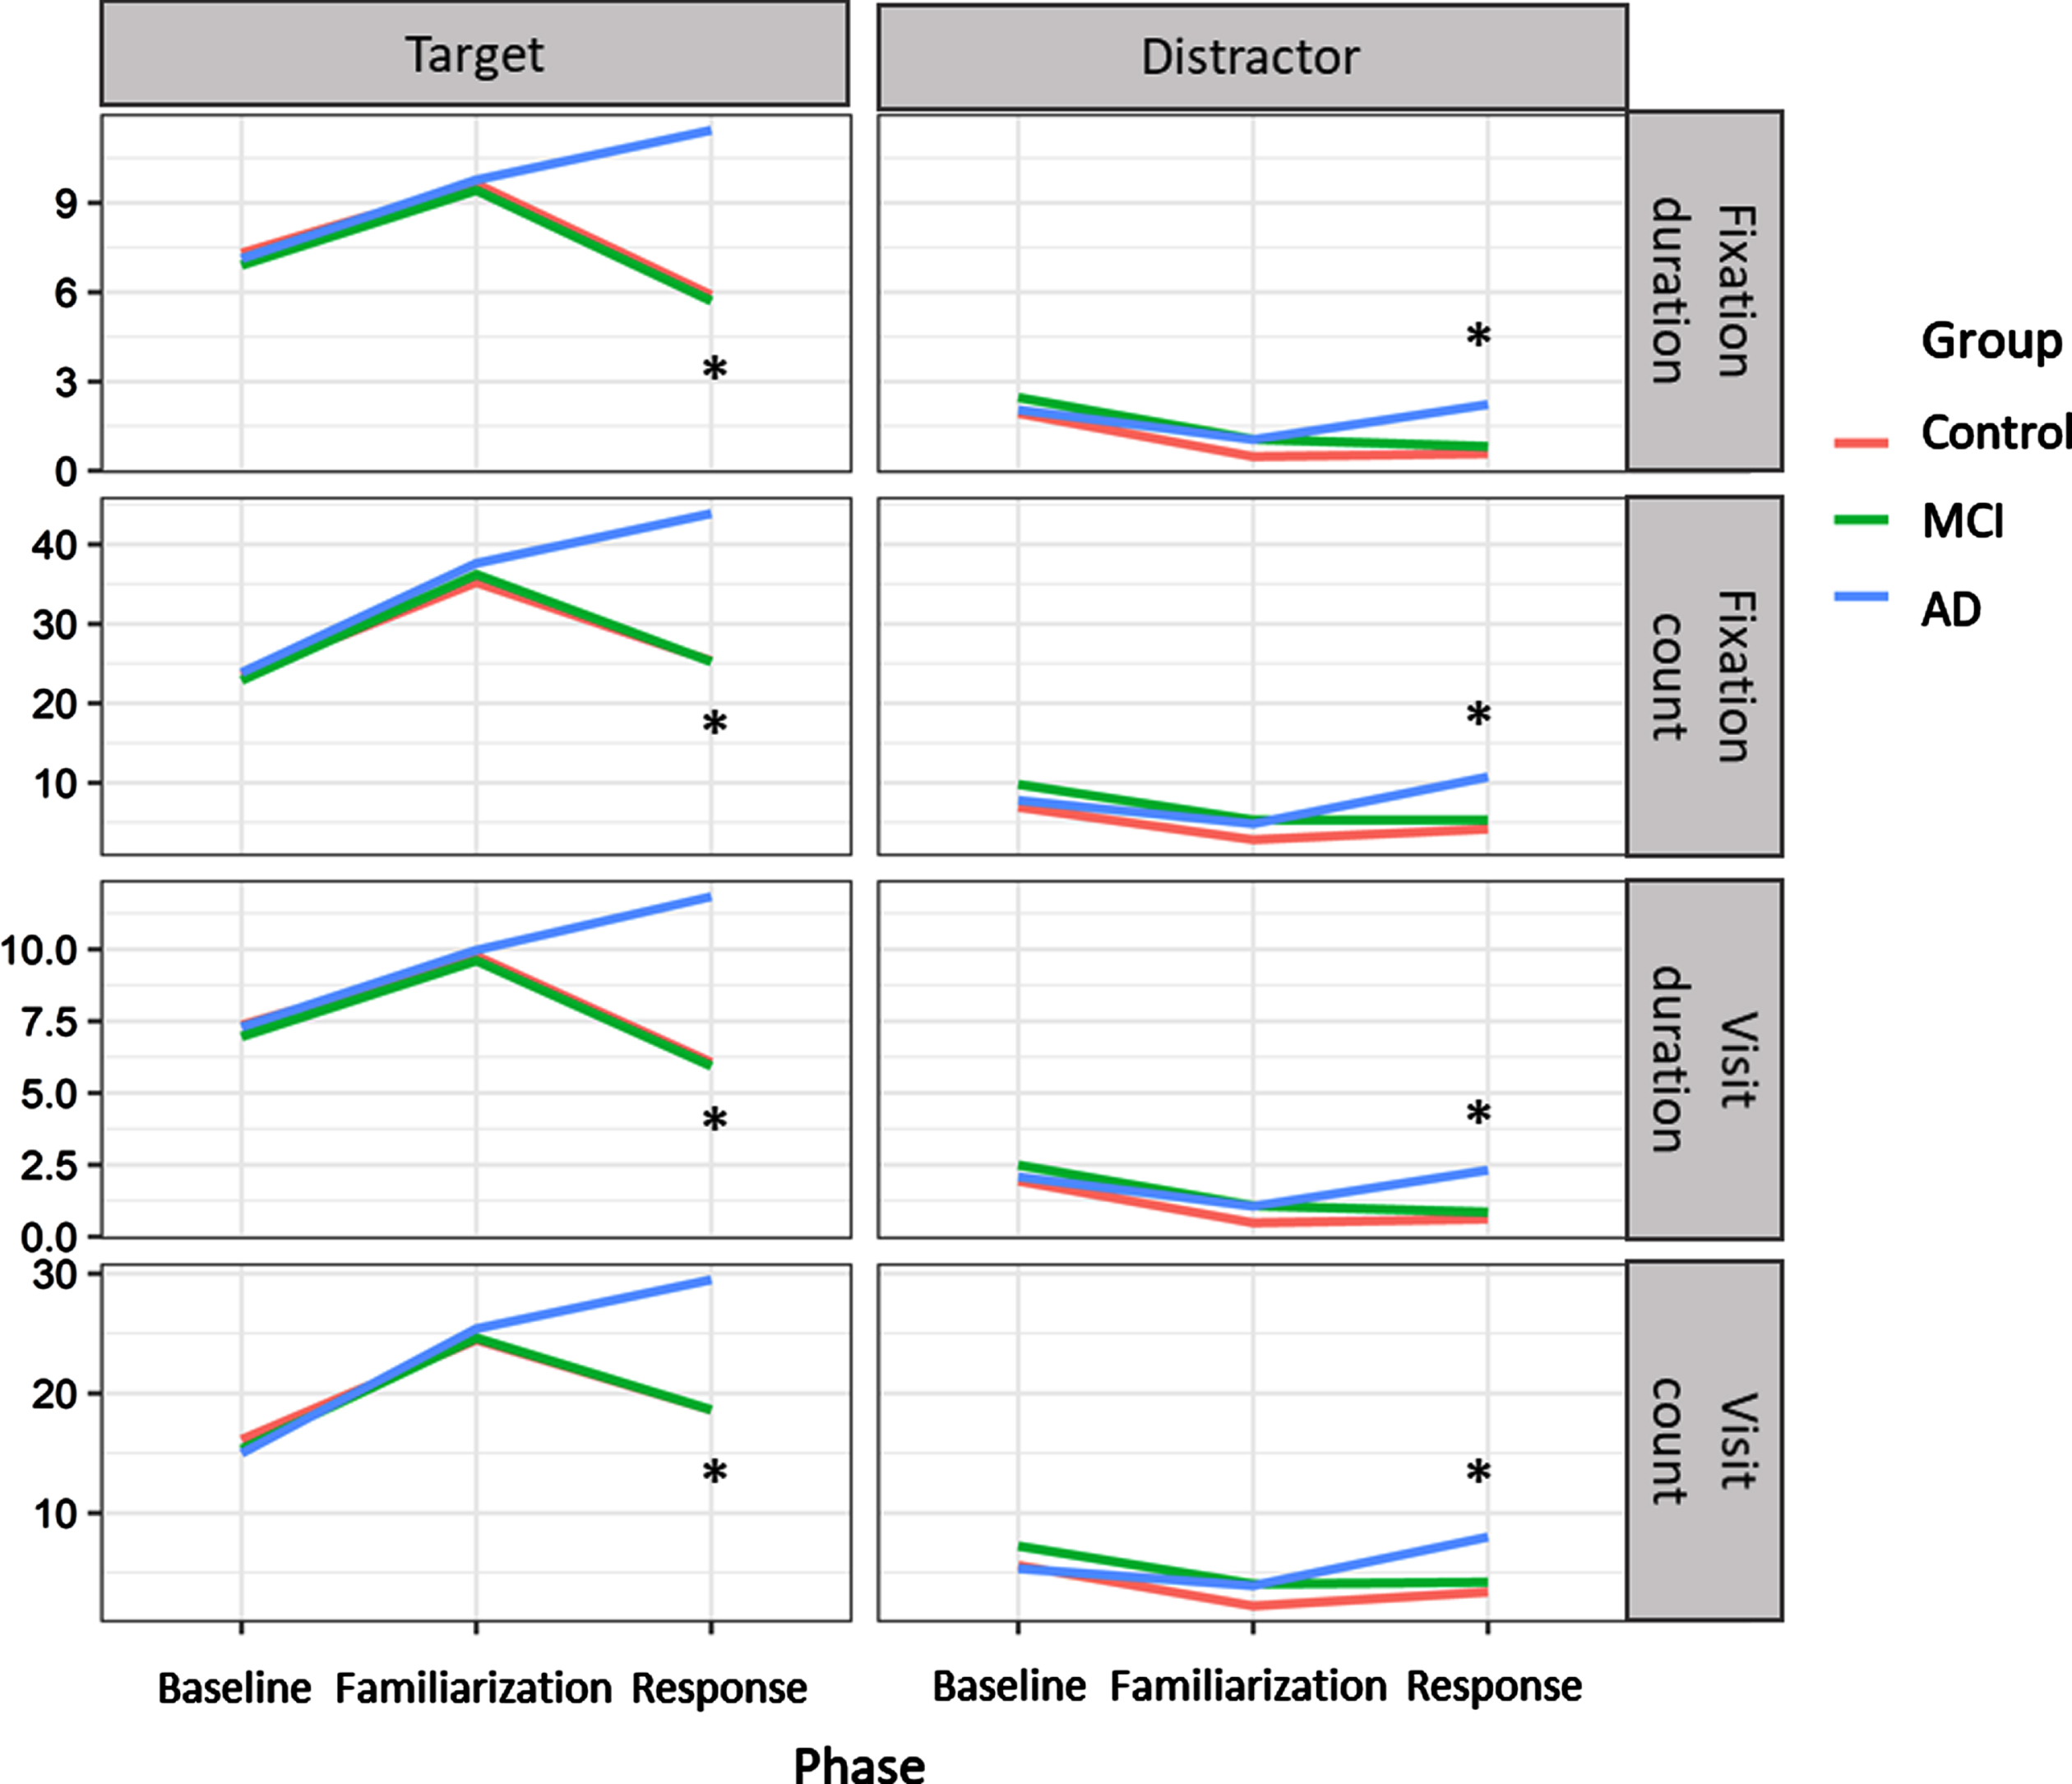
Results from both baseline and task for each oculomotor parameter. Baseline showed no statistically significant differences between diagnostic groups nor did the familiarization phase of the task for any of the analyzed parameters. During the response phase, AD subjects make longer fixations and visits and more frequent visits to both target and distractors than the other groups. AD subjects make more frequent fixations on the target areas than the other groups, but fixations in the distractor could only discriminate between AD and NC. *p≤0.05.
Baseline
The analysis of the selected parameters in the baseline protocol has not shown statistically significant differences in the eye-movement behavior of the three diagnostic groups.
Color protocol
The familiarization phase has not discriminated between groups, neither when related to target areas nor distractors in any selected parameters.
However, during the response phase, AD subjects showed longer FD (NC-ADtarget: –5.54, SE = 0.56, t = –9.97, p < 0.001; MCI-ADtarget: –5.74, SE: 0.51, t = –11.32, p < 0.001; NC-ADdistractor: –1.66, SE = 0.56, t = –2.98, p = 0.008; MCI-ADdistractor: –1.42, SE: 0.51, t = –2.80, p = 0.015) and VD (NC-ADtarget: –5.77, SE = 0.57, t = –10.21, p < 0.001; MCI-ADtarget: –5.89, SE: 0.52, t = –11.43, p < 0.001; NC-ADdistractor: –1.70, SE = 0.57, t = –3.01, p = 0.008; MCI-ADdistractor: –1.46, SE: 0.52, t = –2.83, p = 0.013) in both targets and distractors. AD’s FC was higher than the other groups in target areas (NC-ADtarget: –18.51, SE = 2.70, t = –6.86, p < 0.001; MCI-ADtarget: –18.66, SE: 2.45, t = –7.60, p < 0.001), but only higher than controls in the distractors (NC-ADdistractor: –6.51, SE = 2.70, t = –2.41, p = 0.043). VC showed more frequent visits from AD subjects in both targets and distractors (NC-ADtarget: –10.92, SE = 1.63, t = –6.70, p < 0.001; MCI-ADtarget: –10.90, SE: 1.48, t = –7.35, p < 0.001; NC-ADdistractor: –4.64, SE = 1.63, t = –2.85, p = 0.013; MCI-ADdistractor: –3.79, SE: 1.48, t = –2.56, p = 0.030) when compared to the other groups.
DISCUSSION
In the present study we used an eye-tracking device and a simple memory color task to assess eye movement patterns of three diagnostic groups, NC, MCI, and AD, at baseline and under cognitive demand. Time-related parameters (FD duration and VD duration) together with FC and VC differentiated AD subjects from other groups during the response phase of the task. In addition, these variables pointed to a slower and hectic pattern of eye movements in AD patients. In summary, our findings showed that AD subjects did 1) longer and more frequent fixations on target areas, 2) longer fixations on distractors, 3) longer and more frequent visits to target areas, and r) longer visits to distractors.
We have previously shown that MCI and AD subjects have a similar pattern of visual search impairment [4]. However, the present study represents an improvement from our previous observations. We were now able to distinguish AD patients from all other diagnostic groups. In addition, we were able to determine a particular profile of eye movements in AD patients using no more than four eye-tracking parameters. Our findings showed that AD subjects did longer and more frequent fixations on distractors and target areas than NC subjects. In addition, there was also a statistically significant difference between these parameters when comparing AD and MCI subjects. Conversely, although we chose not to include “time to first fixation” and “fixations before” parameters at this time, we hypothesized that the simplification of the eye-tracking metrics would represent a significant improvement in the reproducibility of the study. Simpler protocols could also fit better in clinical practice.
Baseline
There is a lack of studies showing measurements of spontaneous gaze parameters. In our study, during baseline when no action was required from subjects, data showed no statistically significant differences between any of the diagnostic groups. This finding suggests there is an oculomotor behavior similarity between cognitively impaired subjects and healthy controls when no cognitive demand mediates their visual tracking. It could also represent that the cognitive effort required to respond to a task is necessary to distinguish patient groups from controls, and visual exploration may be specific to the task. This was previously demonstrated by another study with a different method [27], supporting the idea that spontaneous gaze and the respective oculomotor measures are not impacted by the disease.
Color protocol
Data from the familiarization phase of the color protocol did not discriminate between groups regarding all parameters neither on target areas nor on distractors. This finding suggests that the cognitive demand was not dependent a priori on the complexity of the stimuli during the preliminary visual exploration, i.e., at baseline and familiarization phase, but with the memory load associated with the task in the response phase. Conversely, during the response phase, AD subjects did longer and more frequent fixations and visits on target areas and distractors compared to other groups. The significant increase in the fixation duration in the response phase, when compared to the familiarization phase, represents a concurrent increase in the cognitive demand [8–10].
Studies of eye movements in specific tasks have been trying to understand which phase of the memorization process—decoding of the original image, temporary retention of the information, comparison between original and new images, or realization of this comparison—impairs the ability to identify changes between images. Some have stated that impaired attention is the main reason eye movement changes in AD patients occur [28]. The attention dedicated to the tasks’ first phase would determine the information coding on short-term memory, thus impacting the eye movement pattern during the final comparison between original and new images [29, 30]. In addition, longer fixations could represent a reduced capacity to shift attention from one stimulus to the next [31, 32]. However, the observed changes in our study seem to suggest a greater impact of memory load rather than attention load since the response phase of the task requires access to the representation of the image previously observed and comparison with the current image. This could represent impairment of exploration strategies combining multiple cognitive functions, including attention, short-term memory, and stimulus processing. Researchers suggest that decreased motivation and curiosity could also be involved as a result of apathy, typically found in AD patients [33].
As in other recent studies, AD patients’ analysis of FC and VC parameters demonstrated their excessive dedication to distractors, which meant gazing at regions of the images not relevant to favor color memorization with reported impairment of multiple functions such as slower reaction times, longer fixations, and slower saccade initiation times [4, 34]. The difference in our protocol compared to those from the literature is that the areas named “target” and “distractors” were actually parts of the same image. The distracting effect of “distractor” areas was related to the fact that subjects did not have to explore those areas to memorize the image’s color, which makes focusing on the central areas sufficient and economical. This could explain why AD patients made significantly more frequent visits and fixations on both the distractors and target areas in our study, reinforcing the hypothesis of inefficient visual search evidenced by the constant refixations on different parts of the stimuli. In fact, it is well documented that AD patients have poor visual search efficiency [4, 34]. This fact leads to the increased duration and number of visits observed in this group.
The clinical findings presented in this study have long been related to specific neurophysiological dysfunctions and neuropathological changes classically found in AD patients [11, 35]. Patients with AD show parietal dysfunction that could represent the main underlying culprit of the impaired top-down control of exploration. Longer fixations could also be explained by differences between the dysfunction of occipital-parietal and occipital-temporal networks [27, 36]. Additionally, neuropathological changes associated with impairment of visual exploration in AD patients would be mostly related to reduced gray matter in regions such as bilateral parietal lobes, precuneus, occipital, temporal, and frontal lobes [37]. It seems that eye movement patterns found in AD patients are specific to the condition, supporting the relationship with the underlying pathological changes. This notion is reinforced by research showing that eye movement tasks can differentiate patients with AD from those with cognitive impairment resulting from depression [38].
Our study has some limitations. First, although statistical tests were not impaired by our sample size, we have to acknowledge that a larger sample of subjects in NC and AD groups would be preferable to allow for more robust generalizations of our findings. Finally, we have not studied the correlation of the parameters presented with neuropsychological assessment data. This correlation could contribute to a better understanding of the top-down mediation of cognitive function on eye movement patterns. As previously demonstrated, neuropsychological test scores correlate with some eye-tracking parameters [39]. The task used in this experiment proved to be sufficient to evidence significant differences in patients’ performance compared to MCI and healthy controls. The routine neuropsychological evaluation is extensive and time-consuming, representing significant clinical practice limitations. Eye-tracking tasks could represent a faster and more objective tool in diagnosing cognitive decline due to AD. Further limitations include differences found between groups in age, education, and GDS scores. These are expected differences in studies of the AD continuum and for the current study do not represent significant impairment in the research problem under investigation.
Treisman and Gelade [40] suggested that the visual search requires the processing of multiple stimuli characteristics such as color, shape, and pattern and that these characteristics should be grouped to determine the adequate distinction between targets and distractors. However, in our study, there was an increase in AD’s time-related parameters during the response phase even with the simplification of the task, now focused only on one image feature (color). The tasks used by researchers to study eye movement patterns are numerous and there are no standardized protocols. We believe that the simplification of the protocol would represent a first step in widening the use of eye movement as a marker of cognitive decline. However, we agree that more complex strategies could increase the number of possible parameters evaluated and would allow further understanding of the complex manifestations of neuropsychiatric and neurodegenerative diseases.
MCI subjects
In our study, the MCI group was composed of different subtypes, i.e., amnestic and non-amnestic MCI, with no previous distinction. We opted to study the MCI group without distinction of subtypes with the objective of simplifying this first protocol. However, research shows that the visual search impairment present in amnestic MCI could represent an AD early diagnostic marker [28]. Some MCI subjects outside the AD continuum could have similar visual search patterns to NC subjects or a different pattern not yet characterized. The analysis of similar data considering MCI’s different subtypes and using machine learning methods to account for numerous variable outputs could lead to a promising tool in the early diagnosis of AD. Few studies have demonstrated impairment in eye-movement patterns in MCI subjects. Most findings are related to saccadic movements and are yet conflicting showing both intact and impaired movements [41–44]. We found no studies presenting alterations on time-related parameters associated with MCI diagnosis. Further analyses and studies are needed to comprehend the specific eye movement patterns related to MCI and how they can predict the conversion to dementia.
The advancement of eye-tracking metrics and the standardization of protocols of study are of utmost importance. The use of eye-tracking as a diagnostic tool requires a further definition of the best parameters of study for each task, the creation of a gold standard set of tasks, and universal validation, widening their use. This could represent eye-tracking being used as a rehabilitation tool for cognitive decline. Neuropathological changes related to AD are found early in the course of the disease and some of these changes are reflected in the plasma concentrations of specific biomarkers. In parallel, molecular neuroimaging is capable of demonstrating early changes related to the disease, before the onset of dementia. Determining early changes in both eye movement patterns and classical AD biomarker profiles, and their correlations could represent a means of integrating novel tools for early diagnosis of causes of cognitive decline.
Footnotes
ACKNOWLEDGMENTS
This study was supported by Fundação de Amparo à Pesquisa do Estado de São Paulo (FAPESP) (projects 2017/12339-3, 2013/23135-9, and 2015/19632-2). The Laboratory of Neuroscience (LIM-27) receives financial support from Fundação de Amparo à Pesquisa do Estado de São Paulo (FAPESP, Project 2014/20913-3) and Associação Beneficente Alzira Denise Hertzog da Silva (ABADHS).