
Abstract
Neuroinflammation has been shown to play a crucial role in the development of Alzheimer’s disease (AD) and also has an association with amyloid-β (Aβ) plaques, a hallmark of this disease. Physical exercise has emerged as an alternative treatment for pathological impairment in AD. In light of this evidence, together with the fact that the hippocampus is one of the first structures to be affected in AD, we analyzed hippocampal changes in Aβ load, inflammatory responses, and locomotor activity in transgenic APP/PS1 mouse model for AD submitted to a resistance exercise (RE) program. One month after the start of the RE program, the locomotor hyperactivity related to AD behavior was reduced and microglia recruitment was increased, which in turn may have contributed to the decrease in the volume of Aβ plaques. In addition, the RE program restored the levels of IL-1α, IL-4, and IL-6 cytokines to control levels. Our study indicates that RE has beneficial effects on the locomotor behavior, amyloid burden, and inflammation of AD pathology and can therefore be used as a therapy to improve the clinical symptoms and neurophysiological alterations in AD. To the best of our knowledge, this is the first study to use a resistance exercise program in transgenic AD model.
INTRODUCTION
The earliest Alzheimer’s disease (AD) studies described cognitive deficit and memory loss as clinical symptoms, and cerebral atrophy, formation of extracellular amyloid-β (Aβ) plaques and intracellular neurofibrillary tangles of tau protein as the main neurophysiological alterations present in both AD patients and animal models. Aβ plaques are formed by deposits of amyloid fibrils composed of longer hydrophobic fragments of Aβ peptides, the product of the abnormal cleavage of the amyloid-β protein precursor (AβPP). In early-onset AD, a missense mutation in APP and/or Presenilin (related to AβPP cleavage) genes causes the release of longer forms of Aβ peptides that are more prone to self-aggregation, leading to an accumulation of the peptide, which is a process that also occurs later in late-onset AD [1–3].
In response to injury or immunological stimuli, microglia, the resident macrophage in the central nervous system, acquire an activated phenotype which may have neurotoxic or neuroprotective effects depending on the stage and severity of the lesion. Aβ deposition in the brain leads to a microglial activation with phagocytic actions, protecting the brain against pathogens and removing cellular debris, producing and releasing pro- and anti-inflammatory cytokines in an attempt to maintain cerebral homeostasis [4, 5]. However, it has been suggested that chronic microglial activation in AD can become detrimental, leading to failure in Aβ plaque phagocytosis, and dysfunction in the production of cytokines [6, 7]. The presence of activated microglia surrounding the plaques is widely noted in the literature for both human and animal models [8]. While the microglia that surround the Aβ plaques appear to increase anti-inflammatory cytokine levels, the Aβ oligomers have a more toxic effect, associated with an increase of pro-inflammatory cytokines [9]. Thus, the functional reduction in phagocytic activity together with the imbalance in favor of pro-inflammatory cytokines promotes a toxic environment, contributing to the progression of the disease [10].
This scenario, and the lack of effective treatments for AD, has led to a search for alternative treatments. Physical exercise releases exercise-induced miokynes capable of altering brain physiology; stimulates neurogenesis and neuroplasticity through neuroprotective effects by increasing neurotrophic factors and modulating inflammatory responses; and improves cognitive function [11–13]. More specifically, Lourenco and colleagues recently showed that aerobic exercise brings significant benefits in humans and mice and that FNDC5/irisin acts as a mediator of exercise-induced neuroprotection [13]. Resistance exercise (RE), in particular, provides beneficial effects for the elderly, such as improvement of memory and physical functioning, thus leading to a better quality of life [14–16]. Despite being highly recommended in the elderly, this type of exercise has not been widely explored as an AD therapy [17].
With similar clinical and pathological signs to those present in AD patients, the transgenic APPswe/PS1dE9 mouse model (APP/PS1) represents a useful tool in AD studies. APP/PS1 animals present early Aβ plaque formation, mainly in the hippocampus and cerebral cortex, followed lately by cognitive impairment [18, 19].
The hippocampus is one of the first structures to be affected in AD: Aβ deposition and neurofibrillary tangles are found in early clinical stages of the disease [20]. Its vulnerability in AD means that the hippocampus has been the target structure of studies of AD animal models [21]. Based on these observations, the present study investigated the effects of a RE program on locomotor activity and neurophysiological changes related to the neurodegenerative processes in AD. Using the hypothesis that a prolonged resistance exercise program would modulate inflammatory responses and contribute to Aβ clearance, we evaluated microglia and Aβ plaque densities and levels of pro- and anti-inflammatory cytokines in the hippocampus of APP/PS1 animals.
MATERIALS AND METHODS
Animals
Twenty-nine adult male double-transgenic mice co-expressing APPswe/PS1dE9, here termed as APP/PS1, age 6-7 months old, weighing between 25 g and 30 g, were used in the AD groups, and 27 age-matched littermate male wild type (WT) mice were used in the control groups. The animals were provided by the Center for Development of Experimental Models for Medicine and Biology (CEDEME/UNIFESP) and housed in groups of five in standard polypropylene cages (41×34×16.5 cm) in a pathogen-free facility. Room temperature was maintained at 21±2°C with 12 h light/dark schedule (with the lights on at 6:00 AM) and food and water ad libitum. Animals were maintained in accordance with the National Institute of Health Guide for the Care and Use of Laboratory Animals (NIH Publications N° 8023), revised in 2011. The Ethics Committee of UNIFESP approved all experiments under protocol n° 8378171216.
Experimental design
The mice were divided into four groups: APP/PS1 mice (APP/PS1, n = 15); APP/PS1 mice submitted to resistance exercise (APP/PS1+RE, n = 14); and the respective controls, Wild Type mice (WT, n = 15) and Wild Type mice submitted to resistance exercise (WT+RE, n = 12).
At the age of 7 months, the exercised groups started the resistance exercise (RE) protocol, 5 times per week over 4 weeks. Seventy-two hours after the last exercise session, the animals were tested in the Open Field (OF) arena in order to assess their locomotion; this was done to exclude the possibility of a locomotor impairment induced by the RE. One day after the OF test, the animals were euthanized, their brains were removed and post-fixed for immunohistochemistry or had the hippocampus dissected for ELISA and MILLIPLEXMAP assays.
Resistance exercise (RE) protocol
The RE protocol consisted of climbing a ladder with a progressive load (adapted from Cassilhas et al., 2012) [22]. The apparatus was a vertical ladder 115 cm high, 80° inclined, 10 cm wide, with 1 cm grid steps and a housing chamber (25 cm width×20 cm length×20 cm height) at the top of the ladder. Before starting the climb, a metal ring was fixed with a tape to the mouse’s tail and the animal was placed in the housing chamber for 1 min. After the climbing phase, the ring was removed from the animal’s tail and they were returned to their cages.
The familiarization phase comprised 3 days of climbing the ladder 6 times with 1 min of rest between trials. The animal performed 2 trials starting the climb from the upper third (35 cm) of the ladder. Subsequently, 2 trials were performed starting the climb from the middle (55 cm) of the ladder, followed by 2 trials starting the climb from the bottom and climbing the whole ladder (115 cm).
The load phase started 2 days after the familiarization phase and lasted 4 weeks. Each week consisted of a first day for the maximum load test, followed by 4 days of training (climbing with progressive load), then 2 days of rest. On the first day of the first week, the animal’s weight was used as a reference load for the maximum load test. The animal climbed the ladder twice with 75, 90, and 100% of the reference load progressively (6 trials in total), and 1 min of rest was given between trials. The next run of trials started 2 min after the 6th trial and 3 more grams were added for each trial, with 2 min of rest between them. The load was changed using the ring, and if necessary, the animal was stimulated to ascend with a gentle touch to its tail. The test was stopped when the animal failed to climb the ladder after 3 stimuli in one trial.
The 50, 75, 90, and 100% of the heaviest load in the test was used as the training load phase over the next 4 days of the week. Each mouse performed eight climbs with each load twice, progressively, with 1 min of rest between series. Over the following 3 weeks, the reference load was based on the 100% of the previous training load and the training load followed the same pattern as the first week.
OF test
Locomotor activity was measured in an OF circular arena identical to that described in Wuo-Silva et al. (2016) [23]. The OF apparatus consisted of a circular wooden box with an open top and a floor divided into 19 approximately similar regions delimited by three concentric circles of different radii (8, 14, and 20 cm), intersected by radial line segments. The animals were placed individually in the center of the arena for free exploration. The session lasted for 10 min and was recorded in order to blind count later. Total locomotion and rearing were analyzed. The unity of locomotion was deemed when the animal stepped with its four paws on a floor unit and rearing was deemed when the animal stood on its two hind paws.
Immunohistochemistry
Mice were deeply anesthetized by ketamine/xylazin and transcardiacally perfused with 0.1 M PBS followed by 4% paraformaldehyde (PFA). The brains were removed from the skull and kept immersed in PFA for 48 h, followed by cryoprotection in 30% sucrose solution (in PBS) for three days. The brain hemispheres were then split, embedded in tissue-tek, fast frozen in isopentane and dry ice and stored at –80°C. Coronal brain sections (40 μm-thick) were made in a cryostat between bregma –1.22 mm and bregma –2.54 mm, targeting the dorsal hippocampus according to the stereotaxic coordinates of the mouse brain atlas [24]. The sections were ordered in a systematic and uniformly-random manner (SURS) [25] and left free-floating in a multi-well plate filled with PBS. Polyclonal rabbit anti-Iba1 antibody (1:1000, Wako Chemicals) and mouse anti-Aβ 6E10 antibody (1:1000, Covance) were used as primary antibodies to label microglia and Aβ plaques respectively. The slices were incubated in primary antibody overnight at 4°C. On the following day, the sections were incubated in an appropriate biotinylated secondary antibody (1:600, Sigma) for 2 h at room temperature, followed by ABC kit (Avidin/Biotinylated enzyme Complex Vectastain Elite, Vector) and DAB reaction (3,3′-Diaminobenzidine, Sigma-Aldrich Corporation). The slices were then ordered and mounted on slides, coverslipped with DPX and analyzed in a blind manner using a light microscope (Nikon 80i), with a high-resolution CCD video camera integrated with a computer installed with the Stereo Investigator software (MicroBrightField, Williston, VT, EUA – 11 version).
Immunofluorescence was performed to double-label Aβ plaques and microglia respectively as primary antibodies described above, followed by fluorochrome-conjugated secondary antibody for microglia cells (AlexaFluor 546, 1:600 Invitrogen) and Aβ plaque staining (AlexaFluor 488, 1:600 Invitrogen). Slides were mounted and sealed with DPX and subsequently analyzed by fluorescence microscopy using the Stereo Investigator capture software (MicroBrightField, Williston, VT, EUA – 11 version).
Design-based stereology
The Stereo Investigator software was used for the stereological analysis of each labeling (6E10 or Iba-1). A SURS sequence of slices of the dorsal hippocampus per animal was obtained using the Smooth Fractionator method [25], representing the entire volume of the dorsal hippocampus.
Total number of microglia in the dorsal hippocampus
The Optical Fractionator tool was used to estimate the total number of microglia in the dorsal hippocampus. A z-axis distribution was performed before starting the quantification in order to establish the disector height and determine the Iba-1 staining penetration and cell distribution throughout the thickness of the section. Section thickness was measured in every field of view using the central point of the unbiased counting frame and the disector height used was 13 μm. On average, 14 disectors per session were applied to count approximately 300 microglia. Cell body was defined as the counting unit.
Aβ plaque total volume in the dorsal hippocampus
To estimate the total volume occupied by Aβ plaques in the dorsal hippocampus, the Area Fraction Fractionator tool was used and the entire hippocampal area in each slice was considered.
Estimation of microglial cell distribution
Immunofluorescence images were captured and analyzed with Stereoinvestigator BMF microsystem 11.01.1 software coupled in a Zeiss Imager M.2 with ApoTome.2 microscope for fluorescence and brightfield.
For the microglia distribution analysis, two circumferences with exactly the same size, respecting the size of the plaque and cell layer, were drawn and positioned as follows: 1) in order to count microglia inside and just on the border of the plaque, one circumference was drawn encircling the plaque and positioned just around the plaque (ARN), and 2) to count the microglia in the vicinity but not touching the plaque, the other circumference was positioned adjacent to the selected plaque (ADJ). Each pair of circumferences was designed for all plaques. Cell nuclei stained for Iba-1 contacting the border and inside of both ARN and ADJ circles were counted in the entire hippocampus, using a point-counting method of the StereoInvestigator software. The ratio of ARN or ADJ over the total number (ARN+ADJ) was used to calculate the proportion of microglia present inside and around the plaque and adjacent plaque areas (adapted from Davalos et al., 2005 [26]).
Hippocampal Aβ ELISA and cytokine MilliplexMAP levels analyzes
Mice were anesthetized using ketamine/xylazin and euthanized by decapitation. Brains were removed from the skull and the hippocampus was dissected and kept at –80°C until the procedure. Protein was extracted using RIPA buffer (150 mM NaCl, 1% Triton X-100, 0.5% sodium deoxycolate, 0.1% SDS and 50 mM Tris ph 8.0) with protease inhibitor (Halt Protease and Phosphatase Inhibitor Single-Use Cocktail, Thermo Scientific, USA). Hippocampal samples were diluted 1:3, sonicated, and the solution was frozen and kept at –80°C until use.
ELISA Aβ analyes
β-Amyloid x-42 ELISA Kit (TMB) (Biolegend) was used and standard, incubation buffer, wash buffer, standard curve, and sample were diluted according to the manufacturer’s directions. Subsequently, 50 μl of standard or sample and 50 μl of detection antibody were added to the appropriate plate, the plate was covered to be incubated overnight at 2–8°C. On the following day, the content was removed, 200 μL of TMB substrate was added to each well and incubated for 50 min. The plate was then read at 620 nm. Individual values were corrected by total protein concentrations obtained from a Bradford protein assay performed later.
MilliplexMAP cytokine analyses
For this analysis, the MCYTOMAG-70K kit (Merck Millipore) with IL-1α, IL-4, IL6, and IL-10 cytokines was used. Into the appropriate wells, 25 μl of standard or control, 25 μl of assay buffer, 25 μl of matrix solution, 25 μl of sample, and 25 μl of beads were added and incubated overnight at 2–8°C. On the following day, the plate content was removed, 25 μl of detection antibody was added into each well and the plate was covered and incubated for 1 h at room temperature. Subsequently, 25 μL of streptavidin-phycoerythrin was added and incubated in a shaker for 30 min. The content of the wells was removed, 150 μL of sheath fluid was added to all wells, and the plate was run on MAGPIX with xPOTENT software. Individual values were corrected by total protein concentrations obtained from a Bradford protein assay performed later.
Statistical analysis
The precision of a stereological estimate was expressed as a coefficient of error (CE) calculated as described elsewhere [27]. The mean coefficient of error calculated for the total number of microglia and plaques was 0.06.
The Kolmogorov-Smirnov (KS) test was applied to verify normality of the data. The KS test was negative for all samples, so the differences between groups were assessed by using the Kruskal-Wallis test followed by the Dunn-Sidak post-hoc test for multiple comparisons; except for microglial cell distribution around Aβ plaques in hippocampus where the KS test was positive on their gaussian origin and, hence, it was used the two-way ANOVA test, followed by the Tukey-Kramer post-hoc test. For two-sample comparisons, we used the Mann-Whitney test. Spearman coefficients were calculated to estimate non-parametric correlations between samples.
In order to highlight global differences and similarities, considering multivariate effects of the inflammatory reactions and behaviors exhibited, between the four groups (WT, APP/PS1, WT+RE, and APP/PS1+RE), we applied two multifactorial analyzes: PCA (principal component analysis) and Clustergram (with Euclidian distance).
For the histological statistical analysis, PCA features were considered to be the sample set of interleukins and microglia to explain the covariations between the four groups. For the statistical analysis of the behaviors, PCA features were considered to be the two samples set of ‘total locomotion’ and ‘rearing’ to explain the covariations among the four groups. In the Clustergram analysis, the same variable structures employed in the PCA analysis were used and the Euclidian distance was adopted to evaluate the similarities between features and factors. For the Clustergram procedures, each column was z-scored independently.
The significance level for all statistical analyses was established considering α= 0.05. All statistical tests were performed using MATLAB® software (v. R2016a).
RESULTS
APP/PS1 mice showed increased exploratory activity and RE was able to restore this hyperactivity to control levels
In order to analyze locomotor activity, mice were tested in the Open Field (OF) task. The group test for total locomotion (total number of entrances into any floor unit) revealed that APP/PS1 mice showed a significant increase in locomotor activity when compared with Wild Type groups (WT and WT+RE) (H = 21.63; p = 0.00077; Dunn-Sidak G :1-3,2-3, p = 0.00001, p = 0.021, Fig. 1A). The statistical analysis also revealed that APP/PS1 animals presented a significant increase in rearing activity when compared with the APP/PS1+RE group (H = 11.72; p = 0.00838; Dunn-Sidak G :3-4, p = 0.0041, Fig. 1B), indicating that the APP/PS1 genotype may induce hyperactivity effects, and that RE was able to restore these effects to control levels. The WT, WT+RE, and APP/PS1+RE groups showed similar rates of total locomotor and rearing activities in the OF test.
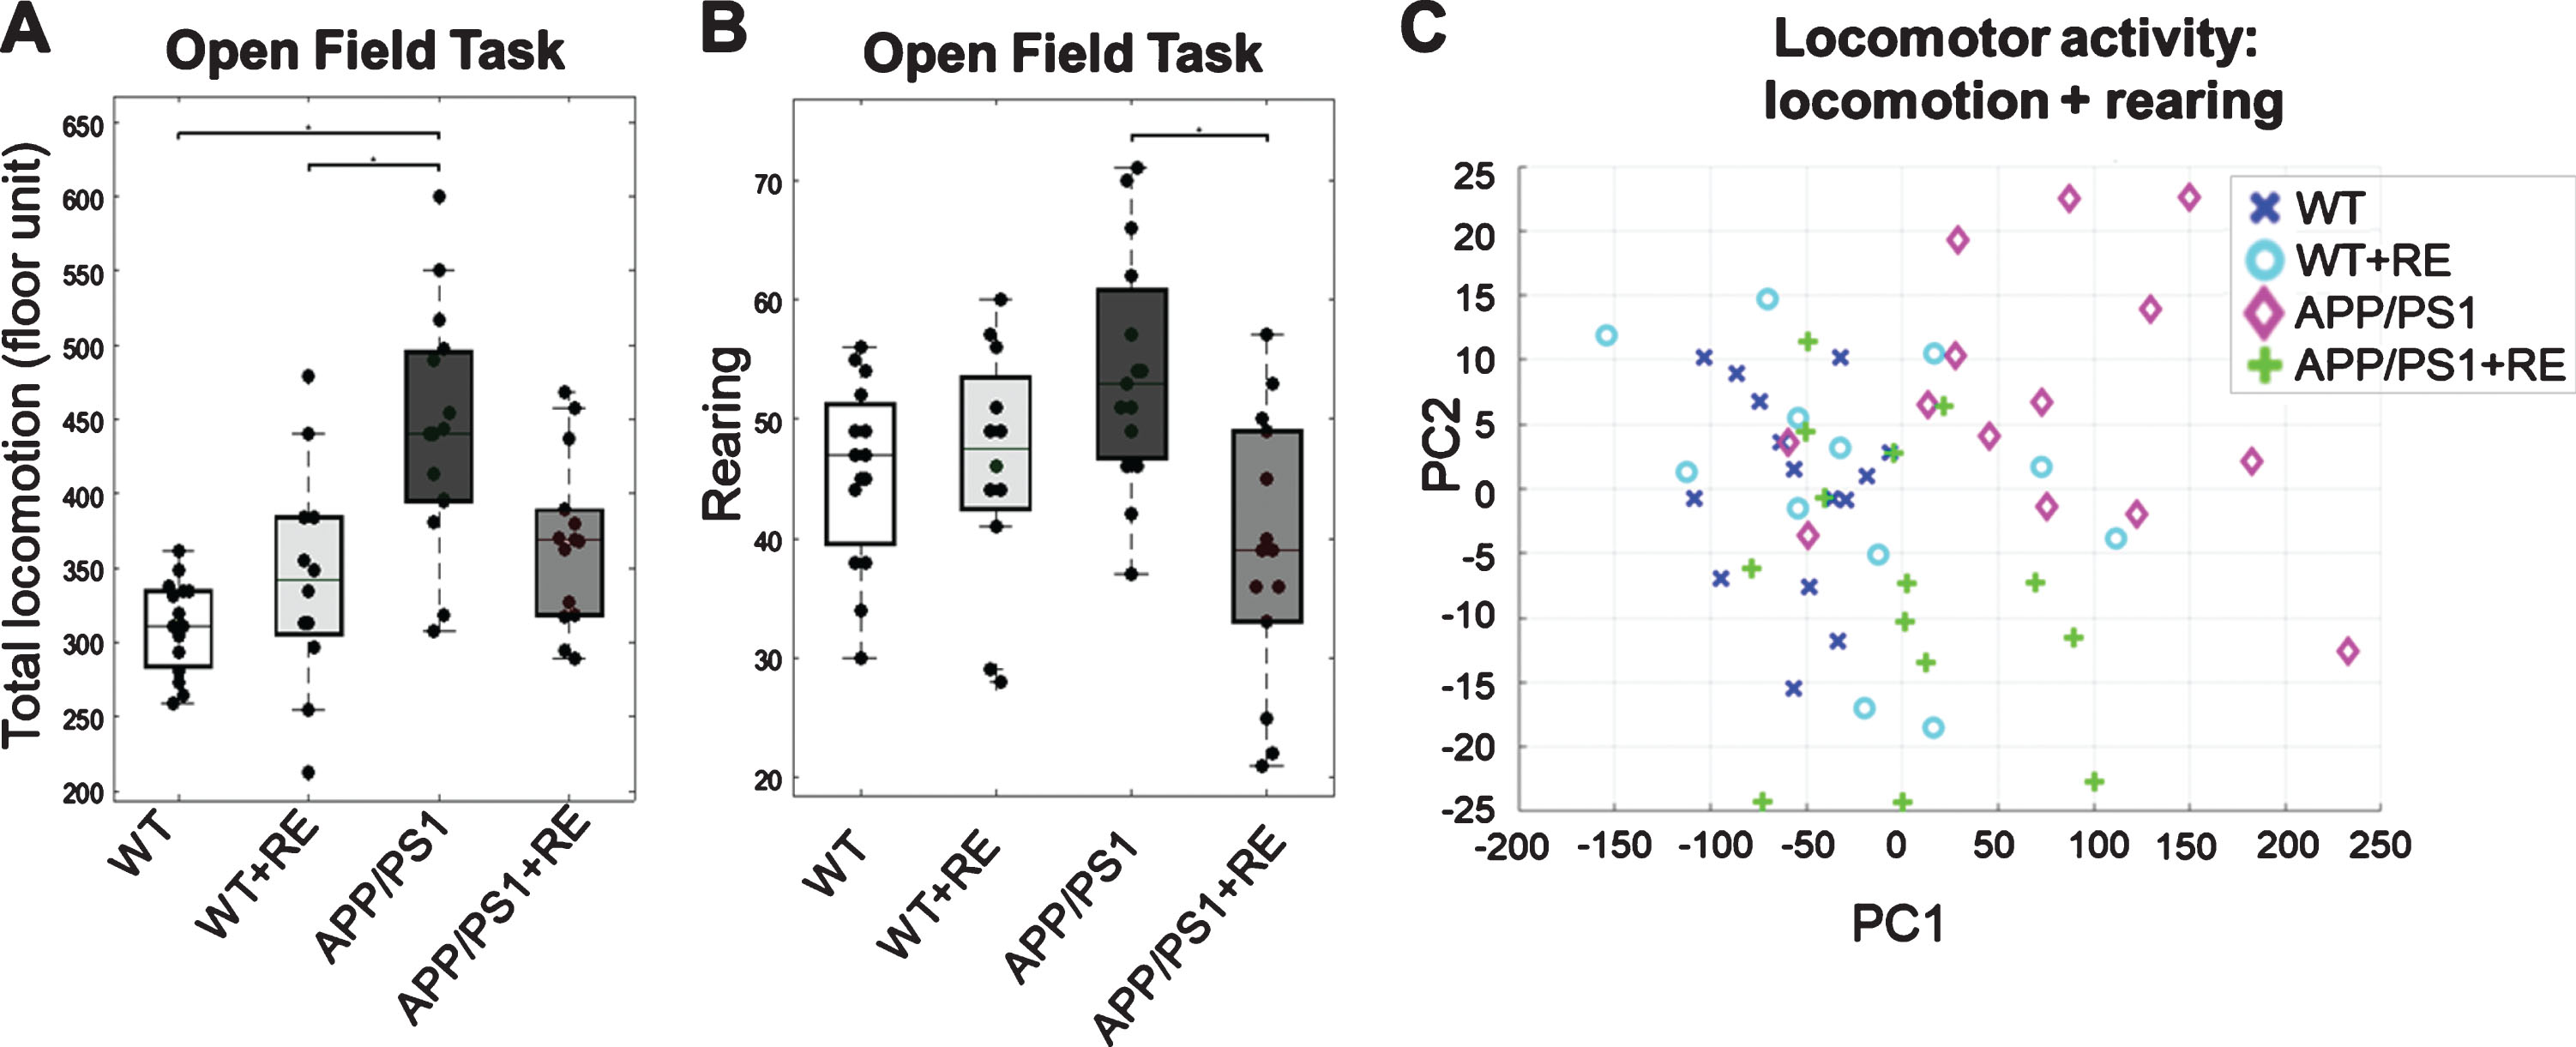
Open Field test analyses comparing the 4 groups. A) Total locomotion analysis showed hyperactivity in the APP/PS1 group (n = 15) compared with WT (n = 15) and WT+RE (n = 12) groups (p = 0.00077). B) Rearing analysis showed increased rearing behavior in the APP/PS1 group compared with the APP/PS1+RE group (n = 14) (p = 0.0083878). C) Open Field activities were used as PCA features to explain scatter patterns and covariances between animal conditions. PCA analysis considering total locomotion and rearing as features showed cluster distinction mainly between WT, WT+RE, and APP/PS1+RE groups with a prominent separation of the APP/PS1 group, corroborating the hypothesis test results.
Figure 1C shows a clustering analysis with PCA, taking ‘total locomotion’ and ‘rearing’ behaviors as PCA features to explain the covariances between animal conditions. First, it shows that the APP/PS1 condition is totally different from the other groups, with high intergroup covariance. Secondly, corroborating the hypothesis tests, it also shows that WT and WT+RE are more self-similar groups, totally distinct from APP/PS1; while APP/PS1+RE spans between the two.
RE reduced the volume of Aβ plaques but not Aβ peptide in the hippocampus of APP/PS1 mice
To investigate whether RE could interfere with the Aβ pathology of AD, we examined Aβ plaque immunohistochemistry (6E10) and Aβ peptide (ELISA) in the hippocampus of APP/PS1 mice (Fig. 2A, B). This analysis revealed a significant reduction in Aβ plaque volume in the hippocampus of the APP/PS1+RE group compared with the APP/PS1 group (U = 57, p = 0.0021645; Fig. 2C). The concentration of Aβ42 peptide in hippocampal tissue was quantified by ELISA for both groups and no difference was detected (U = 42, p = 0.2086; Fig. 2D).
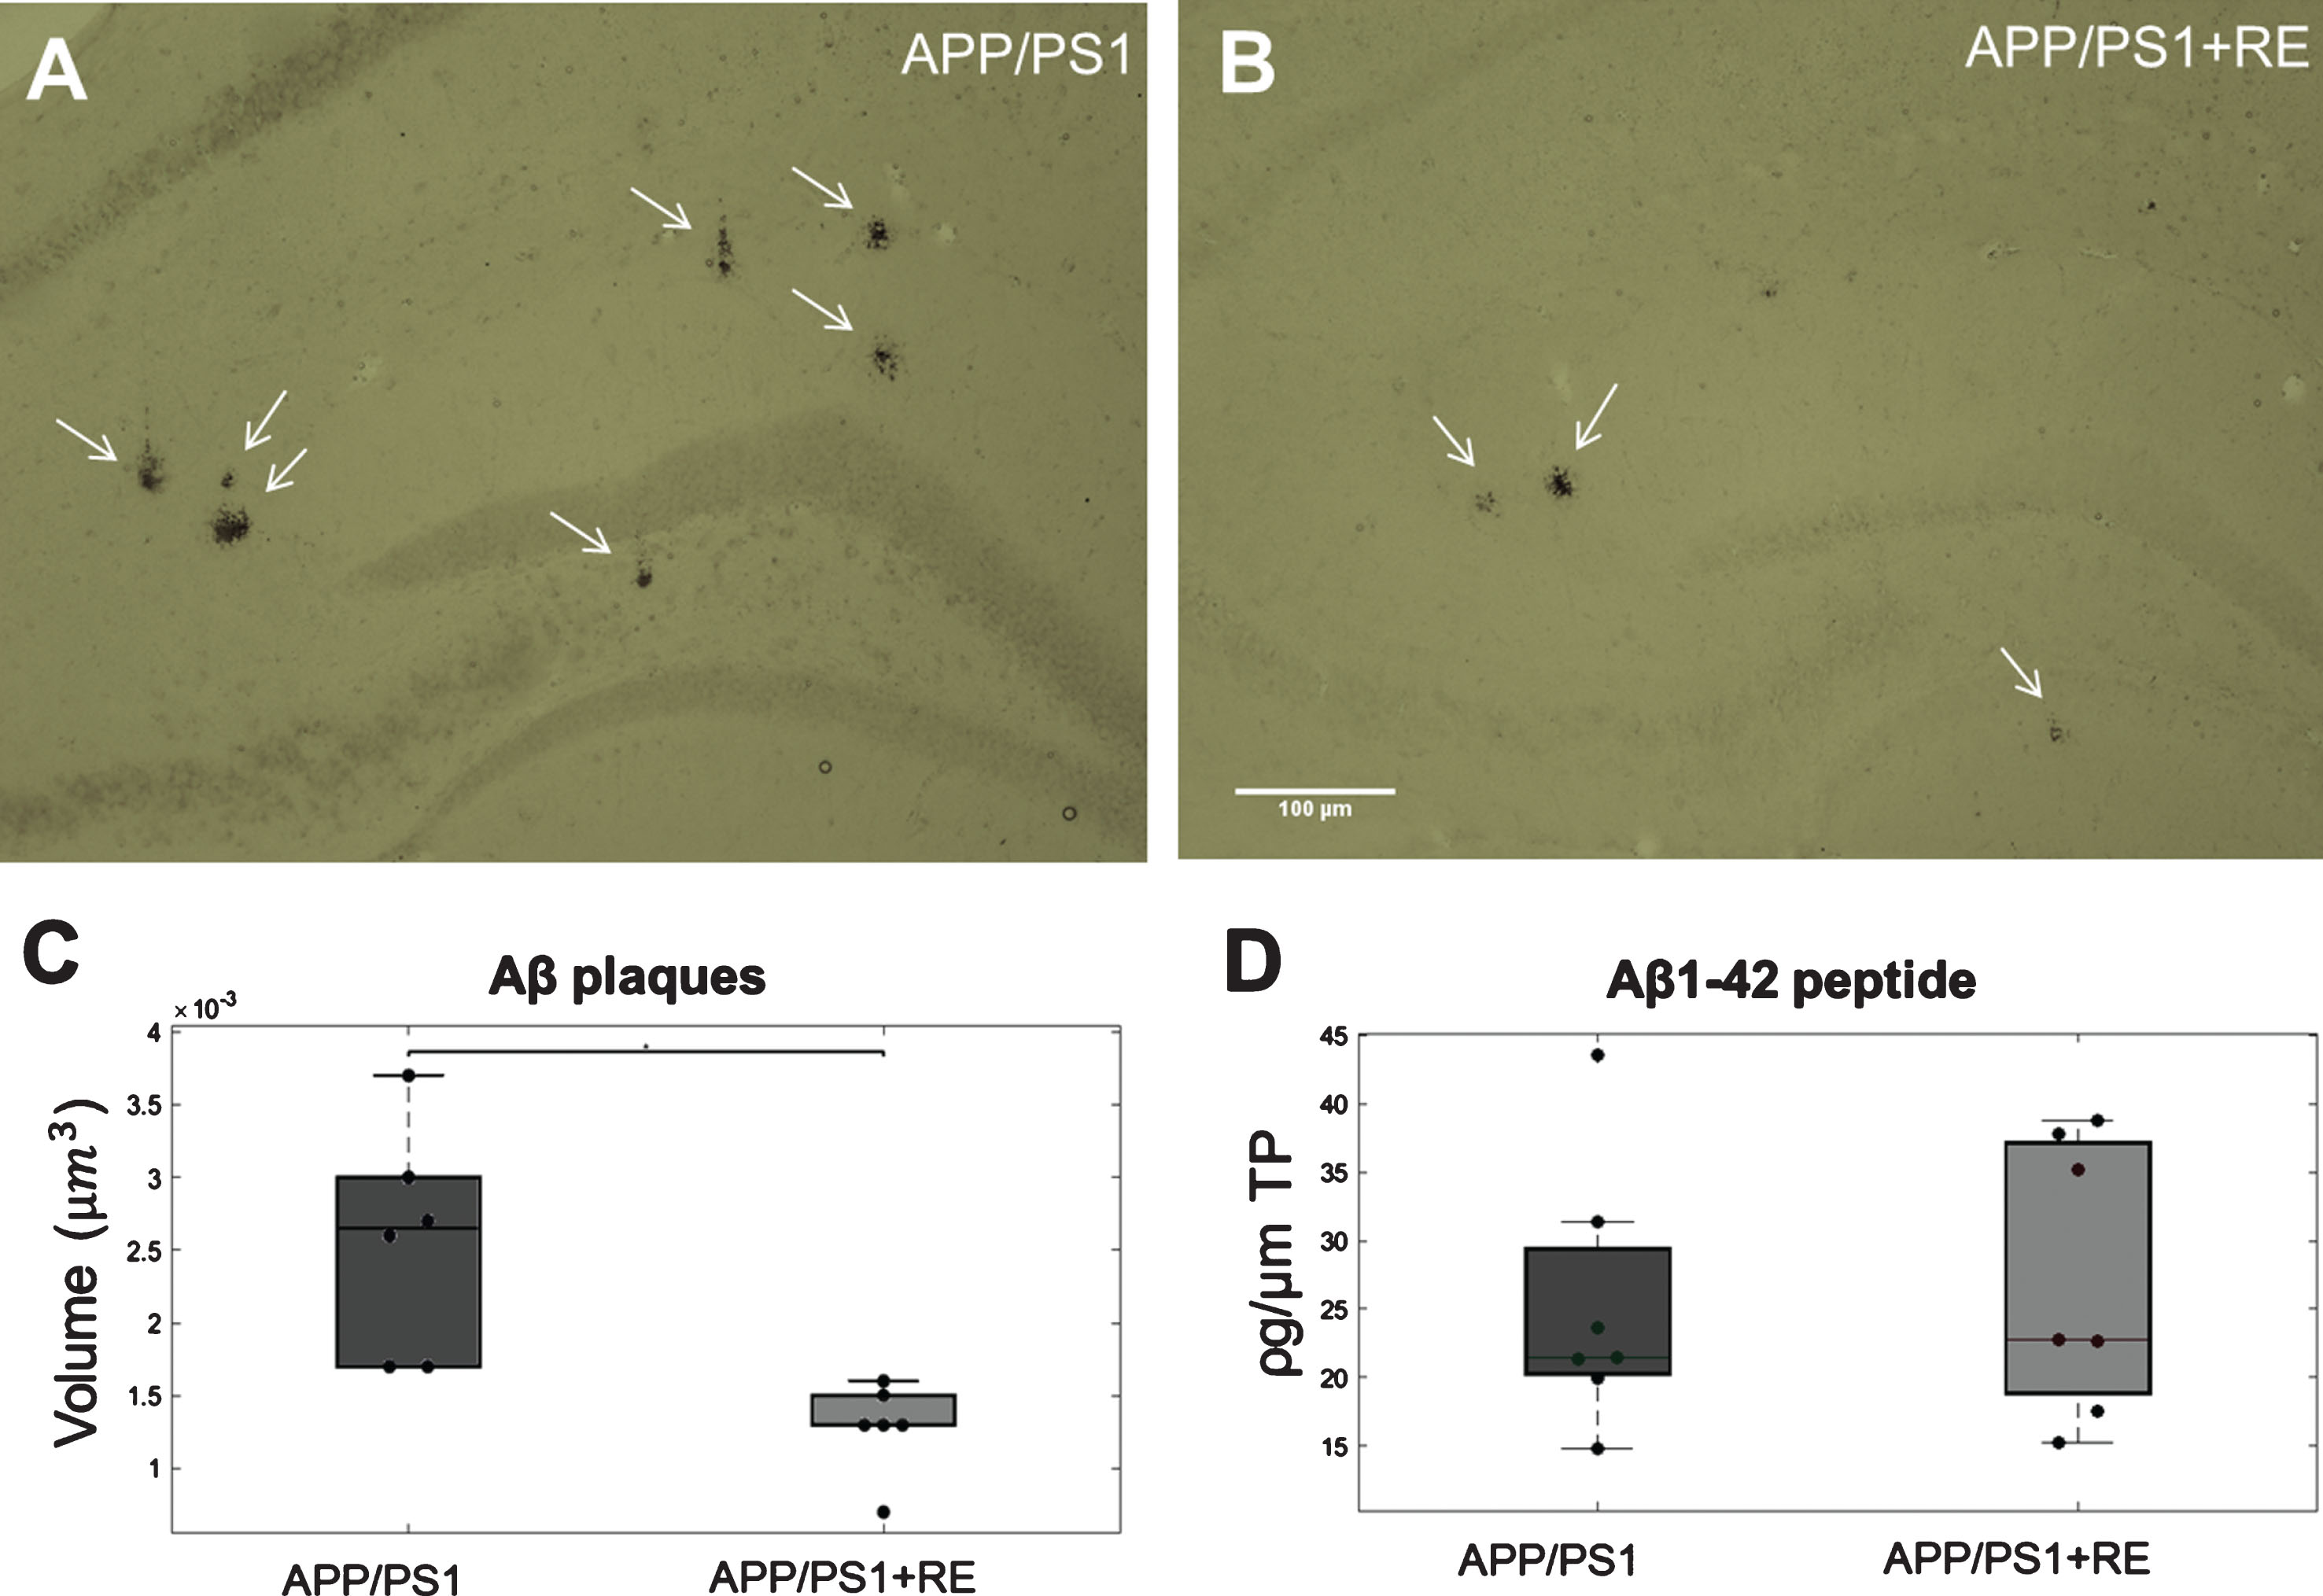
Photomicrographs showing representative sections of Aβ plaques formed in APP/PS1 mice. Aβ plaques stained in the hippocampus of APP/PS1 mice from both APP/PS1 (A) and APP/PS1+RE (B) groups (scale bar = 100 μm). C) Hippocampal Aβ plaque volume quantified by 6E10 marker comparing the two APP/PS1 groups, APP/PS1 (n = 5) and APP/PS1+RE (n = 5) by stereological analysis (p = 0.0022). D) Aβ1-42 peptide quantification by ELISA essay of the hippocampus of the two APP/PS1 groups: APP/PS1 (n = 7) and APP/PS1+RE (n = 7) (p = 0.2086).
RE modulates the recruitment of hippocampal microglia depending on animal genotype
The quantification of the microglia population in the hippocampus was performed by counting Iba-1 positive cells, specifically expressed in macrophages/microglia (Fig. 3A–D). Although group comparison revealed no significant difference in quantification of Iba-1 hippocampal cells between genotypes or treated and non-treated groups, a significant difference was found between the APP/PS1+RE group and WT+RE group (K = 16.28, p = 0.0039; Dunn-Sidak G :2-4, p = 0.0004; Fig. 3E).
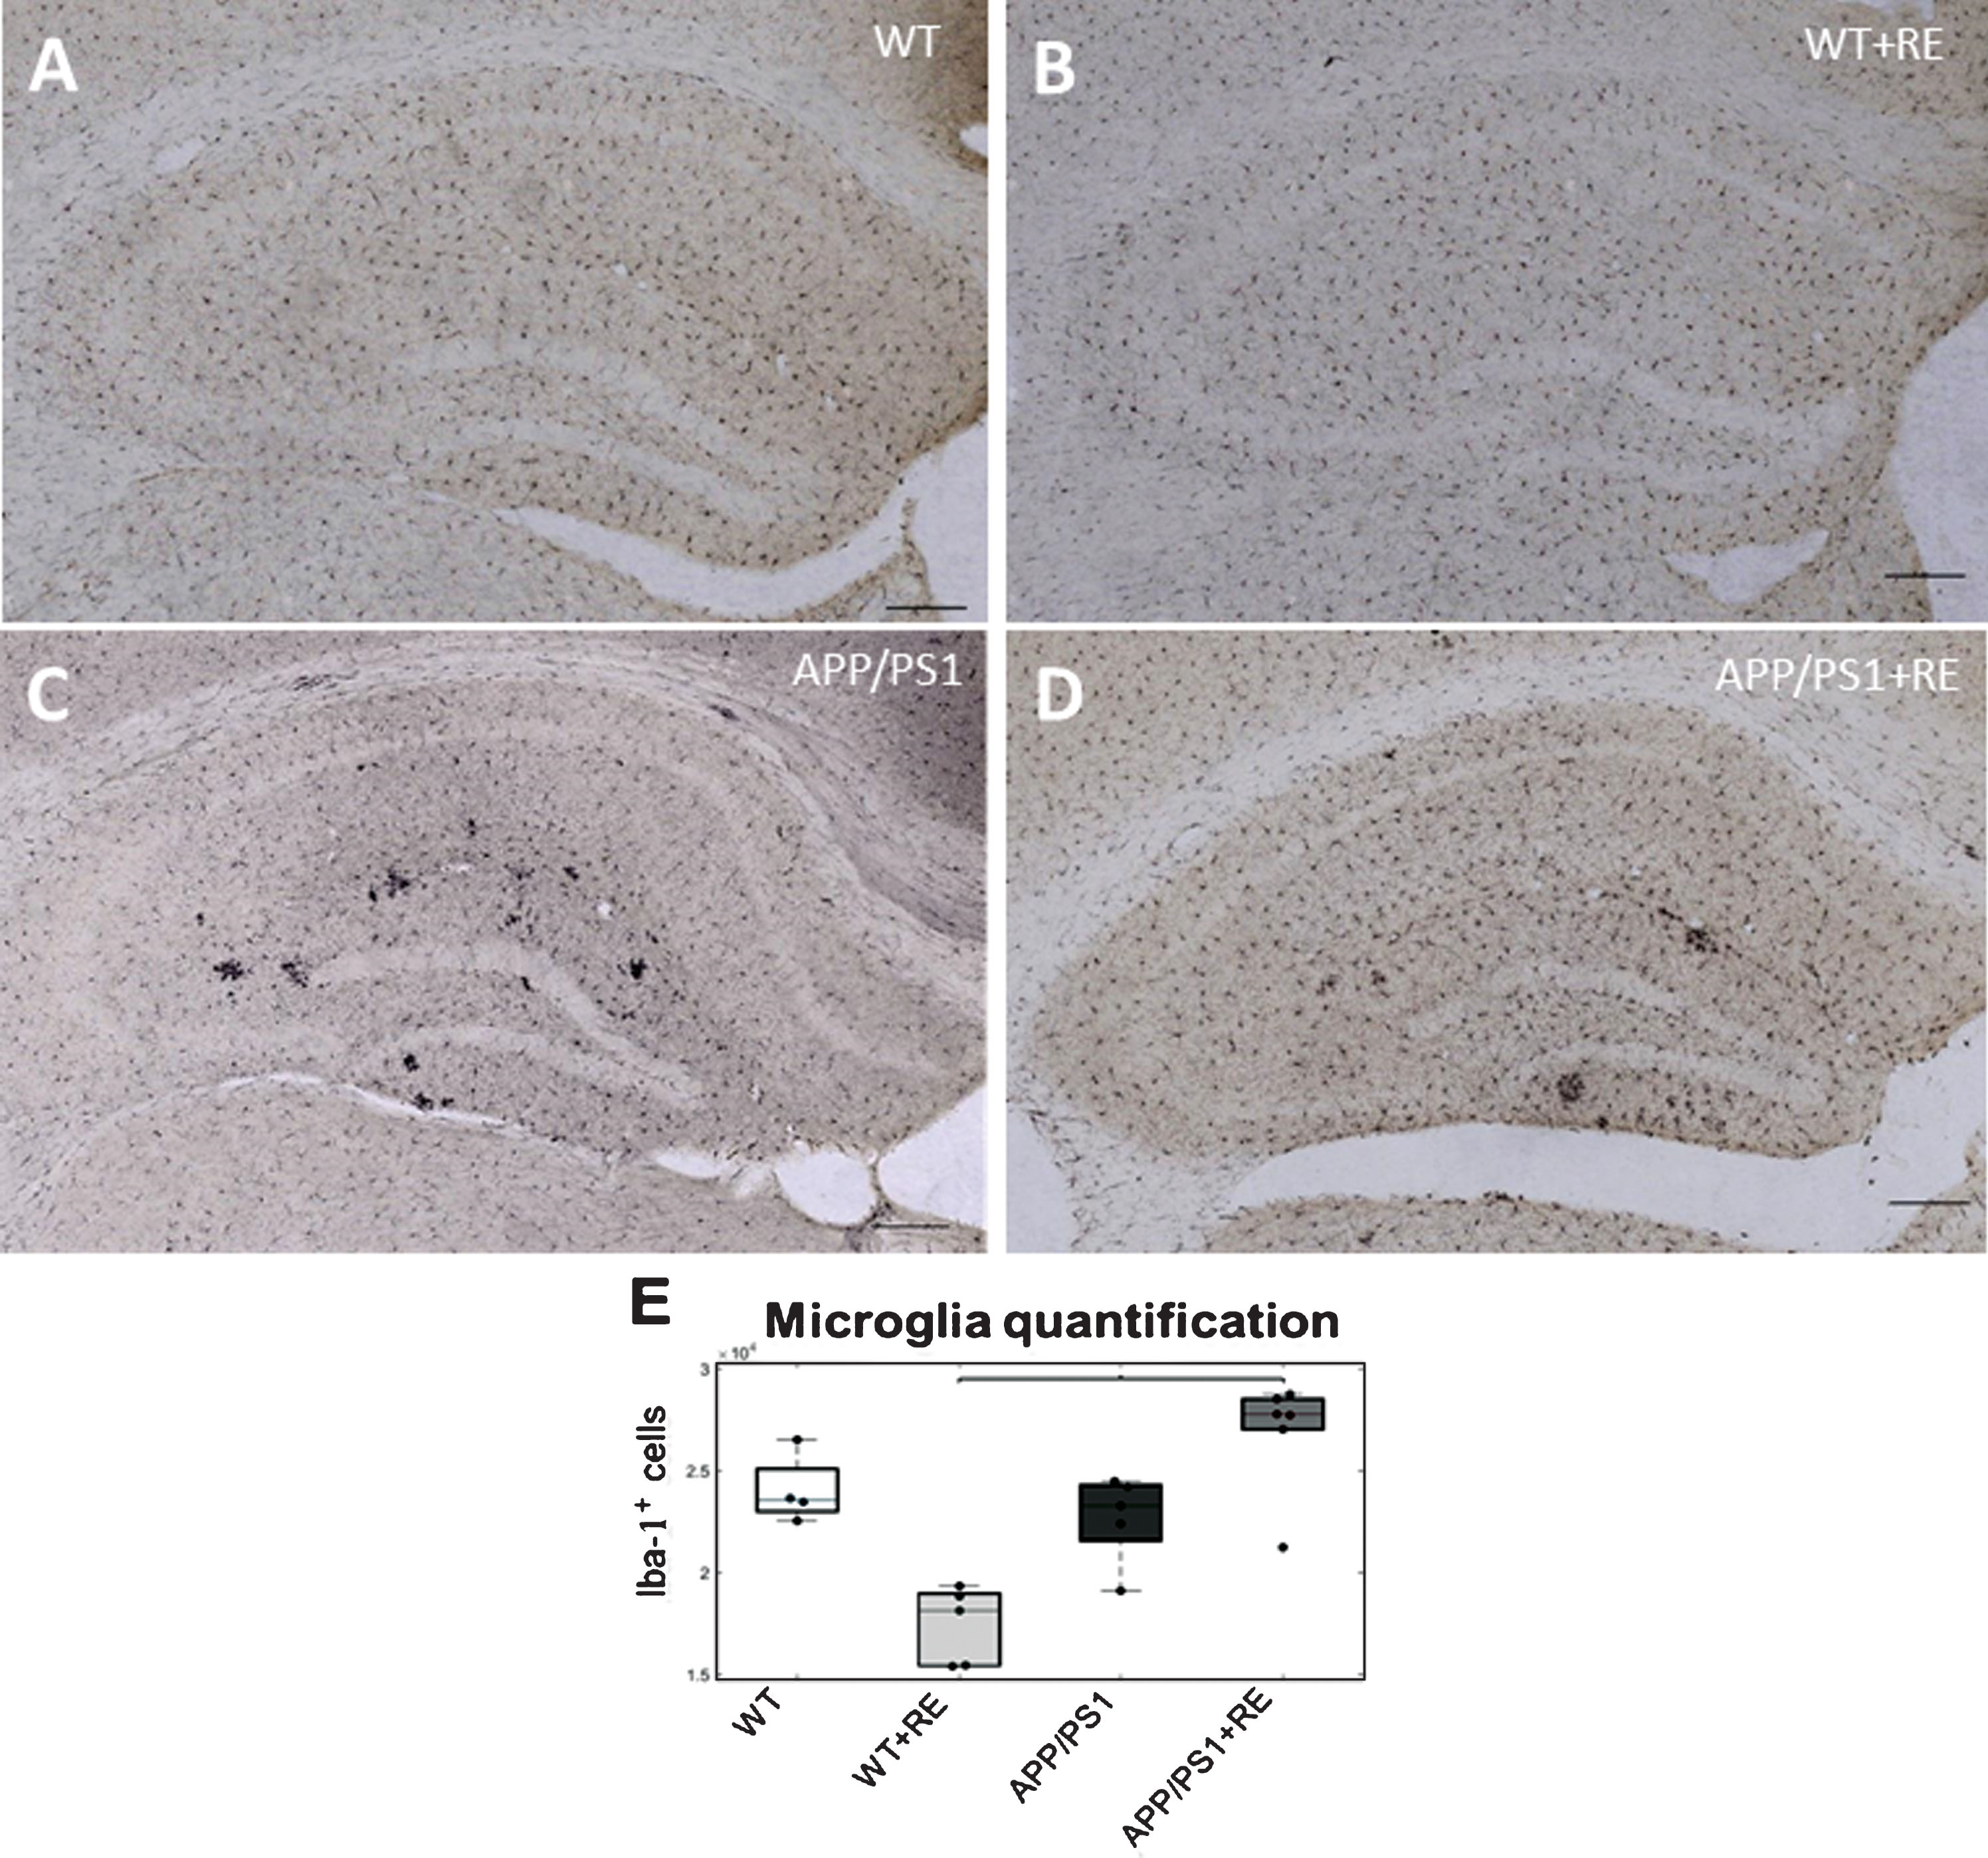
Photomicrographs of immunohistochemistry for Iba-1+ cell stained in the hippocampus of the four groups, WT (A), WT+RE (B), APP/PS1 (C), and APP/PS1+RE (D). Note the different distribution of Iba1+ cells in a control WT animal submitted to RE (B) compared with APP/PS1 animals submitted to RE (D) (scale bar = 100 μm). E) Microglia quantification by stereological analysis of Iba-1 staining cells in the hippocampus, WT (n = 5), WT+RE (n = 5), APP/PS1 (n = 5); APP/PS1+RE (n = 6) (Kruskal Wallis p = 0.0039711 between APP/PS1+RE and WT+RE).
A function of microglial cells is to clear the Aβ protein, so the location of microglia relative to the amyloid plaques was analyzed with immunofluorescence for double-staining of Iba-1 and Aβ1-16 (6E10) antibodies (Fig. 4A–E). This analysis revealed distinct patterns of microglial cell distribution throughout the hippocampus considering both, around Aβ plaques (ARN) and in the adjacent area of the plaques (ADJ) (Fig. 4G). In both APP/PS1 groups, higher percentage of Iba-1 positive cells was found around the plaques compared with adjacent area (F[APP/S1]*[APP/S1+RE] = 18.46, p = 3.12×10⁻⁵, F[ARN]*[ADJ] = 39.99, p = 2.81×10⁻⁹, two-way ANOVA, where ARN and ADJ were considered as factors; Tukey-Kramer G :1-2 , G :1-3 , p = 0.00014, p = 0.0148, and Tukey-Kramer G :2-4 , G :3-4 , p = 0.00012, p = 0.0176). When the number of Iba-1 cells around plaques was compared between the two groups, the APP/PS1+RE group showed significant lower percentage of cells. Interestingly, APP/PS1+RE presented more Iba-1 cells in the adjacent areas of plaques compared with APP/PS1, which is in agreement with the quantification of microglia shown by stereology method.

Photomicrography of immunofluorescence of Aβ plaques (6E10, green) surrounded by microglia (Iba-1, red), and double-stained (microglia and plaques) shown in merge images (C and F), in the hippocampus of an APP/PS1 mouse (A–C), and an APP/PS1+RE mouse (D–F). Scale bar = 100 μm. In G, estimation of microglia distribution of Iba-1 staining cells in the hippocampus of APP/PS1 (dark gray) and APP/PS1+RE (light gray) animal, quantified in two different areas in relation to Aβ plaques, defined as around plaque (ARN) (black striped bars), and adjacent region (ADJ) (no striped bars) (adapted from [26]), significant differences between groups are indicated by keys on top (F[APP/S1]*[APP/S1+RE] = 18.46, p = 3.12×10⁻⁵, F[ARN]*[ADJ] = 39.99, p = 2.81×10⁻⁹, two-way ANOVA, where ARN and ADJ were considered as factors; Tukey-Kramer G :1-2 , G :1-3 , p = 0.00014, p = 0.0148, Tukey-Kramer G :2-3 , G :3-4 , p = 0.00012, p = 0.0176).
RE altered levels of inflammatory cytokines in APP/PS1
To investigate the mechanisms by which a resistance exercise program (RE) resulted in a modulation of inflammatory response, we quantified the levels of cytokines IL-1α, IL-6, IL-4, and IL-10 in hippocampal samples using the MilliplexMAP analysis.
The statistic group test indicated that levels of IL-1α were increased in the APP/PS1 group compared with APP/PS1+RE and with WT (H = 14.29, p = 0.0025, Dunn-Sidak G :1-3,3-4, p = 0.0043, p = 0.017; Fig. 5A). Furthermore, significant differences was detected for IL-6 (H = 10.219, p = 0.016; Dunn-Sidak G :1-3,3-4, p = 0.048, p = 0.029) and IL-4 (H = 9.158, p = 0.027; Dunn-Sidak G :1-3,3-4, p = 0.037, p = 0.0099) indicating an increase in hippocampal levels of IL-6 and IL-4 in the APP/PS1 group compared with APP/PS1+RE and with WT, suggesting that RE was able to restore cytokine levels to control levels (Fig. 5B, C). Although higher IL-10 levels were detected in WT+RE, no significant difference was found between groups (H = 7.758, p = 0.05128; Fig. 5D).
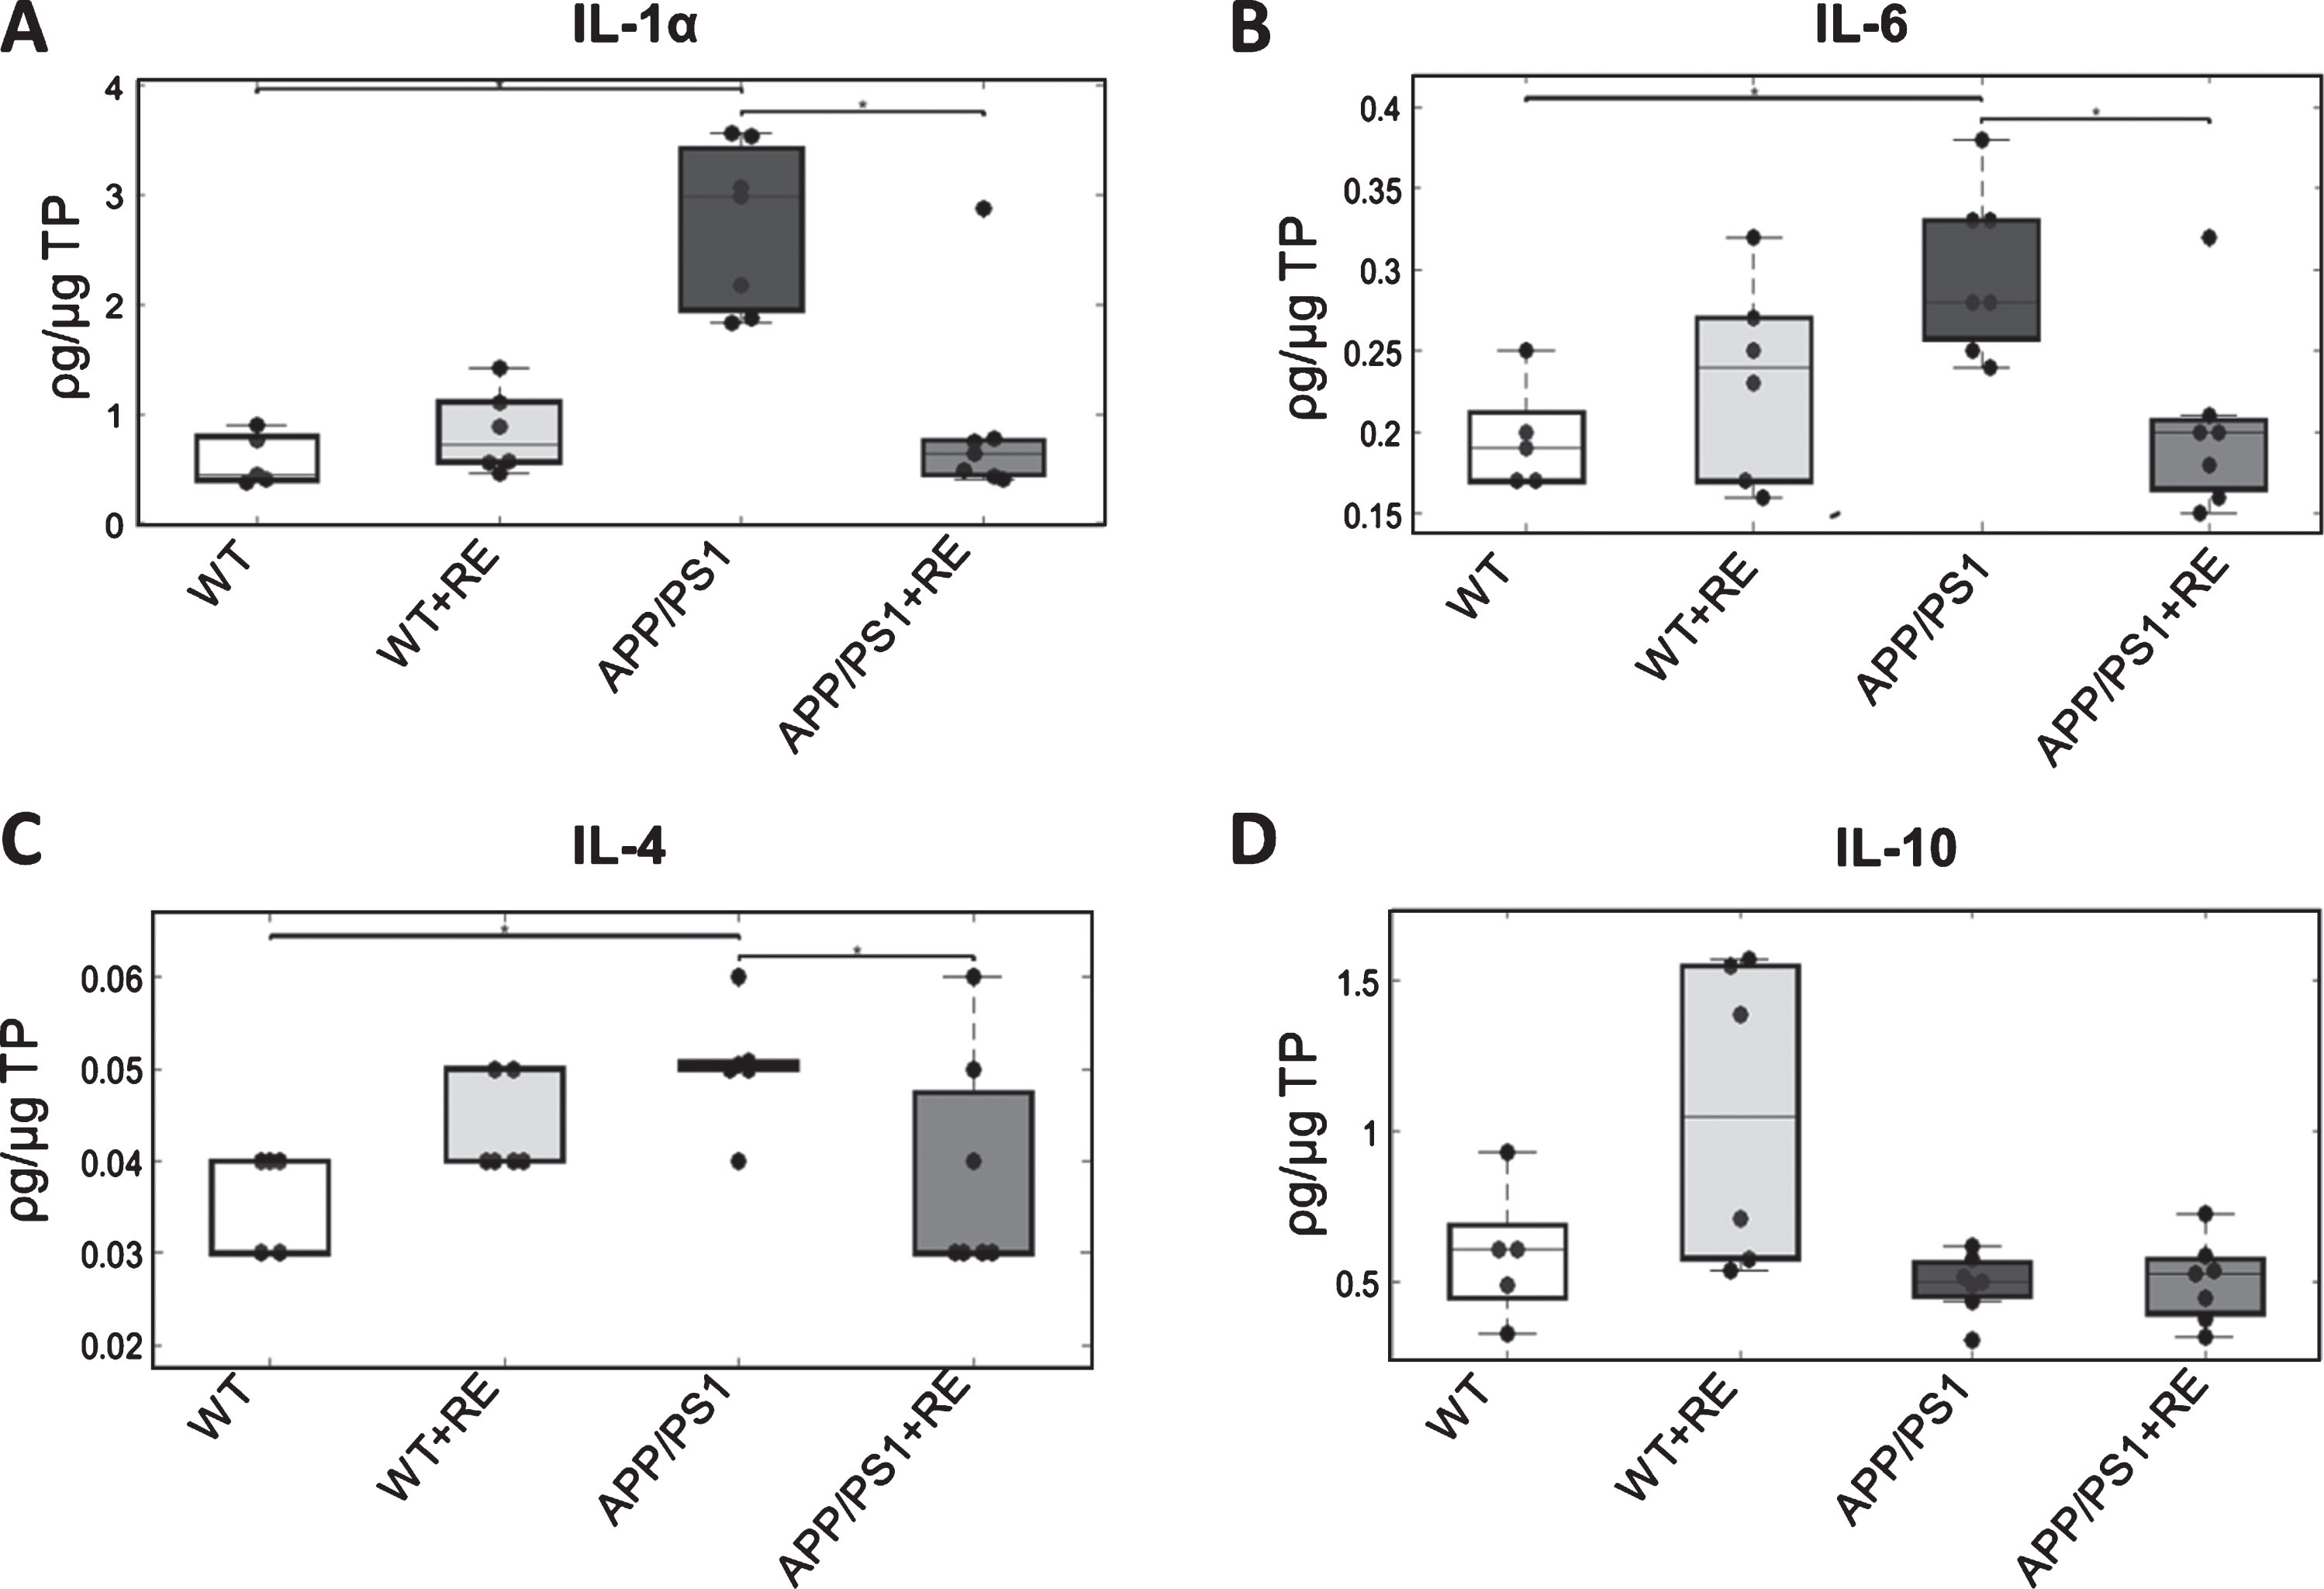
Cytokine ELISA essay of hippocampal tissue of WT (n = 5), WT+RE (n = 6), APP/PS1 (n = 7), and APP/PS1+RE (n = 7). A) IL-1α cytokine levels increased in the APP/PS1 group compared with WT and APP/PS1+RE groups (p = 0.0025347). B) Cytokine levels of IL-6 increased in the APP/PS1 group compared with WT and APP/PS1+RE groups (p = 0.016789). C) The APP/PS1 group showed increased levels of IL-4 compared with WT and APP/PS1+RE groups (p = 0.017196). D) The ELISA essay showed no difference in IL-10 cytokine levels between groups (p = 0.05128).
In order to evaluate positive and negative correlation trends between interleukin samples, the Spearman coefficient was calculated for WT between APP/PS1, WT+RE, and APP/PS1+RE (blue and green dots) and WT+RE between WT, APP/PS1, and APP/PS1+RE (red dots) (Fig. 6A). The results show positive trends for correlations of Iba1 cells between WT and WT+RE groups and between WT and APP/PS1+RE groups, and a negative correlation trend was found between WT and APP/PS1 groups (blue). The same patterns were observed for interleukins IL-1a with positive correlation trends between WT and WT+RE groups, and between WT and APP/PS1+RE groups (green), and a negative trend between WT and APP/PS1. Therefore, all correlation coefficients suffer an inversion and a decrease in magnitude when correlated with the APP/PS1 group, and all groups suffer a positive magnitude increase when compared with APP/PS1+RE. In the main, interleukin IL-1α exhibits higher correlation amplitude between WT and APP/PS1+RE, followed by WT+RE and APP/PS1+RE (green).
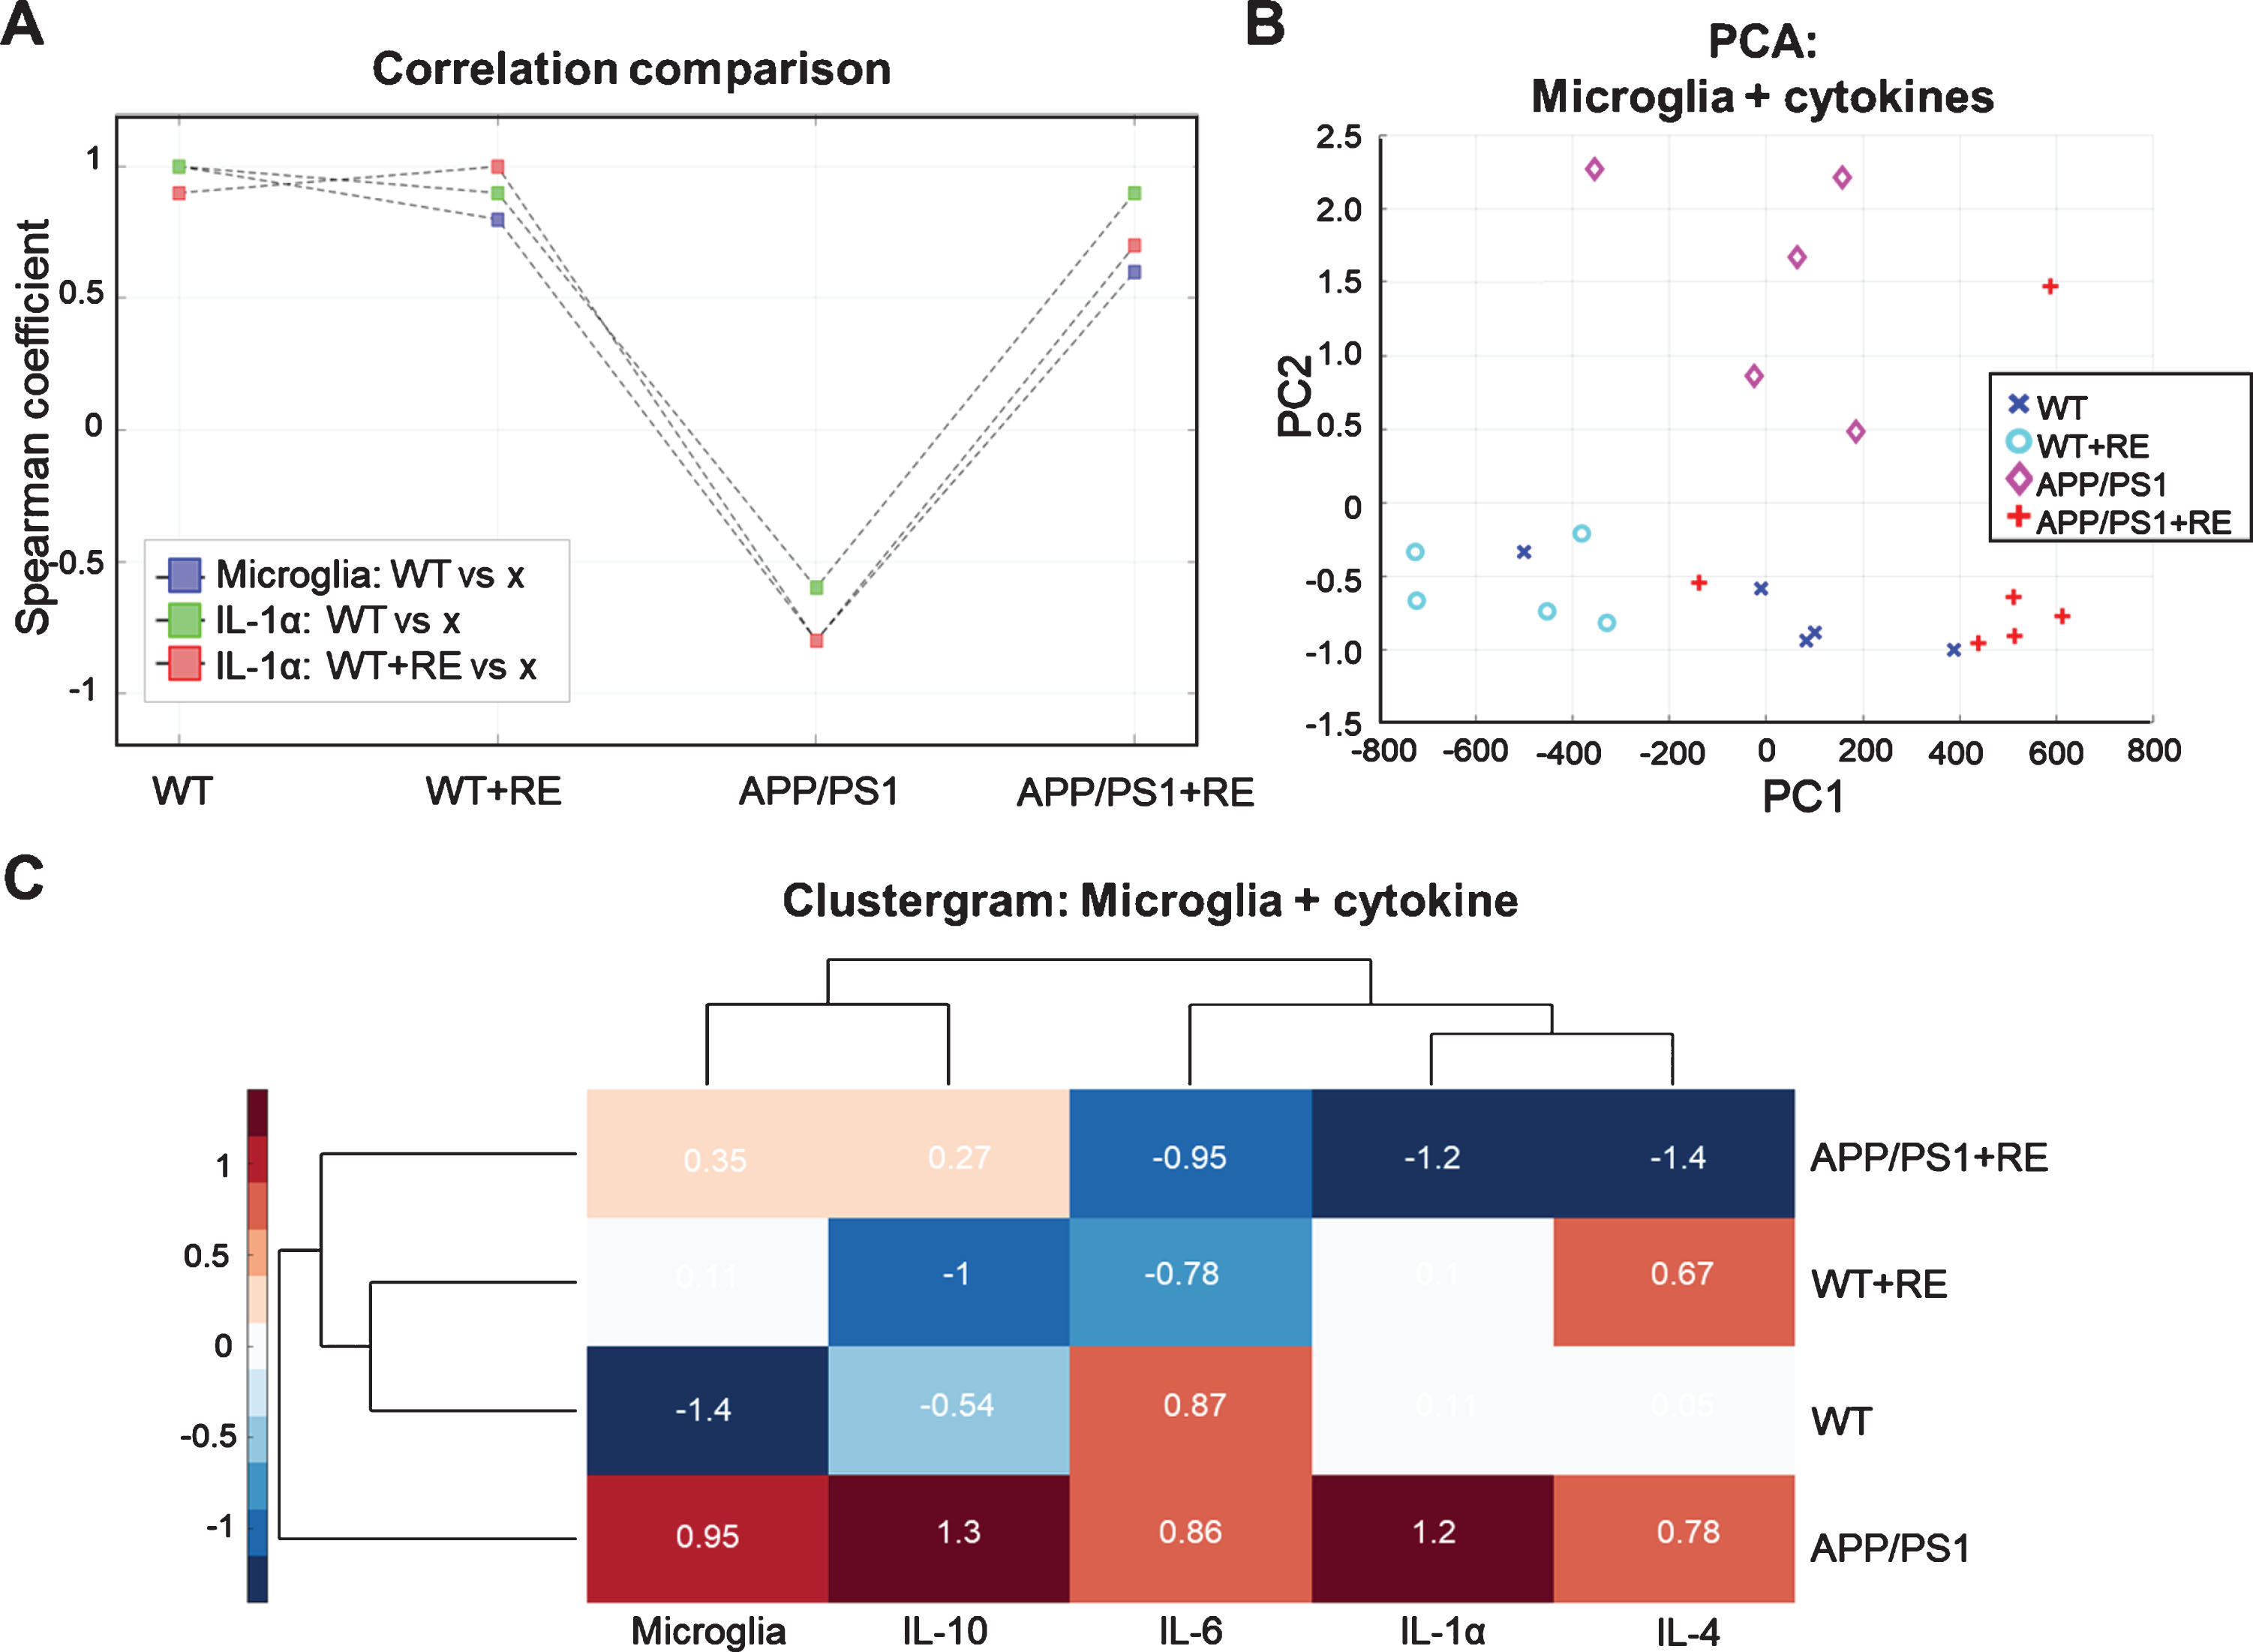
Correlation multivariate analysis. A) Comparison among Spearman coefficients considering Microglia WT (blue), IL-1α WT (green), and IL-1α WT+RE (red) conditions against WT, WT+RE, APP/PS1, and APP/PS1+RE conditions. For all conditions there were a high decreasing of correlations when compared with APP/PS1, but a recover in correlation indexes when exercise was introduced APP/PS1+RE. B) Using microglia and all the cytokines (IL-1α, IL-4, IL6 and IL10) as PCA features there appears a grouping among all conditions showing a high intergroup similarity, with a clear separation of APP/PS1 from the others. C) Clustergram analyses, corroborates the PCA results highlighting the differences in the APP/PS1 condition compared with the other groups and emphasizing the similarities between WT and APP/PS1+RE groups. It shows the similar effects from microglia and IL-10 and the similar effects from the other cytokines, IL-1α, IL-4, and IL6.
For multivariate comparisons the principal component analysis (PCA) and clustergram were applied in order to visualize scatter patterns and clusters of self-similar data (Fig. 6B, C). Figure 6B shows that all four conditions (WT, WT+RE, APP/PS1, and APP/PS1+RE) are self-grouped and well discriminated if microglia and all interleukins are considered as PCA features. In particular, WT and APP/PS1+RE conditions exhibit higher self-similarity than the other conditions. Surprisingly, the APP/PS1 condition is an isolated group and can be discerned only in the second component. Figure 6C shows all interleukins (IL-1α, IL-4, IL-6, IL-10) and Iba1+ cells used as features for the cluster analysis. It corroborates that WT and WT+RE are more similar and that APP/PS1+RE is closer to these groups, while APP/PS1 is a totally distinct group. Furthermore, it also shows that IL-10 and lba1+ cells have a similar contribution that is a part from IL-1α and IL-4 with IL-6.
DISCUSSION
This study investigated the effects of a resistance exercise (RE) program on neurodegenerative processes related to AD. Our results show that RE helps to decrease behavioral hyperactivity, decrease hippocampal Aβ plaque volume, and increase hippocampal microglial recruitment in APP/PS1 mice, as well as maintain hippocampal cytokines at control levels. Several studies have shown benefits of exercise in AD, both in humans and animal models. Interestingly, some of these studies focus on weight loss promoted by physical exercise as a preventive treatment, since obesity can be considered a risk factor [28]. Nevertheless, other studies have observed that body weight loss is present in the most advanced stages of AD patients [29–32]. In experimental studies, García-Mesa et al. [33] showed that aerobic exercise exerted beneficial effects on the behavioral profile of 3xTg-AD mice between 4 and 7 months old and exercise lowered the body weight of 3xTg-AD mice compared to that of WT. When considering RE program, in our study no significant difference was detected in body weight (data not shown). However, when measuring muscle mass Cassilhas et al. [22] found hypertrophy in healthy rats. Whether this RE program would modify the muscle mass in AD transgenic mice models is still unclear.
The OF task was performed here in order to exclude any possibility of a locomotor deficit in the animals. No locomotion limitation was detected in these animals, in fact increased exploratory activity in APP/PS1 mice was detected when compared with control animals, corroborating studies suggesting that APPSWE/PS1dE9 mice with a background in C57BL/6 manifest hyperlocomotion [34–36]. Interestingly, our results show that the exploratory activity in the OF task was restored to control levels in the APP/PS1 group submitted to a RE program.
RE has been related to physical and brain structure preservations as well as cognition functions in healthy elderly, but the neurobiological mechanism is not fully understood [37]. As reviewed by Herold et al. [37], RE promotes an increase of the cortical thickness multiple sclerosis patients [38], and in older adults with mild cognitive impairment, RE increases activation in the right lingual gyrus in occipital lobe that correlates positively with memory performance [39]. An animal study with an exercise program similar to ours found that RE increased systemic and hippocampal IGF-1 [22]. In fact, RE has been suggested to increase IGF-1 in both humans and animals, which in turn crosses the blood-brain barrier and seems to be related to neurogenic processes [14, 40].
In fact, APP/PS1 mice submitted to the RE program presented a reduction of Aβ plaque volume but unchanged Aβ1-42 peptide. Recent studies using different types of exercise, duration, and intensity and at different stages of the disease have consistently demonstrated an inverse correlation between exercise and amyloid burden [41–44]. Although the majority of these studies utilize aerobic activities, the RE program applied here showed the same effect in reducing Aβ plaque load observed in the tissue. However, Aβ peptide load quantified by ELISA was not altered in APP/PS1 mice submitted to the RE program.
With regard to the divergent results for Aβ peptide between the above studies and ours, we believe that aerobic exercise and RE can elicit similar benefits through distinct mechanisms and with different response windows. Together, these data indicate that the benefits of exercise in AD pathology may be exercise-type and disease-stage dependent. After reviewing the literature, different methods of physical exercise have been proposed to have effects on cognitive function, hippocampal neurogenesis and inflammation in AD mouse models [45]. The study from Ke et al. [46] evaluates the effects of a nonshock treadmill exercise paradigm in adult and aged APP/PS1 mice and found that exercise could reduce Aβ levels and microglia activation without reducing the plaque loading in the hippocampus. Regarding the discrepancy in microglia data, the major differences between Ke et al.’s paper and ours could be explained by the cell quantification. Ke and colleagues considered only the most intense (or larger) Iba-1 stained microglia present only in AD animals, and the weaker staining for Iba-1 of WT mice was not quantified, while in our hands all Iba-1 positive cells were counted. Interestingly, Wyss-Coray et al. [47, 48] investigated the role of the complement system in the development of AD pathology in transgenic mice (hAPP). These authors have shown that microglial activation is associated with reduced Aβ accumulation and neurodegeneration, which corroborates our findings.
In the early stages of AD, microglia appear to play a role in Aβ clearance. However, as the disease progresses, microglia appear to become dysfunctional, losing their ability to clear and becoming toxic [4, 49]. According to Hickman et al. [8], at 8 months old, APP/PS1 mice already present a microglial dysfunction with reduced Aβ clearance and degradation, increasing the accumulation of Aβ and contributing to neurodegeneration. Moreover, Baik et al. (2016) [49] suggested that the death of the microglial cells (in which the Aβ protein is internalized through phagocytic activity) causes the release of the Aβ load in the extracellular space contributing to the formation and growth of new Aβ plaques. Interestingly, our data indicated an increase in hippocampal microglia in the APP/PS1+RE group, which accords with the significant decrease in the volume of Aβ plaques of the APP/PS1+RE group, associated with an absence of difference in the amount of Aβ protein observed here, thereby corroborating the study by Baik et al. [49].
It is well known that both aging and neurodegenerative diseases are associated with declines in energy production in the brain, as well as parallel changes in redox status with a pro-oxidant shift that may be due in part through the mitochondrial generation of superoxide and hydrogen peroxide [50]. Reduction of mitochondrial activity is a subtle and early event in the pathogenesis of AD. Interestingly, the chronic exposure to Aβ induces a failure in microglial phagocytic activity caused by energy metabolism defects [51]. Mitochondrial damage and consequentially enhanced production of reactive oxygen species occurs particularly in the vicinity of Aβ plaques [52]. Accordingly, it has been recently suggested that phagocytic activity together with the recruitment of microglia to plaque area can be induced by a metabolic switch from mitochondrial oxidative phosphorylation to anaerobic glycolysis [53]. On the other hand, emerging findings suggest that exercise-induced mitochondrial adaptive responses can protect neurons against neurodegenerative disorders [54, 55]. Exercise itself is known to increase mitochondrial antioxidant capacity, the complexity of electron transport system, and biogenesis, as well as decrease oxidative damage and apoptosis [56]. Exercise-induced brain mitochondrial adaptation includes enhanced co-expression of various enzymes involved in aerobic energy production [57, 58]. These mitochondrial responses have been induced by aerobic and resistance exercise [55, 58]. Based on these observations, we speculated that our neuroprotective result may also have been triggered by RE-induced beneficial adaptions on mitochondrial functions.
No difference was found between the WT and APP/PS1 mice in the analysis of microglia quantification in the whole hippocampus. Although there was no group effect or interaction, RE was able to reduce microglia recruitment in wild type animals, while microglia increased in APP/PS1 mice. Thus, the difference between the groups submitted to RE program indicates a modulatory effect of the genotype on microglial recruitment which in turn can be sensitized by the exercise elevating or diminishing them, depending on the presence or absence of amyloid plaques.
Interestingly, besides the quantification of the total number of hippocampal microglia, the analysis of microglia distribution in relation to plaques indicated that, in both APP/PS1 and APP/PS1+RE groups, microglia tended to accumulate around plaques, corroborating other studies from Baik et al. and Guillot-Sestier et al. [49, 59]. Curiously, our results also indicated that the APP/PS1 group presented higher percentages of microglia around plaques when compared with APP/PS1+RE. Considering the finding that the plaque volume is increased in APP/PS1 group, it is plausible that microglia positioned preferentially around plaques, whereas in the RE group, presenting lower volume of plaque, less microglia accumulate around plaques and are scattered throughout the hippocampus. These data suggest that RE is acting as an inflammation modulatory tool, and could reflect an inability of microglial recruitment in the APP/PS1 group.
In a chronic inflammation, such as the deposition of Aβ protein in AD, the activated microglia alter the balance of cytokines in favor of a more inflammatory and neurotoxic environment, upregulating pro-inflammatory cytokines such as IL-1α and IL-6 [60, 61]. During an acute cerebral insult, IL-1α is upregulated and precedes the expression of other pro-inflammatory cytokines, which seems to be directly related to IL-6 cytokine expression [62, 63]. With this in mind, the overexpression of these cytokines in a chronic degenerative disease, such as AD, may indicate a continuous pro-inflammatory stimulus that may contribute to degeneration. According to our findings, the hippocampal levels of IL-1α and IL-6 cytokines are elevated in APP/PS1 mice while RE maintains these cytokines at the level of control animals; this suggests that the RE program was able to modulate inflammatory response controlling and maintaining pro-inflammatory cytokines at baseline levels.
It is interesting to note that IL-4 presented a profile of expression similar to IL-1α and IL-6. As previously suggested, the IL-4 cytokine is involved in functional and structural repair, implying that when highly expressed, the tissue is being recovered. Moreover, although not directly related to inflammation, the treatment of neuroinflammatory diseases with the IL-4 cytokine has been shown to promote clinical improvement [64–66]. Therefore, higher levels of IL-4 in the APP/PS1 group may indicate a tissue recovery attempt whereas basal levels of IL-4 in the APP/PS1+RE group may indicate a decrease in tissue damage. According to these data, higher levels of IL-1α and IL-6 cytokines, associated with higher levels of the IL-4 cytokine as shown in APP/PS1 animals, would indicate an inflamed and recovering environment. In the same way that the decrease in the levels of these cytokines, seen in APP/PS1 animals submitted to RE, would indicate a decrease in the inflammatory environment, as well as lower tissue injury.
IL-10 is an anti-inflammatory cytokine found to be elevated in AD; however, its role in the disease is still controversial [60]. Despite being considered an anti-inflammatory cytokine, and related to increased neurogenesis and improved cognitive function, IL-10 expression was also positively related to a reduction of phagocytic microglial activity and, consequently, increased Aβ loading [59, 68]. However, no difference in IL-10 cytokine levels was detected in the hippocampus between groups. The positive covariance trends indicate that the number of Iba1+ cells counted in the hippocampus increases proportionally in the same way for WT×WT+RE and for WT×APP/PS1+RE, and increases inversely for WT×APP/PS1. Exactly the same pattern is observed for cytokines.
In summary, the present results suggest a compromised inflammatory response in APP/PS1 mice, in which dysfunction or failure in the hippocampal recruitment of microglia may have led to a reduction of phagocytic activity with consequent decrease in Aβ clearance and alteration in cytokine secretion. These alterations in cytokine expression seem to be a microglial response related to an inflammatory environment in the hippocampus in an attempt to recover homeostasis and damaged tissue [8, 9]. After one month of the resistance exercise program, the APP/PS1 mice showed increased recruitment of microglia that in turn may have contributed to the decrease in Aβ plaque volume, and also maintained IL-1α, IL-4, and IL-6 cytokines at control levels, thus reducing the inflammatory changes related to APP/PS1. So far, this is the first study using a resistance exercise program in a transgenic AD model.
Our study showed that RE was able to decrease the volume of amyloid plaques in the hippocampus of APP/PS1 mice. This decrease coincided with the increase in phagocytic microglial activity, as well as the recovery of the standard levels of IL-1a, IL-6, and IL-4 cytokines. These results indicate impairment in the recruitment of microglial cells in APP/PS1 mice which would contribute to a more inflammatory environment, with higher levels of IL-1a and IL-6 cytokines and consequently higher tissue damage indicated by high cytokine levels of recovery tissue IL-4. These changes may have contributed to minimizing the alteration of locomotor behavior as observed in the APP/PS1 mice.
Footnotes
ACKNOWLEDGMENTS
The authors would like to thank Ms. Christiane Gimenes, Mr. Emanoel Barreto, and Ms. Rebecca Diniz for their technical support, and FAPESP and CNPq for the financial support. This study was financed in part by the Coordenação de Aperfeiçoamento de Pessoal de Nível Superior - Brasil (CAPES) - Finance Code 001.