
Abstract
Background:
Amyloid-β (Aβ) accumulation in brain of patients with suspected Alzheimer’s disease (AD) can be assessed by positron emission tomography (PET) in vivo. While visual classification prevails in the clinical routine, semiquantitative PET analyses may enable more reliable evaluation of cases with a visually uncertain, borderline Aβ accumulation.
Objective:
We evaluated different analysis approaches (visual/semiquantitative) to find the most accurate and sensitive interpretation of Aβ-PET for predicting risk of progression from mild cognitive impairment (MCI) to AD.
Methods:
Based on standard uptake value (SUV) ratios of a cortical-composite volume of interest of 18F-AV45-PET from MCI subjects (n = 396, ADNI database), we compared three different reference region (cerebellar grey matter, CBL; brainstem, BST; white matter, WM) normalizations and the visual read by receiver operator characteristics for calculating a hazard ratio (HR) for progression to Alzheimer’s disease dementia (ADD).
Results:
During a mean follow-up time of 45.6±13.0 months, 28% of the MCI cases (110/396) converted to ADD. Among the tested methods, the WM reference showed best discriminatory power and progression-risk stratification (HRWM of 4.4 [2.6–7.6]), but the combined results of the visual and semiquantitative analysis with all three reference regions showed an even higher discriminatory power.
Conclusion:
A multi-analytical composite of visual and semiquantitative reference tissue analyses of 18F-AV45-PET gave improved risk stratification for progression from MCI to ADD relative to performance of single read-outs. This optimized approach is of special interest for prospective treatment trials, which demand a high accuracy.
INTRODUCTION
Alzheimer’s disease (AD) is the most common cause of dementia and is to be strongly suspected in elderly patients with progressive memory impairment [1, 2]. Following exclusion of other plausible etiologies, the definitive diagnosis of AD still requires confirmation postmortem through histopathological detection of amyloid-β (Aβ) plaques and neurofibrillary tangles [3]. However, biomarkers such as diagnostic molecular imaging are assuming an increasing role in the diagnosis of AD in living patients, and in staging of disease progression [4]. Artificial intelligence-based algorithms applied to multimodal imaging data have achieved 81% accuracy in predicting progression from the prodromal mild cognitive impairment (MCI) to Alzheimer’s disease dementia (ADD) [5]. In a comparison between two molecular imaging modalities with positron emission tomography (PET), the cerebral metabolism indexed by the glucose analogue 18F-fluorodeoxyglucose (18F-FDG) proved to be a better predictor of current cognitive impairment than was current Aβ burden indexed by 18F-florbetapir (18F-AV45) PET [6]. Since Aβ accumulation may initiate years before the neuronal injury of AD has progressed to the point of reducing cerebral metabolism to FDG-PET [7], it is important to define a threshold level of Aβ accumulation that predicts future cognitive deterioration. A machine learning method combining Aβ-PET and fractal dimension analysis of white matter (WM) structure to MRI gave accuracy as high as 89% in predicting this progression [8]. Recent developments in Aβ-PET methodology afford improved quantitation of Aβ burden in vivo [9, 10], which is of proven diagnostic value [11, 12]. Thus, an abundance of 11C-PiB PET studies attest to the relatively higher baseline Aβ burden in amnestic MCI patients destined to convert to ADD [13–15]. Furthermore, a meta-analysis of stand-alone Aβ-PET and structural MR studies gave similarly high effect sizes for predicting progression (Hedge’s g = 1.3) [16]. While hybrid Aβ-PET/magnetic resonance imaging (MRI) may gain increasing traction for diagnosis and the prediction of AD progression [17], we foresee stand-alone molecular imaging to remain predominant in clinical practice.
The distinction between Aβ-positivity (Aβ+) and negativity (Aβ-) is often achieved in the clinic by means of a visual read of the PET scan. This distinction can be difficult to classify, especially in patients with a low Aβ burden or a spatially circumscribed Aβ accumulation. Visual and semiquantitative analyses of Aβ-PET showed comparable results for Aβ quantification [18] and predicting conversion from MCI [19]. Nevertheless, a quantitative analysis seems apt to be superior, especially for predicting progression, due to its potentially more sensitive and reproducible detection of physiologically-defined endpoints. Maps of standard uptake value ratios (SUVR) relative to an appropriate reference region are widely used in the semiquantitative analysis of Aβ-PET. Although the entire cerebellum and the cerebellar grey matter volumes have frequently been used as reference regions with the Aβ-tracers 18F-AV45- and 11C-PIB, the excessive variability observed in longitudinal PET measurements raises some concerns about the fitness of this approach [20]. Hence, a reference region consisting of subcortical WM has recently emerged as a preferred approach for monitoring longitudinal Aβ changes [21–23]. This WM approach may be inherently robust to interference from longitudinal changes in cerebral perfusion with disease progression [24]. Furthermore, WM normalization of the Aβ-PET signal gave higher correlation between PET and biochemical findings in cerebrospinal fluid, indicating a stronger relationship with pathology [25].
A major clinical question to be answered with Aβ-PET entails the identification of those patients with MCI who are likely to develop ADD in the coming years, which is also an important precondition for designing trials of disease-modifying therapies. Therefore, we evaluated 18F-AV45-PET results from the Alzheimer’s Disease Neuroimaging Initiative (ADNI) dataset to show the impact of different reference regions on the sensitivity for predicting progression from MCI to ADD within a minimum follow-up period of two years. To this end, we compared and combined results of various semiquantitative approaches as well as the visual read, aiming to gain an improved categorization scheme for predicting progression to ADD. We especially focused on subjects with borderline pathological Aβ accumulation of magnitude close to the established semiquantitative thresholds [26], as these clinical reads are especially problematic and thus most likely to benefit from an optimization of risk prediction, e.g., for inclusion in clinical trials.
MATERIAL AND METHODS
Alzheimer’s disease neuroimaging initiative
Data used in the preparation of this article were obtained from the ADNI database (http://adni.loni.usc.edu). The ADNI was launched in 2003 by the National Institute on Aging (NIA), the National Institute of Biomedical Imaging and Bioengineering (NIBIB), the Food and Drug Administration (FDA), private pharmaceutical companies and non-profit organizations, as a $60 million, 5-year public-private partnership. The primary goal of ADNI has been to test whether serial MRI, PET, other biological markers, and clinical and neuropsychological assessment can be combined to measure the progression of MCI and early AD. Determination of sensitive and specific markers of very early AD progression is intended to aid researchers and clinicians to develop new treatments and monitor their effectiveness, as well as lessen the time and cost of clinical trials.
The Principal Investigator of this initiative is Michael W. Weiner, MD, VA Medical Center and University of California –San Francisco. ADNI is the result of efforts of many co-investigators from a broad range of academic institutions and private corporations, and subjects have been recruited from over 50 sites across the U.S. and Canada. The initial goal of ADNI was to recruit 800 subjects but ADNI has been followed by ADNI-GO and ADNI-2. To date these three protocols have recruited over 1,500 adults, aged 55 to 90 years, to participate in the research, consisting of cognitively normal older individuals, people with early or late MCI, and people with early AD. The follow up duration of each group is specified in the protocols for ADNI-1, ADNI-2 and ADNI-GO. Subjects originally recruited for ADNI-1 and ADNI-GO had the option to be followed in ADNI-2. For up-to-date information, see http://www.adni-info.org. Pre-processed brain 18F-AV45-PET images and T1-weighted (T1w) MPRAGE images were downloaded from the ADNI database.
Patient selection and study design
We included 486 subjects from ADNI-GO and ADNI-2 with a clinical diagnosis of MCI and presenting a brain 18F-AV45-PET/T1w MPRAGE dataset at their study baseline. Further inclusion was defined by ≥24 months follow up or progression to ADD during follow up. The last follow-up time-point or the time of progression was extracted from the ADNI database. 90 subjects were excluded due to <24 months follow-up without progression, resulting in a total number of 396 evaluated subjects. We recorded age, gender, years of education, ApoE alleles, and Alzheimer’s Disease Assessment Scale (ADAS-Cog 13) score for all patients. Details of the resulting study groups including demographics are provided in Table 1.
Demographics and covariates of the whole study population and the subgroups of progressors and non-progressors from mild cognitive impairment to Alzheimer’s disease dementia
y, years; mo, months; SD, standard deviation; ADAS, Alzheimer’s disease assessment scale.
Image data
ADNI 18F-AV45-PET acquisition and pre-processing
The 18F-AV45-PET images had been acquired using Siemens, GE, and Philips PET scanners according to a standard dynamic 50–70 min acquisition protocol following the intravenous injection of 370±37 MBq of 18F-AV45. Data were corrected for scatter and for attenuation, which was measured using the CT scan for PET/CT scanners, or a transmission scan with 68Ge or 137Cs rotating rod sources for stand-alone PET scanners. Images were reconstructed using scanner-specific algorithms, and sent to the University of Michigan, where they were reviewed for artifacts and transmitted to the Laboratory of NeuroImaging (LONI) for storage.
Downloaded 18F-AV45-PET images in DICOM format had been pre-processed in four steps: 1) motion correction by co-registration of single 5-min frames; 2) time frame averaging (50–70 min p.i.); 3) reorientation in a standardized 160×160×96 matrix with 1.5 mm cubic voxels; 4) smoothing with a scanner-specific filter function to an isotropic resolution of 8 mm. Partial volume correction was not performed.
ADNI MRI acquisition and pre-processing
T1-weighted MRI scans had been acquired using Siemens, GE, or Philips MRI scanners according to a standard protocol [27] involving acquisitions of two 3-D MPRAGE imaging sequences per subject. Of the two images acquired per subject and time-point, the ADNI quality assurance team selected the better image for pre-processing, based on the presence and severity of commonly occurring image artifacts.
MRI pre-processing involved: 1) application of a scanner-specific correction for gradient nonlinearity distortion (Gradwarp) [28]; 2) correction for image intensity non-uniformity (B1) [27]; 3) histogram peak sharpening algorithm for bias field correction (N3) [29]; 4) application of spatial scaling factors obtained by phantom measurements. For images acquired on Philips scanners, the B1 correction was already implemented, and the gradient systems with this instrument tended to be linear [27].
Image processing
All procedures were performed according to an automatic protocol using the PMOD PNEURO tool (V. 3.5 PMOD Technologies, Zürich): PET images were rigidly co-registered to the corresponding MRI to calculate a linear transformation (PET-2-MRI). Individual MR images were nonlinearly co-registered to the standard Montreal Neurological Institute (MNI)-space MRI template (MRI-2-MNI), while PET-2-MRI and MRI-2-MNI transformations were used to resample the PET images into the MNI space. T1-weighted MR images were segmented into gray matter (GM), WM, and cerebrospinal fluid [30] to generate a total of 83 individual brain VOIs for each subject in the MNI-space, according to the atlas of Hammers [31]. Inverse PET-2-MNI transformations were used to resample VOIs from the Hammers atlas to the native PET space, in which VOI calculations were subsequently performed. All images were visually checked for correct co-registration and appropriate segmentation.
Image analysis
For the visual analysis, two experts with considerable experience in brain Aβ imaging independently read the PET scans. The images received binary rating as either Aβ+ or Aβ–. Discrepant results were read and decided by a third expert (majority read).
For the semiquantitative analysis, a composite (COMP) cortical VOI comprising frontal, parietal, temporal regions, and precuneal/posterior cingulate gyrus was calculated as described previously [21]. Three established reference regions were used: 1) cerebellar grey matter (CBL), 2) brainstem (BST), and 3) subcortical WM (see Fig. 1). The WM reference tissue was generated by a subtraction method (full atlas - individual grey matter), as this method performed best in our previous study [32].

Illustration of the three different reference regions with voxels containing reference region tissue highlighted in red and the remaining brain in green for A) cerebellar grey matter (CBL); B) brainstem (BST); C) subcortical white matter (WM).
Statistics
The results of the visual read were compared between both expert readers using the Kappa coefficient. Mean (±SD) COMP-SUVR and single region SUVR were calculated for all patients according to the different reference regions listed above (CBL, BST, WM) and compared between progressors and non-progressors using a one-way ANOVA. Visual read and semiquantitative PET classifications were compared amongst each other by correlation analysis (Pearson’s correlation coefficient) and by receiver operator characteristics (ROC) to estimate the best performing method for predicting a progression from MCI to ADD, i.e., the method with greatest area under the curve (AUC). ROCs were compared using the ROC_2_curves_tool, version 6 (ACOMED statistic, Leipzig Germany), which implements the non-parametric approach of DeLong [33]. 18F-AV45 cut-off values, sensitivities, and specificities were calculated post hoc as those giving the best tradeoff between sensitivity and specificity (i.e., the highest sum of sensitivity and specificity values) for the discrimination between progressors and non-progressors according to the three reference region methods. Obtained cut-off values were then used to classify semiquantitation by each reference tissue as an Aβ-positive or Aβ-negative item. Hazard ratios were calculated to investigate the additive risk for single-item positivity compared to overall negative subjects including the gender, age, APOE4 status, education, ADAS, and the scanner type as covariates and log-rank tests were performed for the comparison between positive read-outs for subjects with only one positive rated item.
The number of positive items (n = 1 visual and n = 3 quantitative) was summed for each subject, resulting in a minimum score of “0” and a maximum of “4”, when all items were deemed positive. The summed item score was compared to single items by ROC analyses and the hazard ratio (HR) was calculated to investigate the additive risk imparted by the combined rating. For all statistical tests p-values < 0.05 were assigned to be significant.
RESULTS
Demographics
Our final study population included 396 subjects with the clinical diagnosis of MCI at their baseline 18F-AV45-PET examination and a mean clinical follow-up period of 45.6±13.0 (range 3.7–77.9) months. See Table 1 for details of the study population.
The observed incidence of progression to ADD during follow-up was 27.8% (110/396) and this incidence was higher for subjects with a higher 18F-AV45-PET SUVRCBL (see Fig. 2).
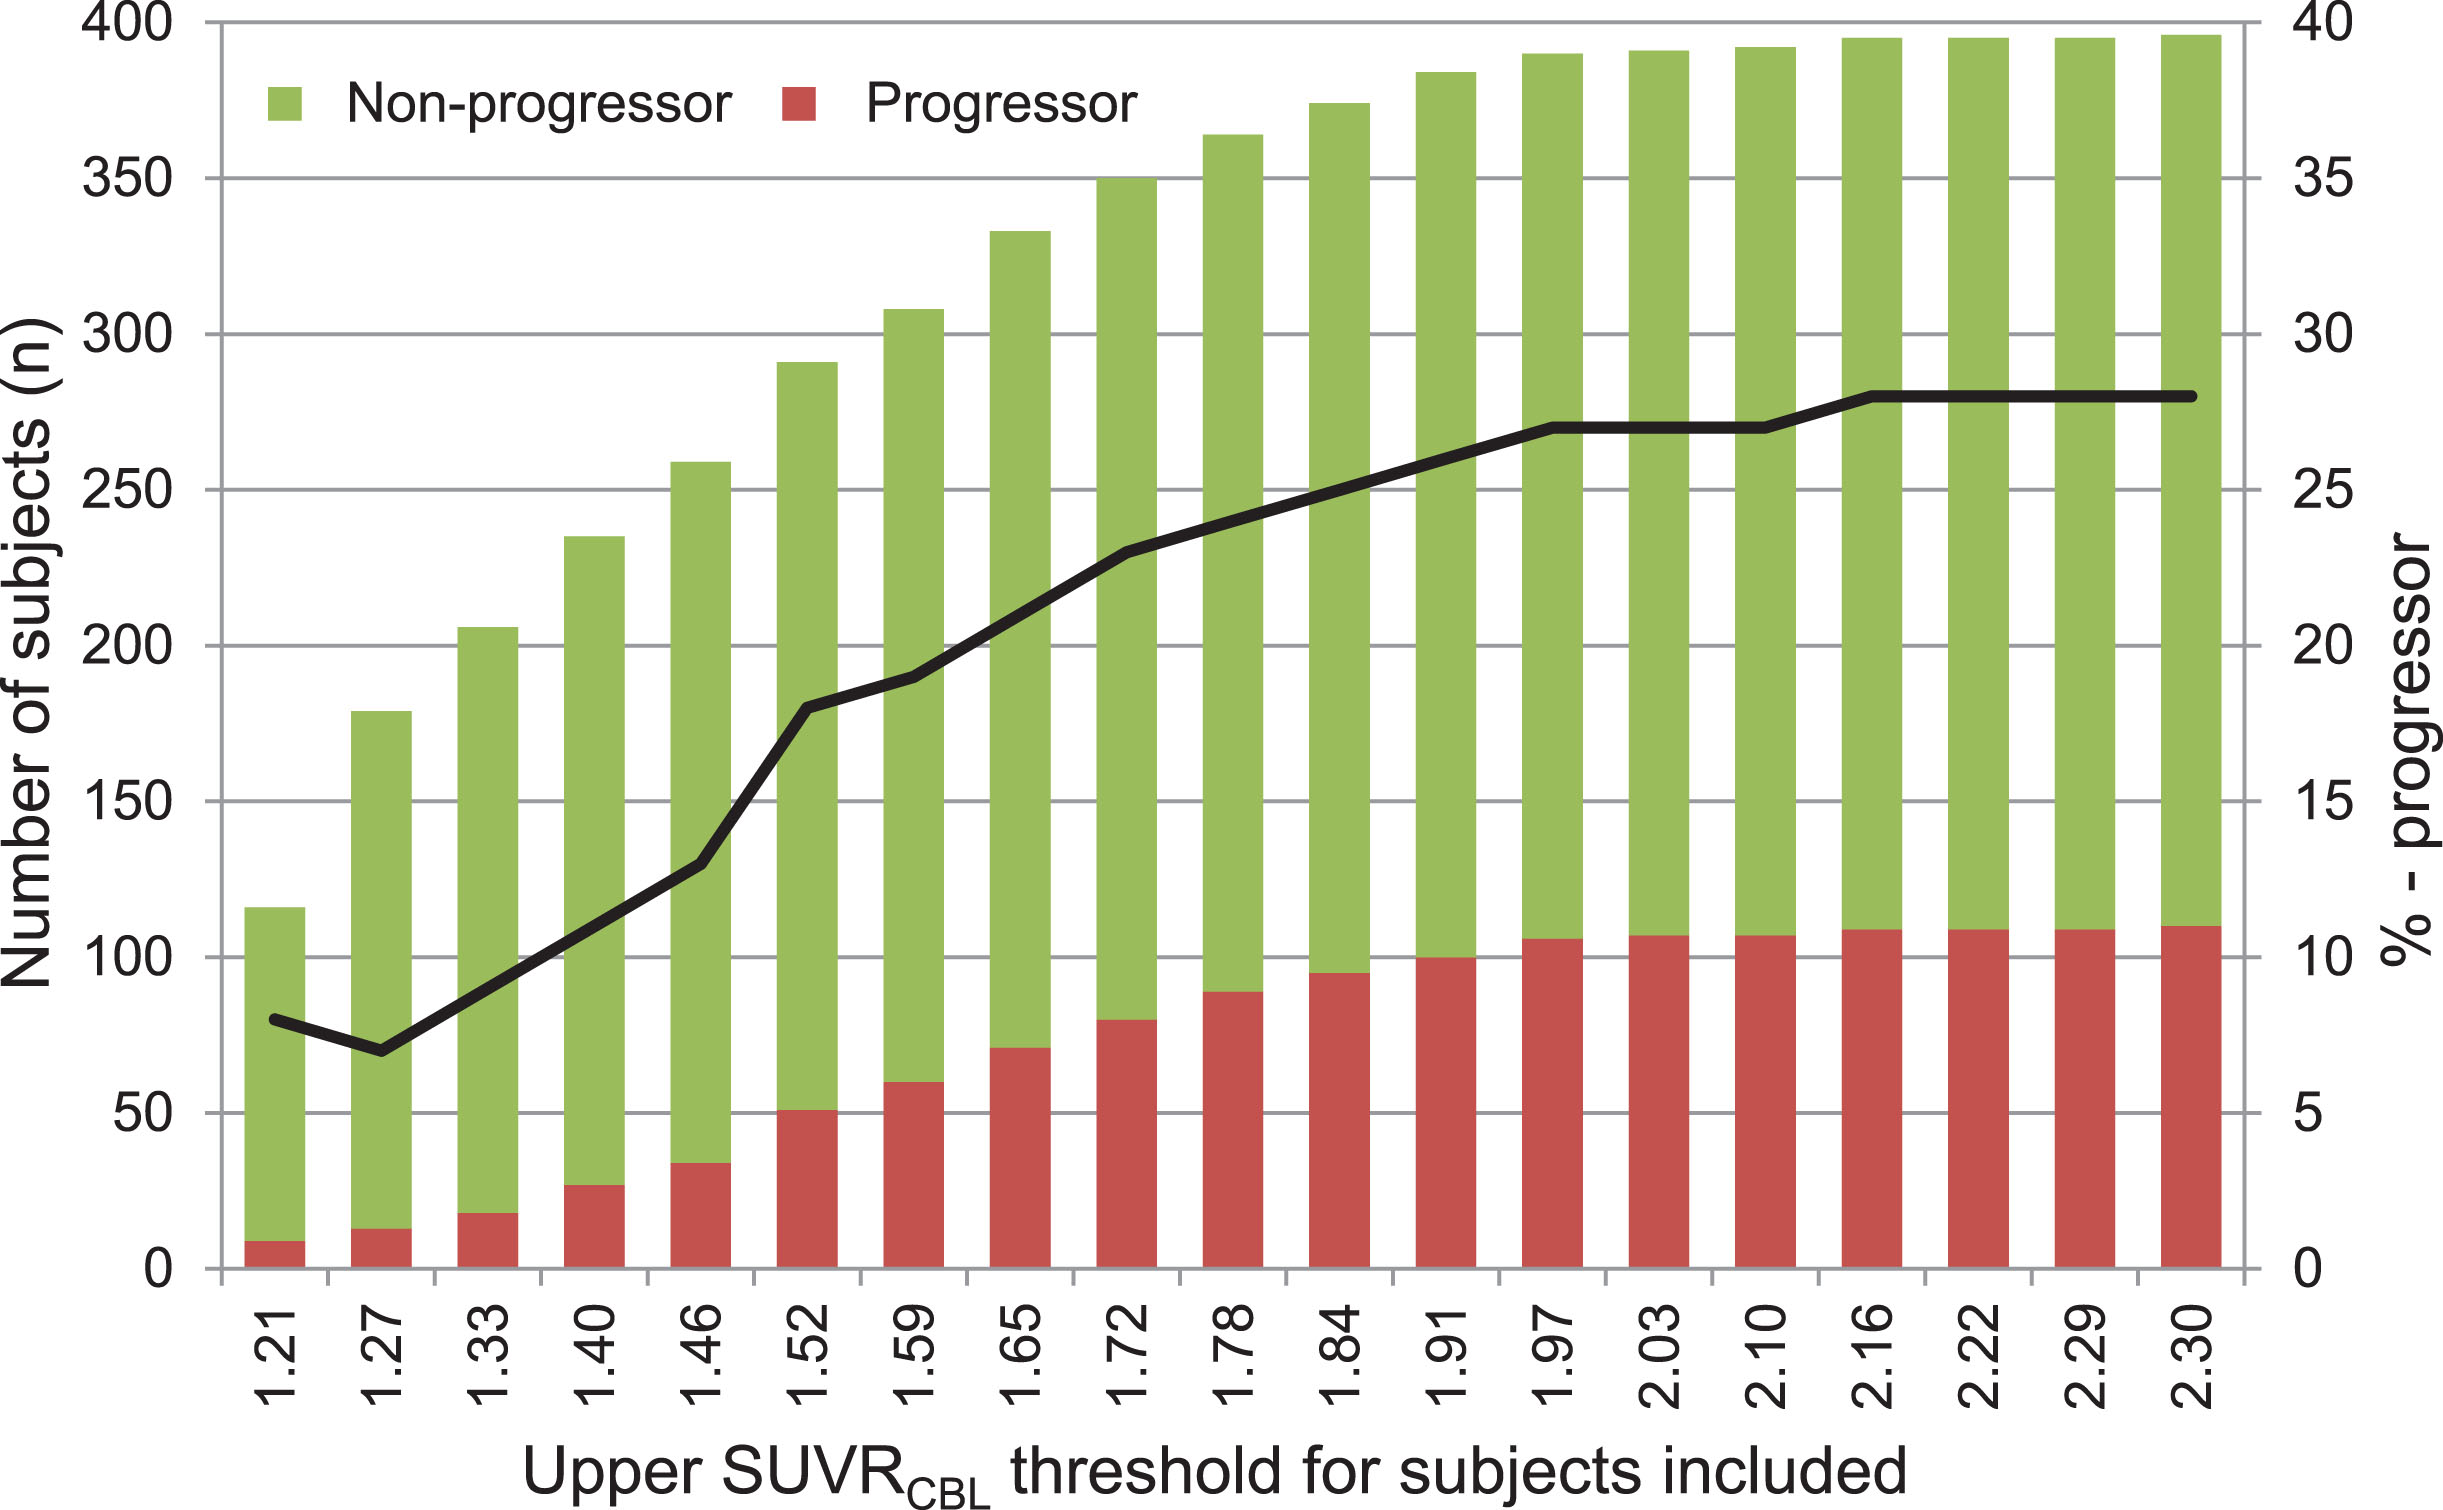
Number of all subjects initially presenting with mild cognitive impairment, divided into progressors (red bars) and non-progressors (green bars) and the progression rate (black line) as a function of the upper SUVRCBL threshold for subjects included.
Visual read
With the visual read, 40.7% (161/396) of all subjects were rated Aβ+. The binary reads of the first two experts had a Kappa coefficient of 0.660 (p < 0.001) with 54 (13.6%) discrepant reads, which required a third expert reading for majority decision.
Semiquantitative results from different reference regions
All mean SUVR (±SD) of the different reference region methods grouped by progression are presented in Table 2. The SUVRs differed significantly between progressors and non-progressors (pCBL = <0.001, pBST = <0.001, pWM = 0.002). The lowest SD for all groups was observed with the WM reference. The semiquantitative read-outs correlated significantly amongst each other and with the visual read (all p < 0.001).
Table2
Composite (COMP) standard uptake value ratios values (SUVR) of all subjects, the progressors and non-progressors for the three different reference regions, i.e., cerebellar grey matter (CBL), brainstem (BST), and subcortical white matter (WM).
ROC analyses
When using for all subjects the COMP-SUVR results for the three different reference regions and the visual read, ROC analyses gave a mean (±SD) AUC of 0.784 (±0.027) for the cerebellar grey matter reference, 0.805 (±0.025) for the brainstem reference, 0.813 (±0.023) for the white matter reference, and 0.766 (±0.027) for the visual read. The three semiquantitative analyses did not significantly differ with respect to prediction of progressors, but the BST and WM reference regions gave significantly higher ROC AUCs when compared to the visual read (p = 0.02 for BST and p = 0.03 for WM). In a subgroup analysis with subjects who progressed within one year after the amyloid PET scan, the AUCs did not significantly differ among the three semiquantitative analyses (AUCCBL = 0.769, AUCBST = 0.770, AUCWM = 0.785), whereas all semiquantitative approaches showed higher AUC values compared to the visual read (AUCvisual = 0.739).
To determine the predictive performance at borderline amyloid load, we sorted the patients according to descending SUVR values (see Fig. 3). As expected, AUC values decreased with descending SUVR threshold values for all three investigated methods. By far the most robust AUC as a function of threshold was obtained using the WM reference, indicating still high prediction of progression among borderline cases.
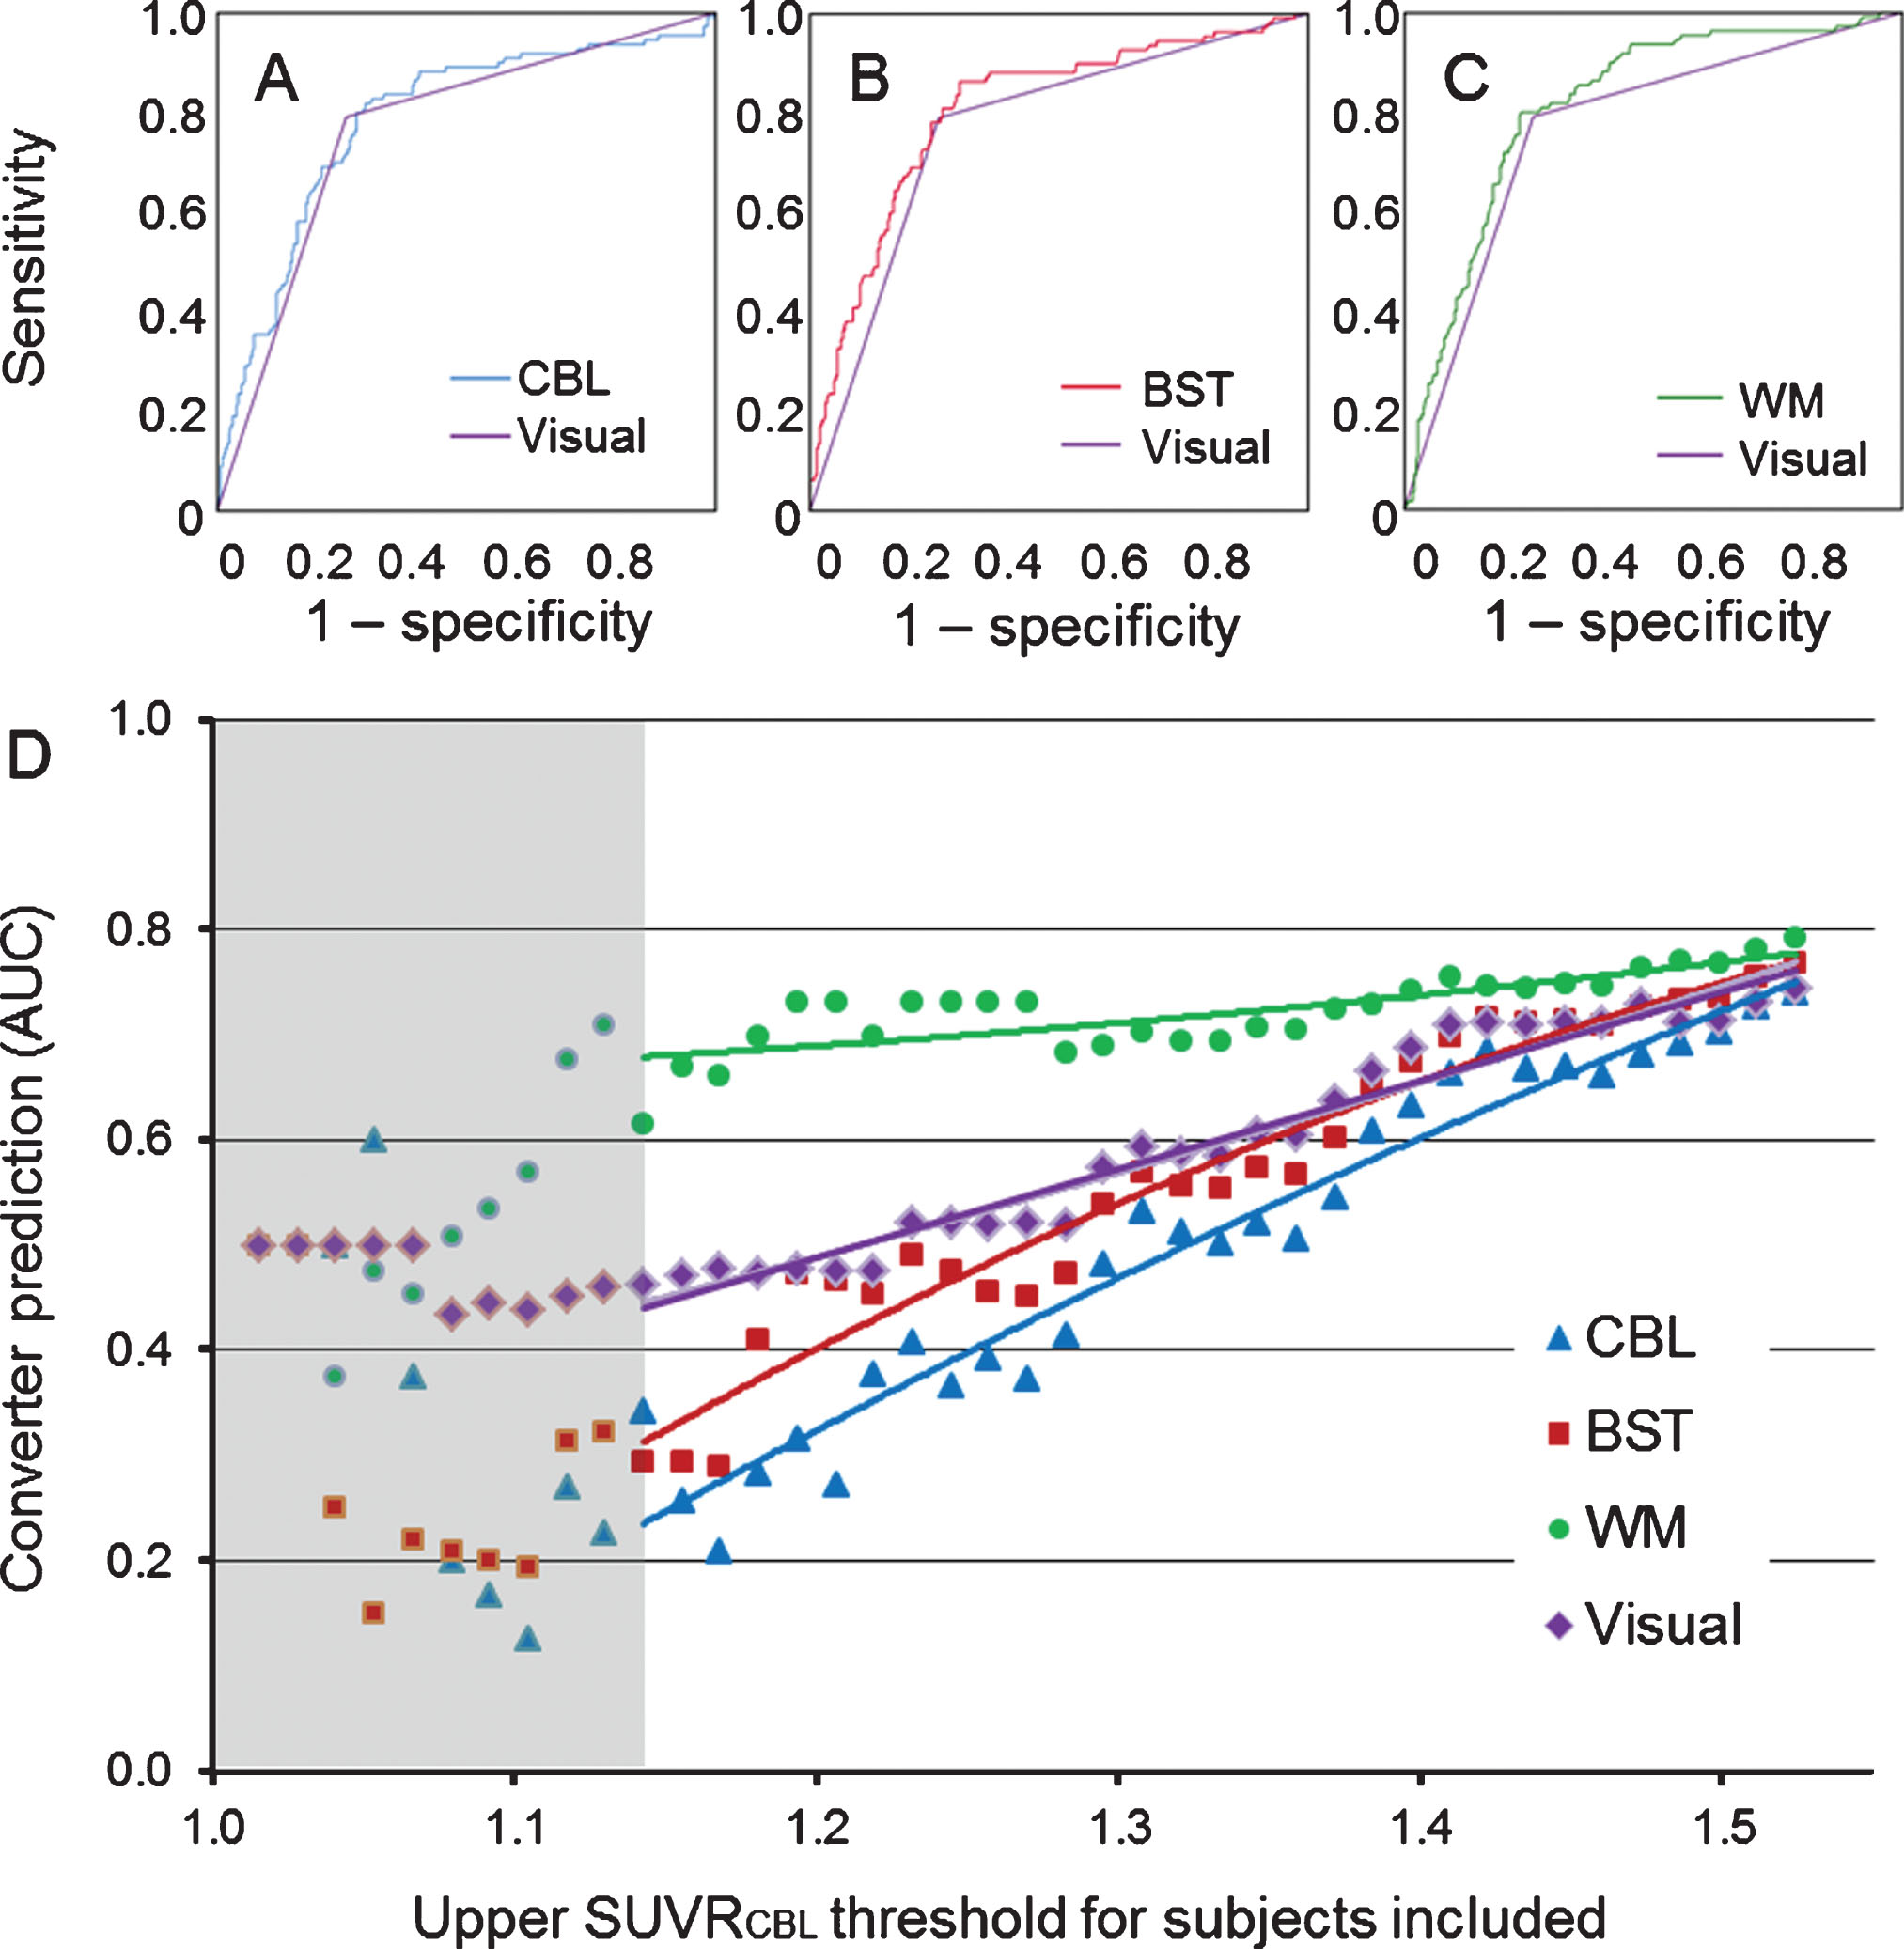
A–C) Receiver operating characteristic curves for the predictive value for progression from mild cognitive impairment to Alzheimer’s disease dementia for the three different reference region analyses against the visual read. D) AUC values for the visual read and the three reference region methods when including subjects based on their SUVRCBL value. The solid lines define the trend for each method based on the single values expressed as dots. Analyses including subjects with a SUVCBL < 1.143 are depicted in the grey sector because of insufficient statistics for n≤45. CBL, cerebellum; BST, brainstem; WM, white matter.
We evaluated the optimal sensitivity and specificity of all methods by undertaking a ROC analysis. The visual read showed a sensitivity of 79.1% and a specificity of 74.1%, which was set as the reference standard. When demanding the same sensitivity or specificity with adapted SUVR thresholds for the three reference regions, the WM reference showed the highest corresponding specificity (76.9%) and sensitivity (80.0%) (see Table 3).
Corresponding sensitivities and specificities for the four different analytical methods
MCI, mild cognitive impairment; CBL, cerebellar grey matter; BST, brainstem; WM, white matter.
Combined rating
When categorizing the subjects using the SUVR thresholds with the highest individual summed sensitivity and specificity for predicting progression (SUVR≥1.41 for CBL,≥0.95 for BST, and≥0.97 for WM) and including the gender, age, APOE4 status, education, ADAS, and the scanner type as covariates, the progression rate increased as a function of the number of positive items (see Table 4). When combining the four binarized methods specified above (visual read, CBL, BST, WM) to give a score ranging from 0 to 4 positive items, 28.5% (112/396) of all subjects and 32.7% (36/110) of those subjects converting to ADD within the observation period showed inconsistent results, i.e., not deemed positive or negative in all four items. Of the 42 subjects with only one positive read-out, 21.4% (9/42) of subjects progressed to ADD within a mean follow-up of 30.0 months (range 4.2–57.7 months). Four of these nine converters were positive only for the WM reference read-out, two of nine were positive in the CBL and BST read-out, and one was rated positive only to visual read. The read-outs did not differ in their predictive power in this small subanalysis (p = 0.133).
Number of positive items in the four methods with the number and percentage of subjects, sensitivity and specificity and the incidence of progression for all subgroups
Comparing visual with semiquantitative read-outs, six out of 396 MCI subjects were rated positive only to visual read but negative in any of the three semiquantitative read-outs, including only one (16.7%) progressor to ADD. 39 out of 396 MCI subjects were rated positive in any semiquantitative approach but were not positive to visual read, of whom 14 (35.9%) progressed to ADD.
Progression risk
The four methods differed in their predictive power for risk of progression. A positive Aβ-PET result using WM reference, with a HR of 4.4 [2.6–7.6], showed the best discriminatory power and progression-risk stratification compared to a negative Aβ-PET result, followed by the visual read (HR = 3.8 [2.2–6.5]), the BST normalization (HR = 3.7 [2.2–6.2]), and the CBL normalization (HR = 2.8 [1.8–4.5]). For the prediction of progressors, the ROC analyses of the combined rating with all four methods showed a mean (±SD) AUC of 0.824 (±0.023), a significantly better performance compared to that of the visual read or the CBL referenced SUVR alone (pvisual < 0.001; pCBL = 0.005), but not compared to the BST and WM referenced SUVRs (pBST = 0.140; pWM = 0.493). When including also the APOE status (0/ ≥1), binarized age (median split into younger/older subjects), binarized ADAS score (median split) and binarized years of education (median split), a rating from 0–8 showed an even higher mean AUC value of 0.854 (±0.021). The non-PET data alone resulted in an AUC value of 0.756 (±0.027).
The evaluation of the additive risk from a higher number of positive items showed that each additional positive item increased the progression risk significantly resulting in a HR for the combined rating of 1.6 [1.4–1.9] (X2 = 185.71, p < 0.001). This was also reflected by the progression-free survival times of the various groups (Fig. 4).
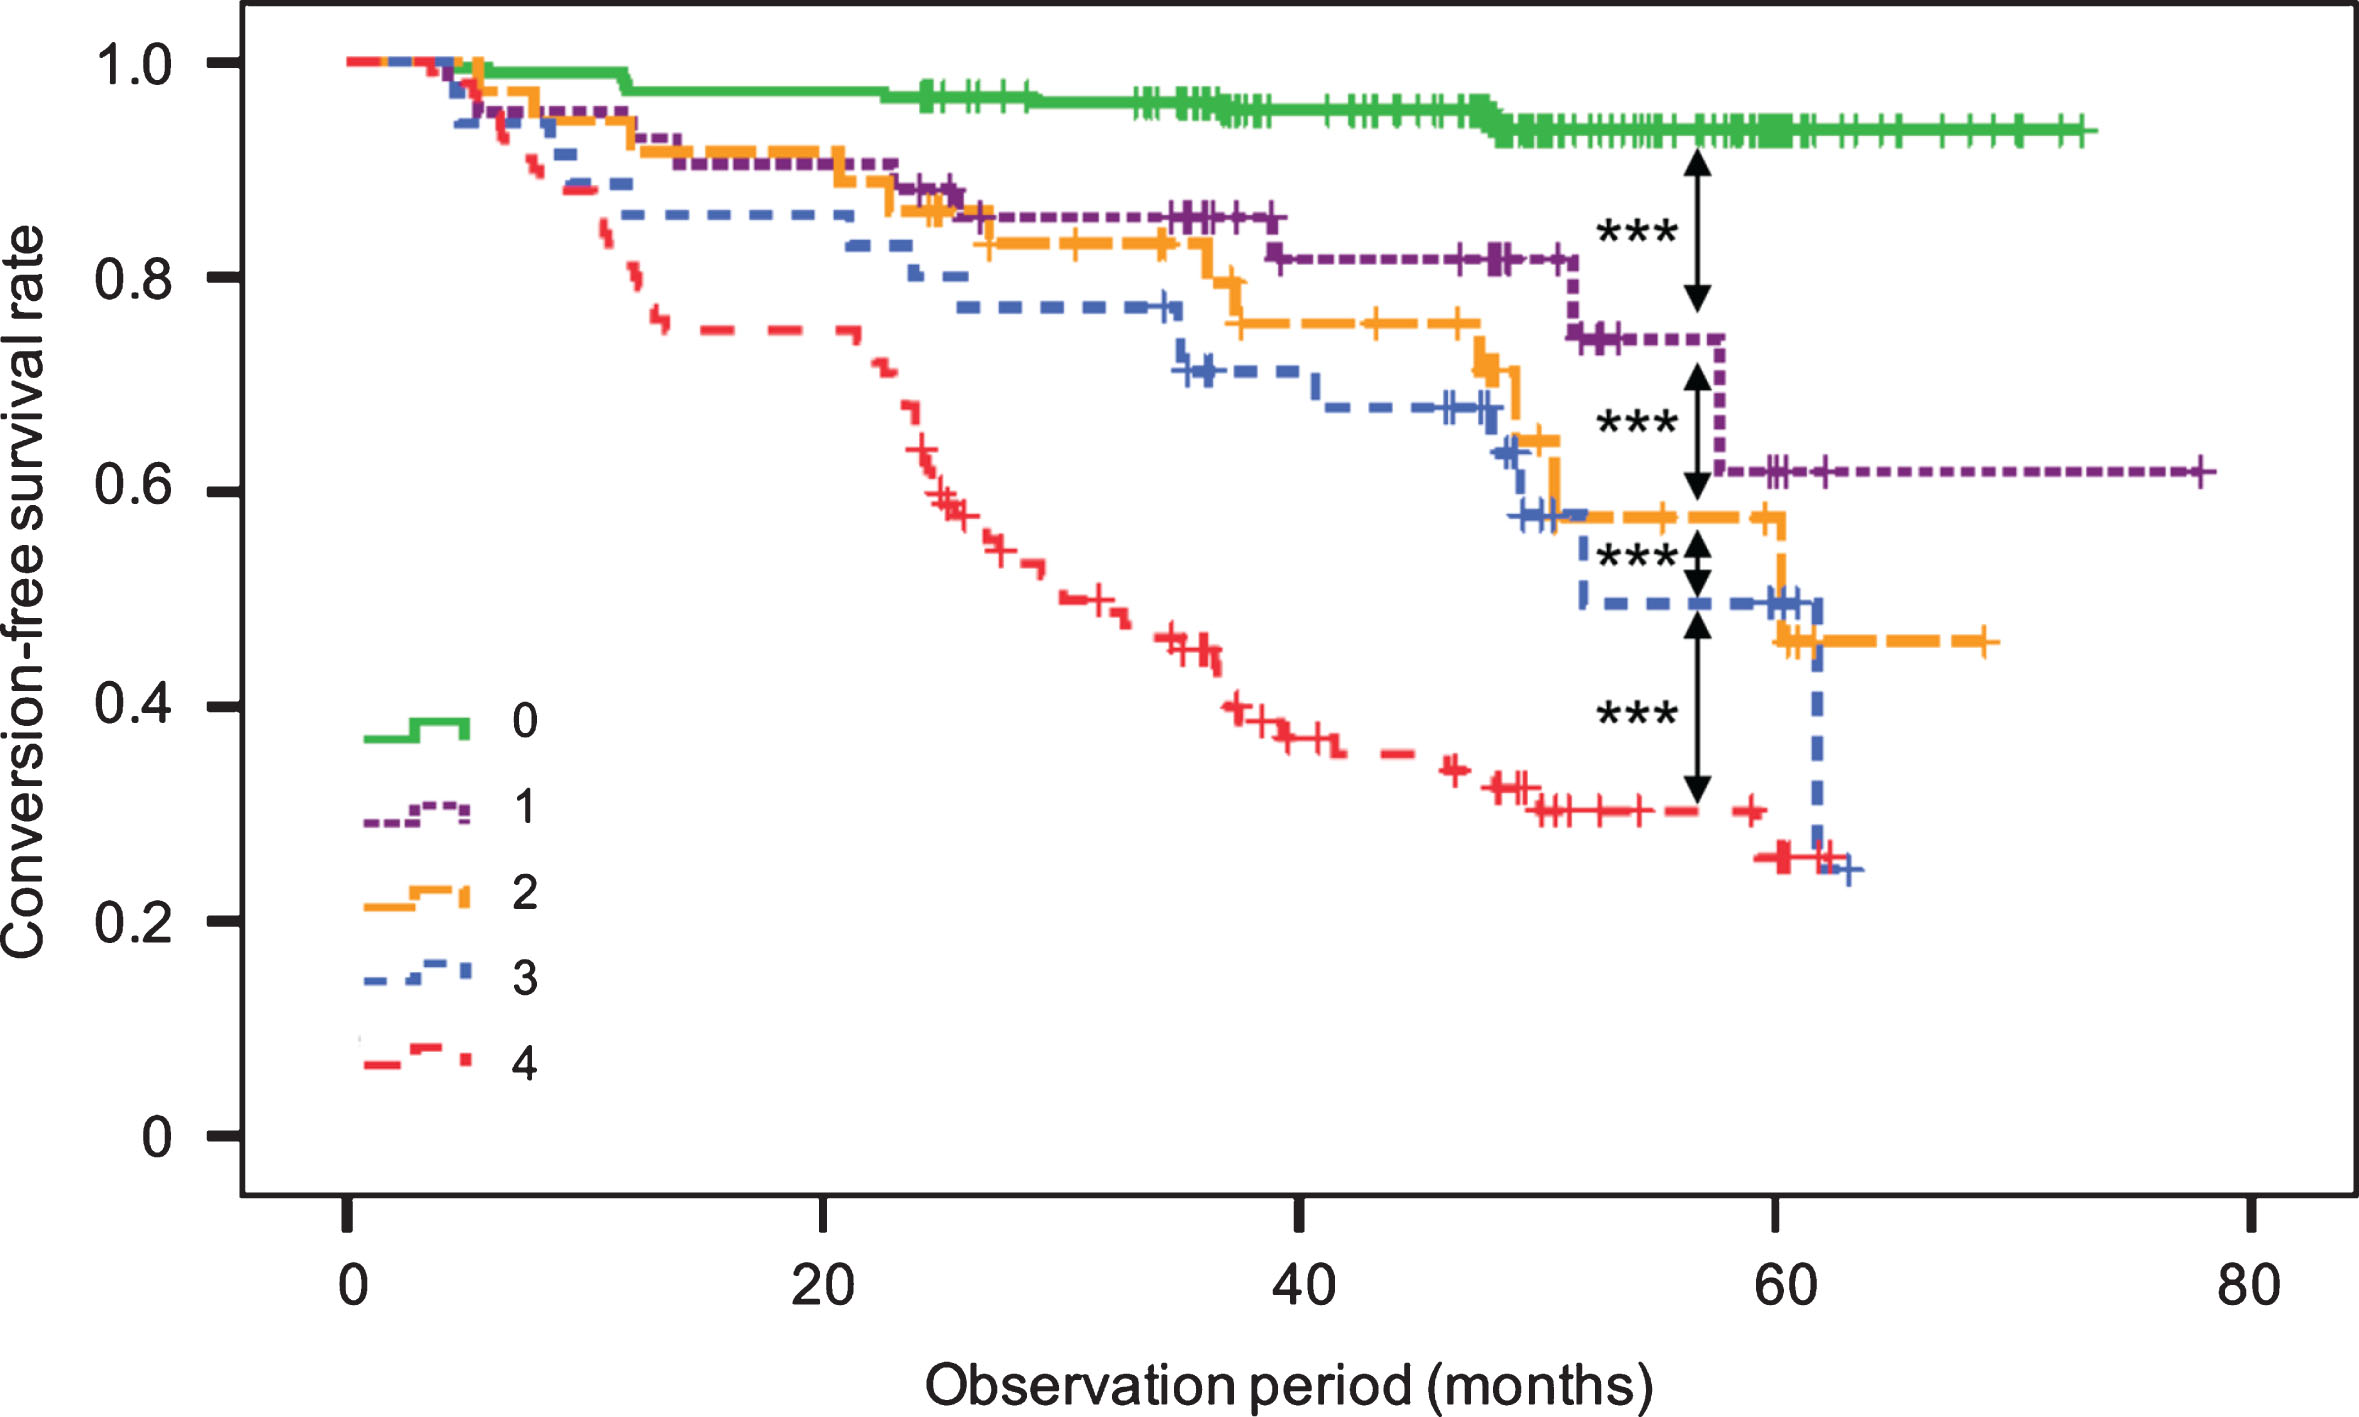
Kaplan-Meier analyses for the progression-free survival rate within the observation period of the five subgroups (0–4) of patients initially presenting with mild cognitive impairment, according to the multi-analytical item rating, where a score of 4 indicates positivity in all items. ***p < 0.001.
DISCUSSION
We present a multi-analytical approach using 18F-AV45 amyloid PET images to predict progression to ADD in patients presenting with MCI. We systematically investigated the impact of using three different reference regions for SUVR calculation on the estimated risk for progression and compared these semiquantitative approaches with a concordance visual read. Furthermore, we combined the results of all four methods and evaluated the risk of progression as a function of the aggregate number of positive items. Semiquantitative analysis by a WM reference gave the best performance in predicting progression among the four single approaches. However, and most importantly, the combined results of three semiquantitative and visual analyses provided the overall best stratification; among those cases with four positive Aβ+ readouts, 64% progressed to ADD within a mean progression time of only 23 months.
Biomarkers of Aβ deposition have been integrated into the criteria for the early diagnosis of AD [1, 2]. Unfortunately, a standardized read-out with thresholds for normality is lacking, which hampers the widespread clinical implementation of such tools [34]. The development of an accurate biomarker-based predictor for the individual risk of progression from MCI to ADD would be of great clinical interest [35]. Visual reading remains the standard practice with 18F-AV45-PET imaging. An earlier comparison of visual read and quantitative 18F-AV45-PET analyses showed equivalent fitness of the two approaches for identifying Aβ+ status in subjects with MCI [19]. However, especially in borderline cases with a low Aβ burden, a visually-based prediction of risk for progression to clinically manifest ADD is challenging. We now report a sensitivity of 79.1% and a specificity of 74.1% for predicting disease progression by the visual read-out, while similar levels were achieved for brainstem and white matter reference, whereas slightly lower levels were observed for the cerebellar reference.
In recent longitudinal Aβ-PET studies with 18F-AV45, forebrain WM proved to be a better reference region than was the usual standard of entire cerebellum [21–23]. For patients whose cerebrospinal fluid Aβ1-42 concentrations had suggested stable or increased brain Aβ burden to follow-up, the PET SUVRs with WM normalization showed results concurring best with the biochemical findings [23]. In addition, the inter-subject variability was lowest for the WM reference analysis, indicating that this approach gives rise to fewer interfering factors than does entire cerebellum normalization [21]. This seems especially pertinent given that effects of longitudinal, disease-related changes in cerebral perfusion on SUVR might be better accommodated with the WM reference region [24]. Overall, our data show a slightly, but not significantly, higher discriminatory power with a WM reference compared to results with the CBL and BST reference regions or the visual read. For subjects with a low or high amyloid burden, the clinically used visual read seems to be sufficient, without need for an additional semiquantitative evaluation. Interestingly, when considering those MCI subjects with borderline SUVRCBL values, we found an increasing discrepancy between the discriminatory powers of the different read-outs. While discriminatory power remained approximately stable using the WM reference, there was significantly reduced power with CBL or BST reference regions and the visual read for those patients with a SUVRCBL close to the established positivity threshold value [26]. This observation suggests that the predictive accuracy for future progression is increased by using a WM reference. Indeed, we consider that WM reference normalization has superior diagnostic value especially for the borderline subjects. It is precisely in such cases that a correct categorization of Aβ status is of particular importance, especially if they should be candidates for therapeutic trials, since inclusion of false-positive cases would diminish the power of such studies.
The three semiquantitative analyses all showed comparable sensitivities, which was highest (80.0%) using the WM reference region, to be compared with 74.1% specificity recorded for the visual read. Therefore, all three SUVR methods seem equally appropriate for use when high specificity is required. However, the semiquantitative approaches offer the opportunity to deliver higher sensitivity or specificity by threshold modification if required, e.g., when conducting therapeutic trials in an exclusively Aβ-positive study group.
We evaluated the combined and separate predictive values of four 18F-AV45-PET evaluation methods among patients with MCI at the time of scanning. The composite positivity rating with all four methods showed the highest capability for predicting progression to ADD, which indeed exceeded the sensitivities for the separate use of any single method. The total number of positively-rated results significantly affected the estimated risk of progression. Thus, the progression rate increased as a function of the number of positive items, from only 5.5% in those with no positive item to 64% in those with four results items, i.e., an 11-fold higher risk to convert compared to the consistently negative patients. When comparing the different groups, we note that the overall negative subjects were significantly younger than were subjects with multiple positive read-outs. This might lower the statistical progression risk of negative cases, as the incidence of ADD is age-dependent.
We found discrepancies between the item-positivity in 28.5% of all subjects, and in 32.7% of the subjects converting to an ADD within the observation period. This may suggest that the different read-outs contain supplemental or incompletely overlapping information predictive of a progression from MCI to ADD. The combined evaluation of all results may give an improved trade-off, minimizing the weighting of each methods’ disadvantages, thus improving diagnosis in borderline cases which are difficult to discriminate visually [36]. In other words, the combined evaluation of several semiquantitative analyses using different reference regions might average out method-specific biases, as might arise due to the relatively high non-specific binding of Aβ tracers in WM, or due to the inherently high inter-subject variability in longitudinal measurements with a CBL reference region [20].
In conclusion, the combined evaluation of the results of visual read and three SUVR methods for 18F-AV45-PET improved the power for predicting progression of MCI to ADD, especially in those cases with a low Aβ burden lying near the positivity threshold. Given that the PET data were acquired during the interval of 50–70 min after tracer injection, our analyses may not be optimal for all cases, since confounding effects of any cerebral perfusion changes occurring during the scan might not be properly accommodated. In consideration of this possibility, full dynamic data acquisitions would have been preferable, although we note that such long PET recordings are hardly practicable in a clinical setting. Furthermore, we did not apply partial volume correction in this study, such that degree of brain atrophy might contribute to group differences. Routine implementation of our method would require a semi-automated data analysis pipeline for calculating and scoring the three different reference tissue normalization methods, in conjunction with the ordinary visual read. Based on our experience, we find this to be feasible through modification of commercially available software packages. Our approach should be especially useful for therapeutic trials, where reliable prediction of the risk for progression from MCI to ADD is critical for appropriate patient selection.
Conclusion
We aimed to optimize diagnostic algorithms for using 18F-AV45-PET to predict progression to ADD in MCI patients with at least two-year follow-up. For this analysis, we compared the visual read with three different reference region normalizations (CBL, BST, WM) and evaluated the combined use of the results of all four read-outs. Among the single methods, SUVR relative to the WM was clearly the best predictor of progression. Combining the four read-outs showed even higher discriminatory power, with each positive rated item increasing the progression risk significantly. Our approach should be beneficial in contexts where high predictive accuracy is demanded, e.g., for prospective treatment trials.
Footnotes
ACKNOWLEDGMENTS
Data collection and sharing for this project was funded by the Alzheimer’s Disease Neuroimaging Initiative (ADNI) (National Institutes of Health Grant U01 AG024904) and DOD ADNI (Department of Defense award number W81XWH-12-2-0012). ADNI is funded by the National Institute on Aging, the National Institute of Biomedical Imaging and Bioengineering, and through generous contributions from the following: AbbVie, Alzheimer’s Association; Alzheimer’s Drug Discovery Foundation; Araclon Biotech; BioClinica, Inc.; Biogen; Bristol-Myers Squibb Company; CereSpir, Inc.; Cogstate; Eisai Inc.; Elan Pharmaceuticals, Inc.; Eli Lilly and Company; EuroImmun; F. Hoffmann-La Roche Ltd and its affiliated company Genentech, Inc.; Fujirebio; GE Healthcare; IXICO Ltd.;Janssen Alzheimer Immunotherapy Research & Development, LLC.; Johnson & Johnson Pharmaceutical Research & Development LLC.; Lumosity; Lundbeck; Merck & Co., Inc.;Meso Scale Diagnostics, LLC.; NeuroRx Research; Neurotrack Technologies; Novartis Pharmaceuticals Corporation; Pfizer Inc.; Piramal Imaging; Servier; Takeda Pharmaceutical Company; and Transition Therapeutics. The Canadian Institutes of Health Research is providing funds to support ADNI clinical sites in Canada. Private sector contributions are facilitated by the Foundation for the National Institutes of Health (![]() ). The grantee organization is the Northern California Institute for Research and Education, and the study is coordinated by the Alzheimer’s Therapeutic Research Institute at the University of Southern California. ADNI data are disseminated by the Laboratory for Neuro Imaging at the University of Southern California.
). The grantee organization is the Northern California Institute for Research and Education, and the study is coordinated by the Alzheimer’s Therapeutic Research Institute at the University of Southern California. ADNI data are disseminated by the Laboratory for Neuro Imaging at the University of Southern California.