
Abstract
Background:
Neuroinflammation in Alzheimer’s disease is known as an important process in the disease, yet how microglial activation affects disease progression remains unclear.
Objective:
The current study aims to interrogate the predictive value of neuroinflammation biomarker (11C-PBR28 PET), together with A/T/N imaging markers on disease deterioration in a cognitively impaired patient cohort.
Methods:
The study included 6 AD and 27 MCI patients, who had MRI, 11C-PBR28, 18F-flutemetamol (amyloid marker), 18F-AV1451 (tau marker) PET scans, and were followed up with multiple neuropsychological assessments for at least one year (1.6 and 2.8 years on average for AD and MCI). The predictive values of imaging biomarkers on baseline and longitudinal cognition were interrogated using linear regression to identify the biomarkers that could explain disease progression.
Results:
Linear mixed models found the average intercepts (baseline) MMSE were 23.5 for AD and 28.2 for MCI patients, and the slope of MMSE (annual change) were –0.74 for AD and –0.52 for MCI patients. White matter microstructural integrity was predictive of baseline cognition, while PET markers of amyloid, tau and neuroinflammation were predictive of longitudinal cognitive decline. Both amyloid and neuroinflammation PET markers were predictors independent of each other. And a sub-group analysis showed the predictive effect of neuroinflammation on cognitive decline is independent of amyloid and tau.
Conclusions:
Our study highlights the prognostic value of disease specific markers (amyloid, tau and neuroinflammation) in clinically diagnosed AD and MCI patients and suggests that the effects of these molecular markers are mediated by structural damage to the brain.
INTRODUCTION
Alzheimer’s disease (AD) is the most prevalent form of dementia and accounts for ∼60% of all clinically diagnosed dementia, and it is estimated that ∼10% people above 65 years old have AD [1]. Extracellular amyloid-β (Aβ) plaques, intracellular neurofibrillary tangles (NFT) and neuronal loss are typical pathological hallmarks of AD. Current understanding of AD has established a specific spatial-temporal pattern of amyloid deposition and tau pathology [2–4].
While imaging and fluid biomarkers have been incorporated into the 2011 NIA-AA (National Institute on Aging – Alzheimer’s Association) research guidelines as evidence of Alzheimer’s pathophysiology, the core clinical criteria for diagnosing mild cognitive impairment (MCI) and AD rely purely on clinical information and neuropsychological assessments, and still serve as the standard for clinical practice [5–7]. Nevertheless, with the constant advances in understanding of AD, the research criteria (International Working Group (IWG) and NIA-AA) have rapidly evolved over the past decades [8]. In 2018, NIA-AA proposed the A/T/N (Amyloid-β/Tau/Neurodegeneration) framework for a better biological definition of AD [9]. The A/T/N framework facilitates clinical investigation into the highly heterogenous MCI/dementia population by providing an unbiased classification scheme, and the prognostic value of A/T/N biomarkers are being established, however, its generalisation to clinical practice is not recommended at present [8].
Along the disease trajectory, it has been suggested that Aβ deposition is the earliest event in the pathogenesis of AD, followed by formation of tau pathologies and neuronal losses in brain [10]. These observations lead to the amyloid cascade hypothesis, which suggests that the initial accumulation of amyloid toxicity leads to subsequent events including hyperphosphorylation of tau, NFT formation and neuronal damage [11]. Indeed, recent advances in the field have highlighted the important role of neuroinflammation in AD pathogenesis [12].
An increased level of neuroinflammation has been observed in AD, spatially and temporally accompanying Alzheimer’s pathology and cognitive decline in clinical studies [13, 14]. However, whether neuroinflammation directly contribute to disease progression or it is simply a marker associated disease process is still an open question. To date, there have been only a few longitudinal studies testing whether neuroinflammation can predict future disease progression, independent of the established A/T/N biomarkers [15, 16]. In the current pilot study, we aim to provide evidence to answer the above question by interrogating the predictive value of imaging biomarkers of neuroinflammation along with amyloid deposition, NFT pathology and neurodegeneration on the cognitive trajectory in clinically diagnosed AD and MCI patients.
MATERIALS AND METHODS
Standard protocol approvals, registrations, and patients consents
This study was approved by the London Riverside Research Ethics Committee, National Health Research Services, Health Research Authority, UK. PET tracers’ administration was approved by Administration of Radioactive Substances Advisory Committee (ARSAC). Written informed consent was obtained from all participants.
Participant recruitment, inclusion and exclusion criteria
Potential participants in the study were recruited by: 1) referral from memory clinics in UK; 2) through “Join Dementia Research” website; and 3) through General Practitioner’s surgery. Interested participants undertook a telephone pre-screening and screening visit, where medical examination, blood tests, cognitive tests were performed. Screen visits were followed by MRI scans, and patients with significant vascular disease (Fazekas score > 2) were excluded. The clinical diagnosis was re-confirmed before PET scans were performed (Fig. 1).
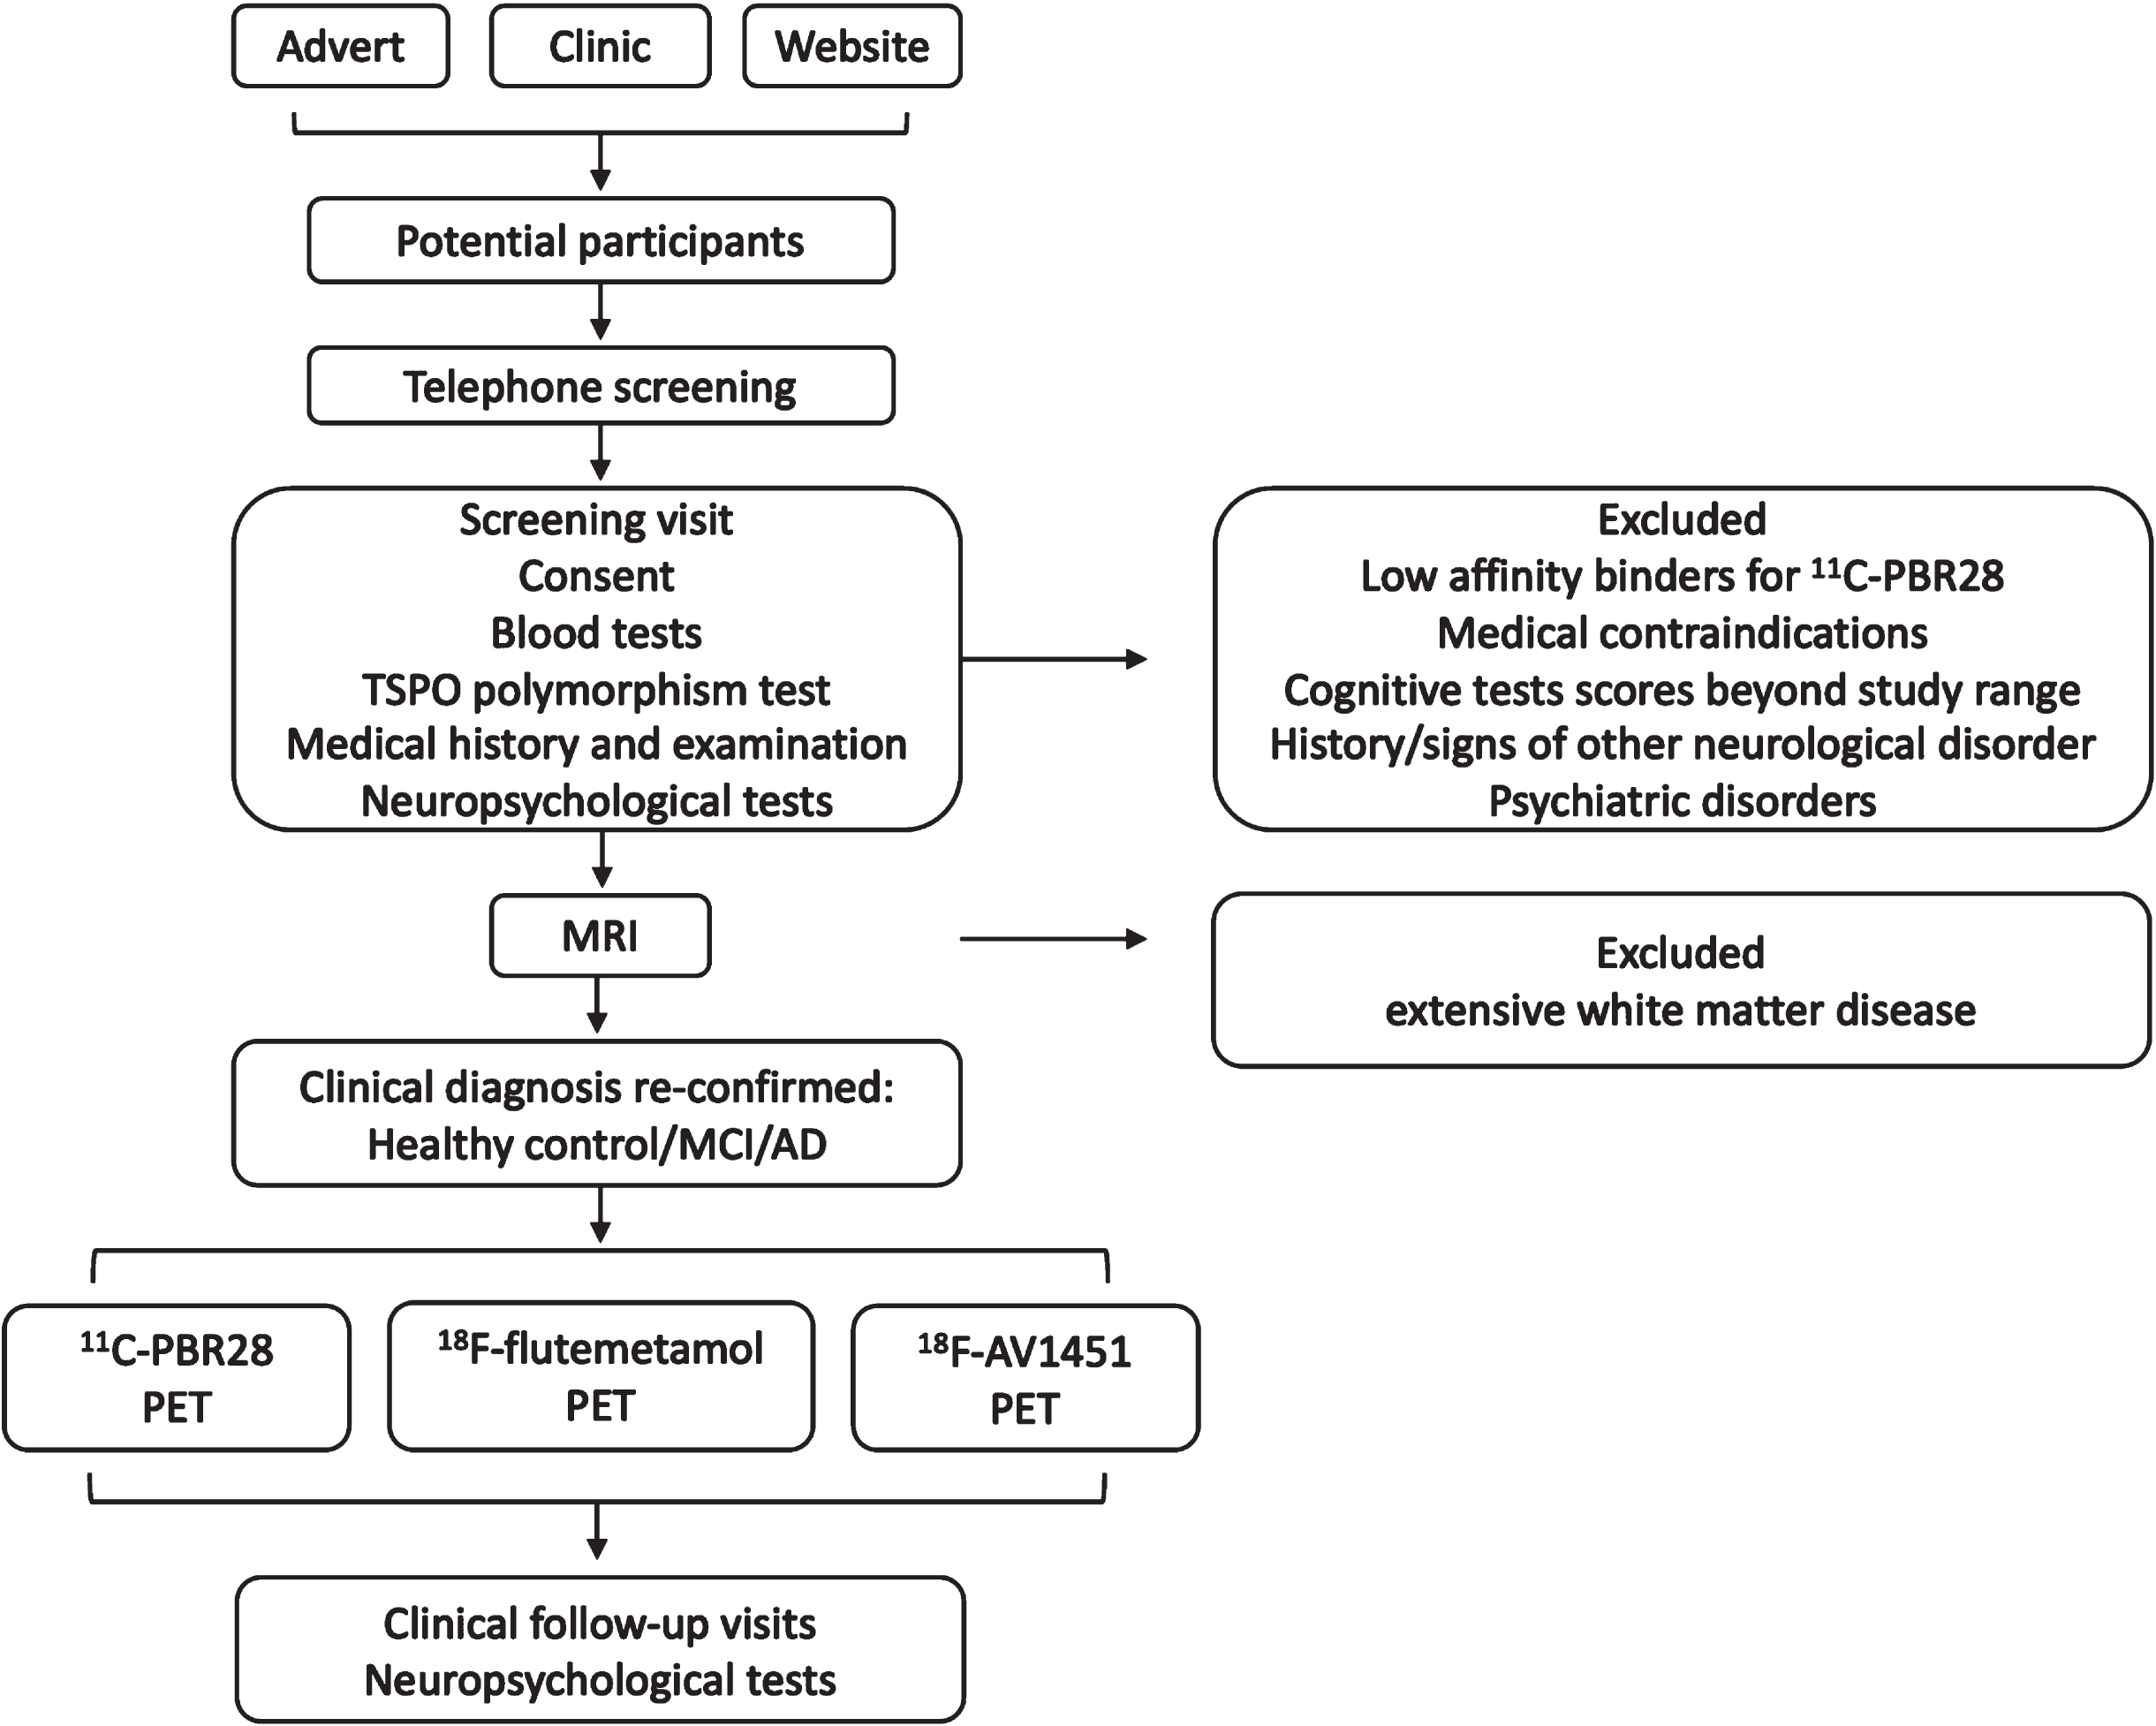
Diagram of the study protocol.
Clinical diagnosis of Alzheimer’s dementia or MCI was made based on the 2011 NIA-AA recommendations [5, 6]. Other inclusion criteria include: 50–85 years-old at study entry; Mini-Mental State Examination (MMSE) score > 24 for MCI patients, and 15 < MMSE≤24 for AD patients; >8 years of education; ability to give informed consent. We referred to Cochrane systemic review for using the 24/30 MMSE cut-off point in group separation [17].
Patients with 1) other neurological diseases, including significant brain MRI findings; 2) contraindications for MRI scanning; 3) malignancy within the last 5 years; 4) major depression; 5) homozygous 147 Thr/Thr single nucleotide polymorphism of the 18kDa translocator protein (TSPO) gene (low affinity binders of 11C-PBR28) wereexcluded.
Patient follow up
The patients were then followed up for at least 1 year with multiple neuropsychological assessments. MRI and PET images were acquired within 6 months from baseline assessment. Neuropsychological assessments were performed at each follow up visit. The scheduled follow up interval was 1 year, however, subject to practical reasons the actual follow-up intervals were not uniform among the patients (Supplementary Figure 1). Due to disease progression, AD patients overall had shorter follow-up period compared to MCI patients (Table 1).
Demographic information of the study cohort
AD, Alzheimer’s disease; MCI: mild cognitive impairment; *: p < 0.05; #: p < 0.0001 (Mann-Whitney U-test); continuous variables are presented as median (1st and 3rd quartiles).
Neuropsychological assessments
The neuropsychological assessments performed in the current study include: MMSE, Rey– Osterrieth Complex Figure Test, Wechsler Logical Memory Test (WLM), Hopkins Verbal Learning Test— revised (HVLT), semantic fluency, verbal fluency, digit span, letter-symbol sequencing, Trails Making Test A and B.
Image acquisition
11C-PBR28 PET scan
11C-PBR28 was produced by the Imanova Centre for Imaging Sciences, and PET images were acquired with a Siemens Truepoint PET/CT scanner. 330.9 (±30) MBq 11C-PBR28 in 20 ml normal saline was injected intravenously. 90-min list mode 3D dynamic acquisition data were rebinned in 8×15 s, 3×60 s, 5×120 s, 5×300 s, and 5×600 s time frames sequentially. Reconstruction was performed with a 2.6 zoom filtered back projection and a 5 mm Gaussian filter.
18F-flutemetamol PET scan
18F-flutemetamol was manufactured by GE Healthcare, Amersham, UK. Scans were performed with a Siemens Biograph 6 scanner at the Clinical Imaging Facility, Imperial College London 183.4(±5.3) MBq 18F-flutemetamol was injected intravenously in 8 ml saline followed by a 10 ml saline flush. Data were acquired in 3D list-mode 90–120 min after injection in 6x5 min frames. Filtered back projection with attenuation correction was used for reconstruction. 5 mm Gaussian smoothing was performed after reconstruction.
18F-AV1451 PET scan
18F-AV1451 was provided by Imanova Centre for Imaging Sciences, London. Scans were performed with Siemens Truepoint PET/CT scanner. 168.3 (±7.4) MBq of 18F-AV1451 was injected in 20 ml normal saline. 8×15 s, 3×60 s, 5×120 s, 5×300 s, and 8×600 s frames were acquired in 3D list-mode. Images were reconstructed using iterative reconstruction and post-construction smoothing with 5 mm Gaussian kernel.
MRI scans
MRI scans were acquired at the Clinical Imaging Facility, Imperial College London, using a 3-Tesla Siemens Verio scanner (32-channel head coil). Magnetization prepared rapid gradient echo sequence (MPRAGE) was used obtain T1-weighted brain images: TR = 230 0 ms, TE = 2.98 ms, TI = 900 ms, FOV = 256×256 mm2, 1×1×1 mm voxel. 64 diffusion gradient directions were applied to obtain the diffusion tensor imaging (DTI) images, with the following settings: TR = 9000 ms, TE = 99 ms, echo spacing = 0.72 ms, 2×2×2 mm voxel, FOV = 256×256 mm2, 62 axial slices, b-value = 1000 s/mm2.
PET images analysis
PET images were processed by SPM12 and in-house programs. PET images were realigned, and sum-images were created for spatial reference. Each subject’s T1-weighted MRI image was co-registered to the sum-image, followed by segmentation of the co-registered MRI image. Spatial transformation parameters were recorded, and the inverse transformation parameters to MNI space were applied to Hammers Atlas to generate a subject-specific ROI map in PET space. ROI map was multiplied by the binarized grey-matter mask (>0.5 probability) using nearest neighbor interpolation to create a grey-matter object map in PET space for each subject.
SUVR images were created using 80–100 min frames for 18F-AV1451 and 60–90 min frames for 11C-PBR28 and 18F-flutemetamol images, with cerebellum grey matter as reference region. The tracer SUVR at ROIs was then sampled. SUVR method with a pseudo-reference region was chosen to address the inter-subject variability issue of TSPO tracers, including the binding affinity polymorphism [18]. Data from high and medium affinity binders were combined in further analysis, as previous study has found no significant difference in clinical progression in AD and MCI subjects who are high affinity or mixed affinity binders [19].
Grey matter surface-based analysis
T1-weighted MRI images were processed using FreeSurfer V6.0 (Harvard Medical School; surfer.nmr.mgh.harvard.edu). The process includes removal of non-brain tissue, Talairach transformation, segmentation, tessellation of grey/white matter boundary, topology correction and surface deformation. Surface inflation, registration to atlas and parcellation were then performed, and the closest distance from the grey/white matter boundary to the grey matter/cerebrospinal fluid (CSF) boundary was measured as the cortical thickness at each vertex.
White matter microstructural integrity assessment
DTI images were motion corrected, eddy-current and distortion corrected (with B0 field map) using FSL’s diffusion toolbox (FMRIB Software Library, v6.0). Brain extraction and diffusion tensor fitting was then performed, followed by FSL’s tract-based spatial statistics (TBSS) processing. A fractional anisotropy (FA) threshold of 0.2 was used when FA skeletons were created. The FA values were then sampled using the ICBM-DTI-based white-matter atlas.
Statistical analysis
Statistical analyses were performed with R (R Core Team (2019), R Foundation for Statistical Computing). Group-wise comparisons were performed using Mann-Whitney U test due to small sample size.
The 18F-AV1451 SUVR in medial temporal lobe (MTL) was sampled as a marker of neurofibrillary tangle pathology. 11C-PBR28 SUVR was also sampled in MTL as a measure of neuroinflammation, based on previous observations [18]. As amyloid deposition was expected in widespread regions, 18F-flutemetamol SUVRs in bilateral frontal, temporal, parietal, occipital lobe, anterior and posterior cingulate cortices were sampled and principal component analysis (PCA) was performed to obtain a composite score of amyloid pathology. Cortical thickness in Alzheimer’s signature regions were sampled and composite measures of cortical atrophy were obtained with PCA [20]. The same process was performed for FA values in the cortical association fibers to assess white matter microstructural integrity of the neocortex. The first principal component (PC) of 18F-flutemetamol uptake (96% variance explained, Supplementary Table 1), the first 2 PCs of cortical thickness (explained 44% and 17% of total variance respectively), the first 2 PCs of white matter FA values (explained 35% and 15% of total variance respectively) were entered to further analysis (Supplementary Tables 2 and 3). PCs explaining less than 10% of total variance of each modality were not included in further analyses, to avoid overfitting and keep the model interpretable.
To interrogate the prediction values of imaging biomarkers on baseline cognitive status in cognitively impaired patients, linear mixed models were applied to the whole cohort, with intercept, time, and biomarker having fixed effects and each individual having random slope and intercept. The random effect of diagnosis (AD or MCI) on intercept was also modelled. To interrogate the prediction values of imaging biomarkers on future cognitive decline in the patients, the time-biomarker interaction terms were used in models instead of biomarkers themselves. In the process, mixed linear model fitted a regression line for each individual and test whether a variable could modify the line’s slope or intercept. If a significant time-variable interaction was found, the variable was considered to be predictive of how fast a patient deteriorated; similarly, if a variable itself was found significant in the model, it was considered to be accountable for the ‘current’ cognitive performance of a patient. The linear mixed models were fitted using the ‘lmer’ package in R and the parameter estimations were done by the restricted maximum likelihood (REML) optimizer. To ensure model convergence, different implementations of BOBYQA and Nelder-Mead algorithms were also used to check if consistent results were generated. Model REML criterion were reported along with each fitted model. Model residuals, residual distribution and datapoints leverage of each fitted mixed model were examined. As the above models were fitted in one-step, they are referred as the one-step model in the current discussion.
Due to the modest sample size, which limited the use of complex mixed-effect models, the intercepts and slopes of MMSE scores from linear mixed models were extracted and linear regression analyses were performed to 1) confirm the findings from one-step mixed linear models, and 2) select biomarkers with the highest predictive values for cognitive performance/disease progression. Linear mixed models were first applied to MCI and AD cohorts, separately, to obtain individual intercepts and slopes of cognitive score changes change, in which the intercept and time from baseline (in years) had fixed effects and each subject was allowed to have random intercept and slope. Univariate regression analyses were then performed using biomarkers as independent variables and age, gender as covariates. Model selection was performed based on Akaike information criterion (AIC) on both directions using imaging biomarkers that were suggested as possible predictors in univariate analyses (uncorrected p < 0.05), age and gender as independent variables and intercept/slope as dependent variables. The same analyses were also performed in MCI patients. False discovery rate (FDR) corrections were performed with corrected p < 0.05 considered significant. The analysis procedure is demonstrated in Fig. 2.
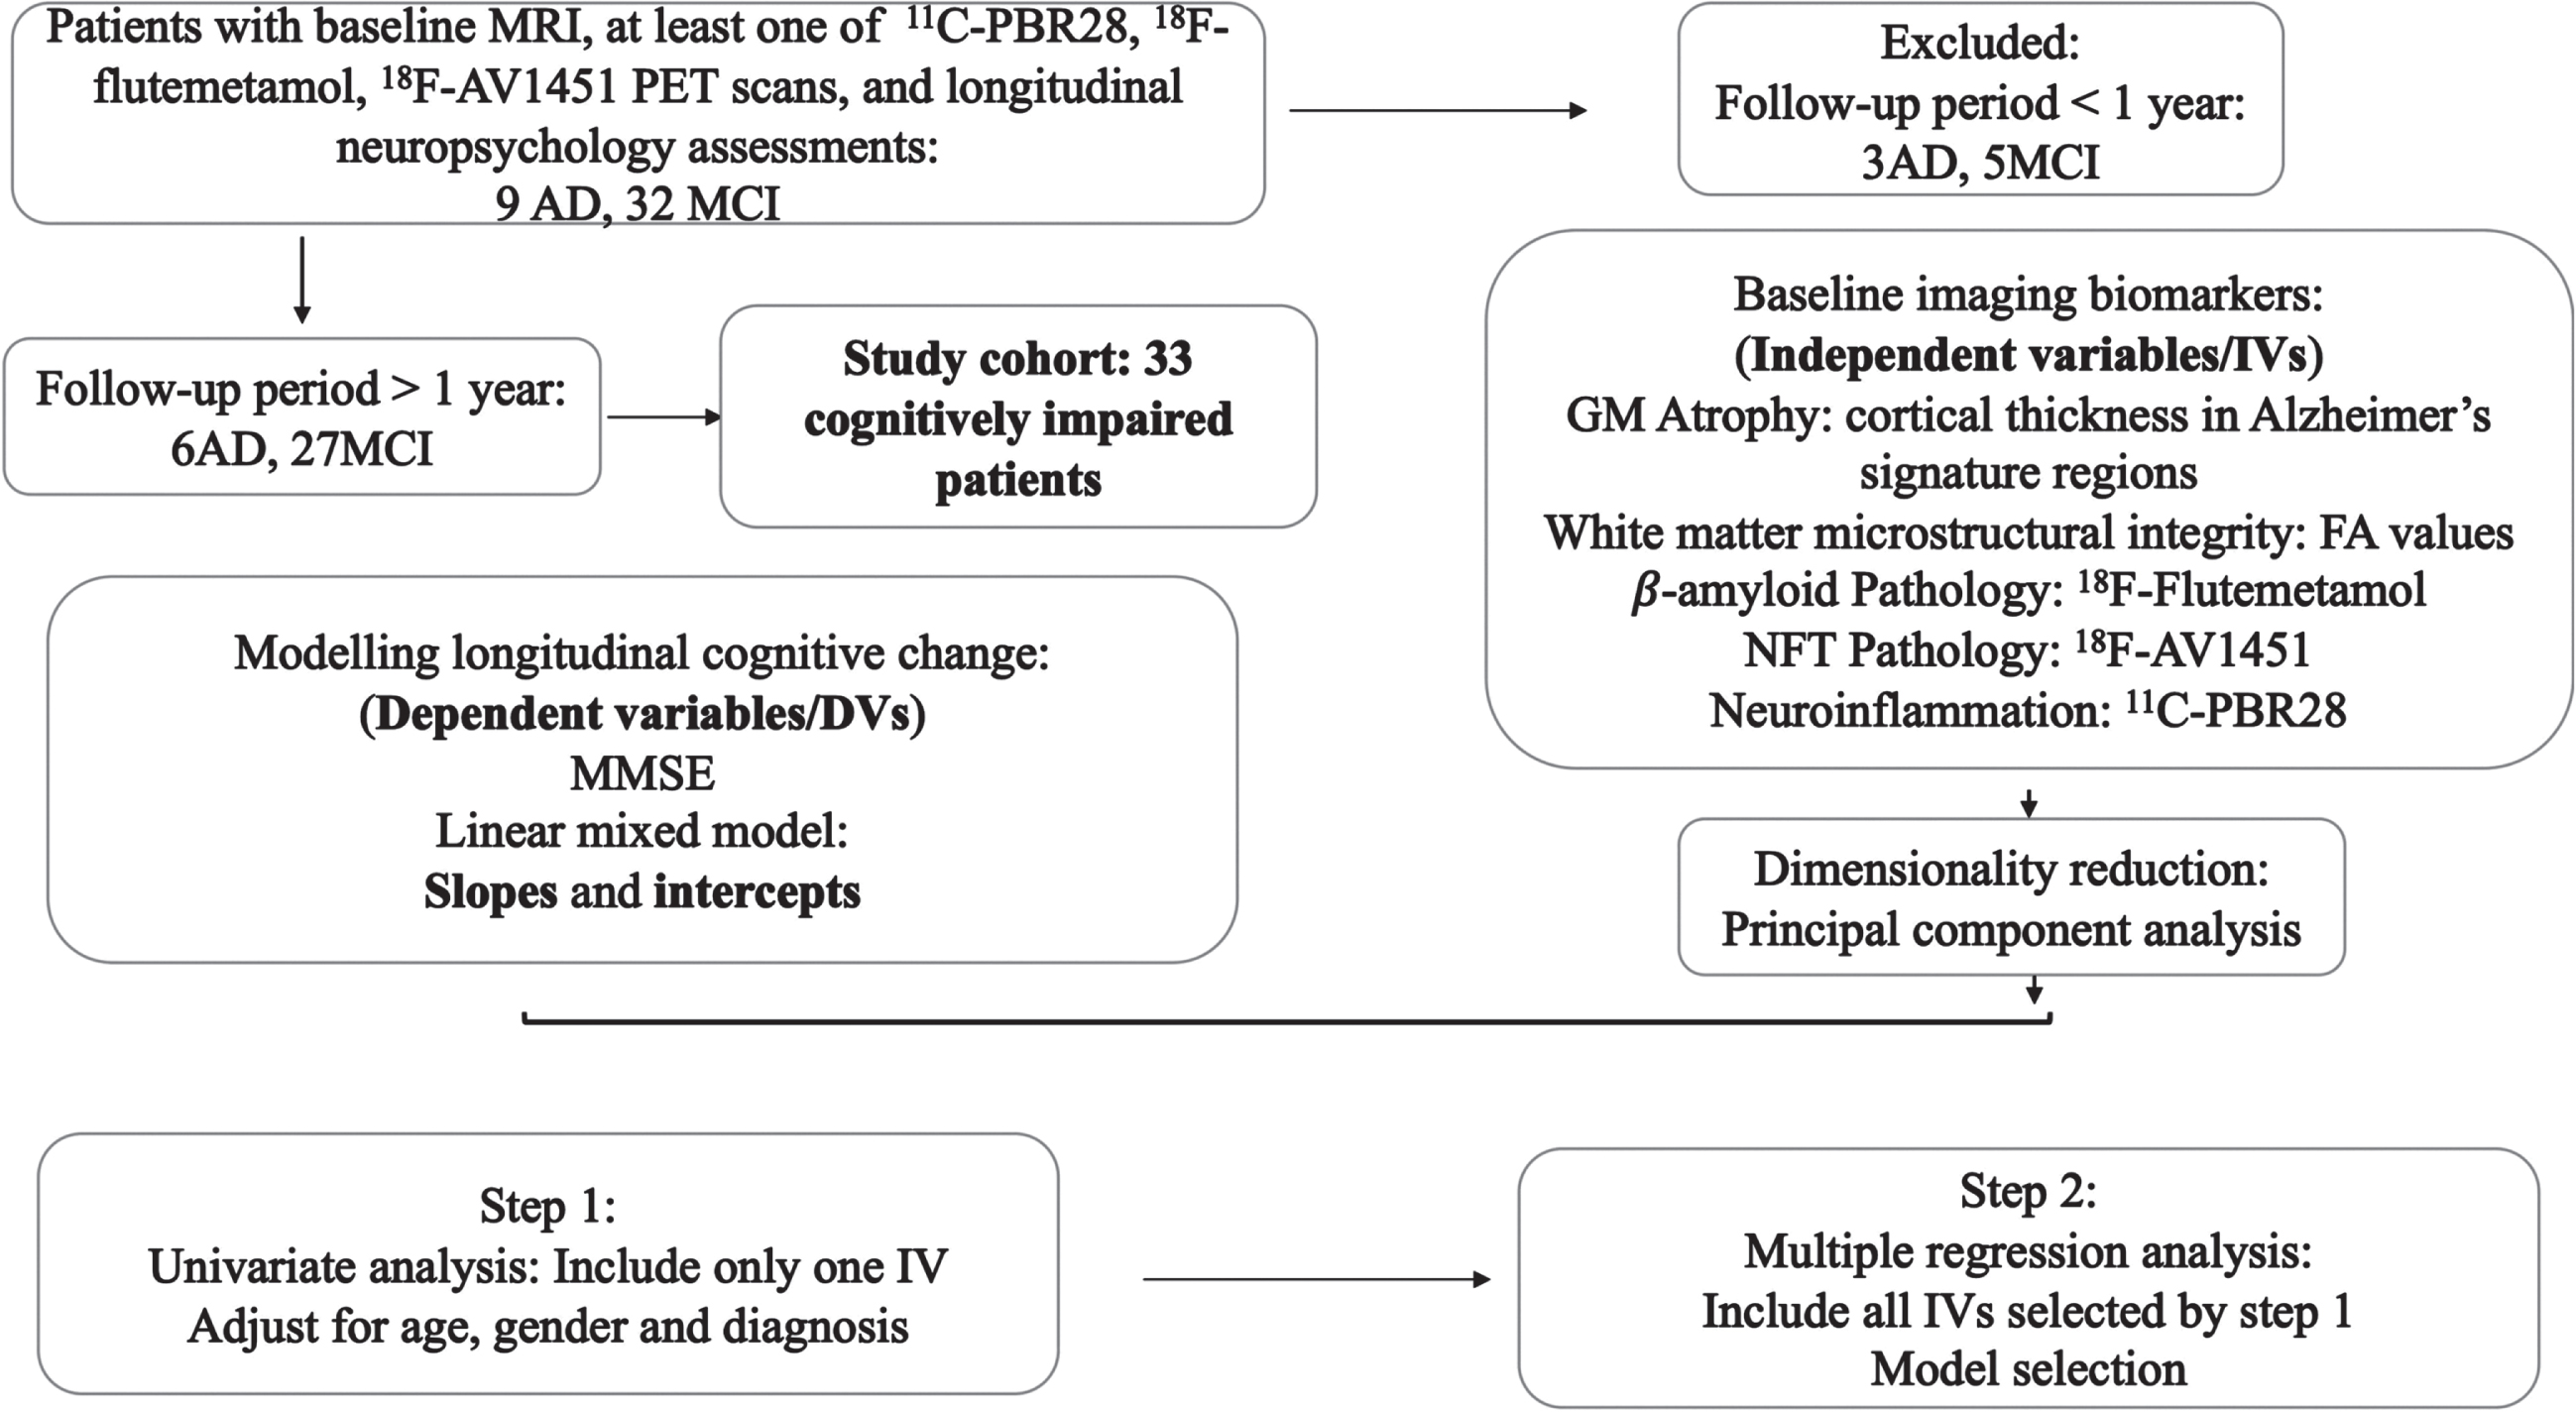
Diagram of the analysis process.
RESULTS
Demographics of study cohort
6 AD and 27 MCI patients who have been followed up for at least 1 year and had baseline MRI plus at least one PET imaging modality scan were included in this study. The availability of imaging data, baseline demographic and cognitive information has been summarized in Table 1. 23 patients (18 MCI and 5 AD) patients had both baseline 18F-flutemetamol and 11C-PBR28 PET scans, and 12 (8 MCI and 4 AD) out of them also had 18F-AV1451 PET scan, enabling multiple regression analysis. The median follow-up visits were 2 and 3 times for AD and MCI participants, respectively, and the median follow-up periods were 1.4 and 2.3 years for each group. The median baseline MMSE score were 24 for AD patients and 29 for MCI patients, and the median slope of MMSE score (annual change) were –0.60 for AD patients and –0.40 for MCI patients (Supplementary Figure 1). Of note, the 6 AD patients were all male and 18 out of the 27 MCI patients were female.
Univariate analysis on cognitively impaired patients
Linear mixed model found association fiber FA PC1 and PC2 (white matter microstructural integrity) had a positive effect on MMSE intercept, while MTL 11C-PBR28 uptake had a negative effect in respective models. However, they did not survive the FDR correction (Table 2). None of the time-MRI interaction terms (indicating the biomarkers’ influence on slope of cognitive decline) had significant effects in respective models. In contrast, the interaction between time and 18F-flutemetamol PC (n = 31, β= –0.55, 95% CI –0.82∼–0.30, p = 0.00039, p_corr = 0.0027), time and MTL 11C-PBR28 uptake (n = 26, β=–4.76, 95% CI –8.03∼–1.72, p = 0.0064, p_corr = 0.022), time and MTL 18F-AV1451 uptake (n = 18, β=–1.77, 95% CI –3.54∼–0.49, p = 0.016, p_corr = 0.037) all had significant negative effects in the models. 2-step linear regression (age and gender corrected) confirmed the above findings (Fig. 3 and Supplementary Table 4). Similar interactions between the three PET markers and time were obtained from mixed linear model analyses on HTLV delayed recall scores and WLM delayed recall scores (Supplementary Figure 2 and Supplementary Table 5).
Linear mixed model estimation of fixed effects of imaging biomarkers on cognition trajectory in cognitively impaired patients
PC, principal component; MTL, medial temporal lobe; CI, confidence interval. REML, residual maximum likelihood. Parameters are estimated using the following model: MMSE ∼ Intercept+β1 * Time +β2 * Term + (1 | Diagnosis) + (Time | Subject). A:B denotes interaction between variables A and B; note the above formulae could be reorganized as MMSE∼(1 +β2 * Biomarker) * Intercept +β1; *; Time + (1 | Diagnosis) + (Time | Subject) if the tested term is biomarker itself or MMSE∼Intercept + (β2 * Biomarker +β1) * Time + (1 | Diagnosis) + (Time | Subject) if the tested term is biomarker-time interaction. p < 0.05 (uncorrected); *p < 0.05 (FDR corrected).
Linear regression model selection in cognitively impaired patients
PC, principal component; MTL, medial temporal lobe; CI, confidence interval; Std. β, standardized β. Model selection was performed based on Akaike information criterion (AIC) on both directions. The model that has the lowest AIC value is selected as the final model. Age and gender were corrected in all models. *p <; 0.05.

Regression plot between imaging biomarkers and cognitive performance. A) Relationship between white matter integrity marker (FA values PC1) and baseline MMSE; B) Relationship between NFT pathology marker (18F-AV1451 uptake in medial temporal lobe) and rate of MMSE decline; C) Relationship between amyloid pathology marker (18F-flutemetamol uptake in the cortex) and rate of MMSE decline; D) Relationship between neuroinflammation pathology marker (11C-PBR28 uptake in medial temporal lobe) and rate of MMSE decline. Residuals after adjusting for age and gender is shown in the plot. MTL, medial temporal lobe; FA, fractional anisotropy; PC, principal component.
Multiple regression and model selection in cognitively impaired patients
Multiple regression model selection in cognitively impaired patients suggested that FA values PC1 was predictive for MMSE intercept (N = 31, Adjusted r2 = 0.39, F = 9.1, p = 0.0009, FA PC1 standardized β= 0.41, p = 0.009, corrected for age and gender). Both MTL 11C-PBR28 SUVR (standardized β= –0.61, p = 0.001) and 18F-flutemetamol PC (standardized β=–0.41, p = 0.029) were found as significant predictors for the slope of MMSE decline (N = 23, Adjusted r2 = 0.52, F = 7.23, p = 0.0003), with age and gender corrected. The above findings suggest that MRI markers of grey matter and white matter structural integrity are well associated with the current cognitive status, while PET markers of underlying amyloid pathology and neuroinflammation are predictive of future disease progression in cognitively impaired patients.
To address the concern that MTL 11C-PBR28 SUVR is a mere proxy to tau pathology (i.e. neuroinflammation is a bystander associated with NFT pathology), a subset analysis was performed with all three PET biomarkers included (N = 12). Interestingly, while MTL 18F-AV1451 SUVR was the first variable included in AIC model selection, and all three PET markers were included in the final model (Adjusted r2 = 0.82, F = 14.21, p = 0.001, model selection process illustrated in Supplementary Figure 3), only MTL 11C-PBR28 SUVR had significant weight out of the three PET markers in the final model (standardized β= –0.71, p = 0.005, age and gender corrected). This finding suggests that while NFT pathology and neuroinflammation may have overlapping effect on disease progression, neuroinflammation also has unique contribution to the process that is independent of NFT pathology.
Analyses in mild cognitive impairment patients
Univariate regression analysis in MCI patients only provided similar results as in all cognitively impaired patients. All three PET biomarkers were found to be negatively associated with the slope (higher tracer uptake, faster cognitive decline), but not the intercept of MMSE trajectory. FA PC1 and FA PC2 were associated with MMSE intercept but did not survive FDR correction (age and gender corrected, Supplementary Table 6). Model selection suggested both FA PC1 and FA PC2 were predictive of MMSE intercept (Adjusted R2 = 0.29, F = 5.98, p = 0.008), with FA PC2 having significant weight (standardized β= 0.43, p = 0.023). Both MTL 11C-PBR28 SUVR (standardized β= –0.43, p = 0.006) and 18F-flutemetamol PC (standardized β= –0.72, p = 0.0001) were selected as significant predictors for the slope of MMSE decline (N = 18, Adjusted r2 = 0.70, F = 11.39, p = 0.0003), with age and gender also corrected (Supplementary Table 7 and Supplementary Figure 3). These findings confirmed the previous findings in all cognitively impaired patents, emphasizing the predictive value of MRI markers on current cognition, and the predictive value of molecular imaging markers on future disease progression.
DISCUSSION
In the current cohort study on clinically diagnosed AD and MCI patients, we examined the predictive value of imaging biomarkers of AD on disease progression, specifically, T1-weighted and diffusion MRI (neurodegeneration), 18F-flutemetamol (amyloid deposition), 18F-AV1451 (NFT pathology), and 11C-PBR28 (neuroinflammation) PET. We observed that neurodegeneration markers are more closely associated with the cognitive performance at time of assessment, while the PET markers were better predictive of disease progression, highlighting both the diagnostic and prognostic value of disease-specific markers. More interestingly, we found PET marker of neuroinflammation to be predictive of cognitive deterioration, independently of amyloid deposition and tau pathology. Our findings support the hypothesis that neuroinflammation is a unique driving force of AD in humans and suggest the inclusion of neuroinflammation biomarkers in the current framework of disease.
In the current study, we have found white matter integrity is associated with cognition at the time of assessment in AD and MCI patients, suggesting a direct link between neuronal damage and cognitive decline. Interestingly, in the current study cohort, white matter integrity outperformed grey matter atrophy in predicting cognition performance, suggesting that white matter microstructural assessment by DTI might be more sensitive to early changes in disease continuum. Indeed, previous studies have found white matter microstructural alterations before cortical atrophy could be detected in pre-clinical AD and MCI patients [21–23]. On the other hand, PET biomarkers of pathological processes were not associated with cognition at the time of assessment, suggesting that the pathological processes themselves might not directly influence cognition, but their effects could be mediated by neuronal damage [24].
In contrast to the above findings, PET markers of amyloid deposition, NFT pathology and neuroinflammation outperformed MRI markers of neurodegeneration in predicting longitudinal cognitive decline, in that they were found to be predictive of steeper slope of decline. This finding suggests that molecular imaging markers can better reflect the driving force of AD, i.e., the disease-specific pathological processes. Furthermore, the multivariable analysis provided evidence that neuroinflammation is independently associated with disease progression, when amyloid and tau pathologies are simultaneously considered, indicating that neuroinflammation is a unique driving force in the disease process. Interestingly, in our previous study we have found an inverse relationship between neuroinflammation and white matter integrity at network level, reinforcing the idea that neuroinflammation could be an upstream event to white matter damage, and eventually cognitive decline [25].
It has been established that the proinflammatory cytokines secreted by activated microglia, such as IL-6, IL-1β, and TNF can cause functional disruption and structural damage to neurons [26]. More recent studies have demonstrated the excessive synaptic pruning by microglia in animal models of AD, which leads to synaptic loss and impaired long-term potentiation [27, 28].
Evidence of neuroinflammation has been found even at pre-plaque stage in preclinical models of AD and MCI patients. A human postmortem study has also observed microglial activation in all asymptomatic subjects with evidence of amyloidosis, which strongly suggest neuroinflammation as a necessary condition for AD pathogenesis [29]. Genome-wide association studies have further substantiated the position of neuroinflammation in AD pathogenesis, with the finding that mutations in microglial/innate immune genes are strongly associated with increased risk of AD, including CD33, TREM2, complement receptor type 1 [30–32]. Clinical PET/MRI studies using TSPO tracers have reported negative associations between microglial activation and hippocampal volume/metabolism in patients with AD dementia [33, 34]. More recent imaging studies have also observed that microglial activation correlates with disruption of the brain’s functional connectivity [35, 36]. Negative associations between neuroinflammation and cognitive performance have been further reported in AD dementia patients[37–39].
However, there has been limited evidence on predictive values of neuroinflammation on cognitive trajectory in AD continuum, with few longitudinal studies with TSPO PET reporting diverse observations [16, 40–42]. While it has been recently reported that CSF sTREM2, a marker of microglial TREM2 signaling, is associated with slower cognitive decline in MCI and AD patients, our results, together with those of Malpetti and colleagues [16], point to a negative impact of neuroinflammation on cognitive decline in AD and MCI patients using PET imaging with 11C-PBR28 and 11C-PK11195, respectively. The reason for the discrepancy between studies using PET imaging and CSF markers might be that the TREM2 pathway could modulate pro-inflammatory response of microglia and upregulate phagocytosis [43]. In other words, while PET imaging with TSPO tracers cannot differentiate the phenotypes of microglia, TREM2 activation markers may reflect the balance between anti-inflammatory and pro-inflammatory phenotypes of microglia in the spectrum of microglial activation. The inability of TSPO tracers to distinguish microglial phenotypes (and even between activated microglia, astrocytes and macrophages), may have also led to conflicting findings of imaging studies on different cohorts [41, 42]. As such, CSF markers of sTREM2 and PET may complement each other and form a pair of biomarkers for comprehensive evaluation of microglial activation/neuroinflammation, and further studies interrogating the relationship between sTREM2 and TSPO markers at different stages of the disease, and whether a weighted measure of sTREM2 and TSPO can better predict cognition/neuronal injury are strongly encouraged.
The limitation of the study is the small cohort size, limited 18F-AV1451 data and the unbalanced gender distribution in AD and MCI cohorts. The lack of female participants in AD study group could undermine the generalizability of current findings. While efforts were made to account for the effect of gender in statistical analysis, they could not be expected to eliminate the bias, especially with the significant role of biological sex differences in AD pathogenesis considered [44–46]. It should also be noted that due to our small number cases, the normality assumptions of models might have not been perfectly met as in a larger data set, so caution should be taken when evaluating the strength of current evidence. With the limitations considered, we hope this study has provided insights into the role of neuroinflammation and other pathological substrates in the disease progression, but further studies with larger and gender balanced cohorts are required to further interrogate the findings from current study. In addition, while no constraint was put on amyloid and tau status in the study cohort, the limited cohort size limited our ability to further explore possible prognostic factors in amyloid and/or tau negative dementia patients, i.e., those who are currently categorized into the ‘suspected non-Alzheimer’s pathology’ disease group [47, 48]. Further efforts may be made to further elucidate the pathological mechanisms underlying this unique population.
11C-PBR28 used in the current study is a second-generation radio-labelled ligand for the 18 kDa translocator protein (TSPO), with the following limitations to be considered. Firstly, TSPO is an inner mitochondrial membrane protein expressed in various types of cells including microglia, astrocytes, endothelial cells, monocytes and macrophages [49]. While evidence suggests that in neurodegenerative diseases, TSPO is mainly upregulated and expressed in activated microglia, this process is neither cell-specific nor disease-specific: various pathological stimuli could induce TSPO upregulation [50], and the stimuli-induced expression is not limited to microglia [51]. Secondly, in vivo imaging using TSPO tracers could not distinguish different microglia phenotypes, which is a topic of increasing research interest in neurodegenerative diseases: evidence has suggested that different phenotypes of microglia might play opposite roles in AD in terms of neuroprotection or destruction [12]. While we have made a postulation that in cognitively impaired patients, most of microglia might have already transformed into a more deleterious ‘M1’ or pro-inflammatory phenotype, further studies are needed to examine microglial phenotypical change, and its influence on disease progression along AD continuum. Lastly, the spatial and temporal evolution of innate immune response along disease trajectory is an area of great research interest [52]. Imaging studies have suggested that the temporal behavior of inflammatory response may itself determine how the disease progresses [42]. The aforementioned limitations must be taken into account when interpreting the findings from the current study, and further research effort should be encouraged to decipher the complex spatial-temporal-phenotypical development of immune response along Alzheimer’s trajectory, as well as its relationship with A/T/N componentsof AD.
To summarize, the current analysis has identified MRI imaging markers of neurodegeneration to be most closely related to cognition at the point of assessment, while PET markers of amyloid deposition, NFT pathology and neuroinflammation are strongly predictive for disease deterioration in clinically diagnosed AD and MCI patients. The current study highlighted the value of PET markers in disease diagnosis and evaluating the risk of disease progression and suggested that neuroinflammation is potentially involved in AD progression. Further investigations are encouraged to test the prognostic value of imaging and fluid biomarkers of neuroinflammation at across AD continuum as well as in various subtypes of the disease.
AUTHOR CONTRIBUTIONS
Fangda Leng (Data curation; Formal analysis; Methodology; Visualization; Writing – original draft); Rainer Hinz (Methodology; Software; Supervision; Writing – review & editing); Steve Gentleman (Methodology; Supervision; Writing – review & editing); Melanie Dani (Data curation; Investigation; Project administration); David J. Brooks (Conceptualization; Supervision; Writing – review & editing); Paul Edison (Conceptualization; Funding acquisition; Investigation; Project administration; Supervision; Writing – review & editing).
Footnotes
ACKNOWLEDGMENTS
We thank Medical Research Council and Alzheimer’s Research, UK for the generous funding.
We thank all the staff working at Imperial College Imaging Facility and NIHR Imperial Clinical Research Facility for their support for the study.
FUNDING
This research was co-funded by the NIHR Imperial Biomedical Research Centre and was supported by the NIHR Imperial Clinical Research Facility.
CONFLICT OF INTEREST
Dr. Leng, Dr. Hinz, Prof. Gentleman, Dr. Dani, and Prof. Brooks have no competing interest to declare. Dr. Edison (P.E.) was funded by the Medical Research Council and now by Higher Education Funding Council for England (HEFCE). He has also received grants from Alzheimer’s Research, UK, Alzheimer’s Drug Discovery Foundation, Alzheimer’s Society, UK, Alzheimer’s Association, US, Medical Research Council, UK, Novo Nordisk, Piramal Life Sciences and GE Healthcare. P.E. is a consultant to Roche, Pfizer and Novo Nordisk. He has received speaker fees from Novo Nordisk, Pfizer, Nordea, Piramal Life Science. He has received educational and research grants from GE Healthcare, Novo Nordisk, Piramal Life Science/Life Molecular Imaging, Avid Radiopharmaceuticals and Eli Lilly. He is an external consultant to Novo Nordisk, Pfizer, Roche, and Biohaven.
DATA AVAILABILITY
The data that support the findings of this study are available on reasonable request from the corresponding author. The data are not publicly available due to privacy and ethical restrictions.