
Abstract
Background:
Primary progressive aphasia (PPA) is a heterogeneous syndrome that is difficult to diagnose at early stages. Plasma neurofilament light chain (NFL) has been proposed as a potential biomarker for PPA.
Objective:
To examine the diagnostic properties of plasma NFL in PPA and to evaluate its association with clinical stages of the disease and brain metabolism.
Methods:
Our study included 80 participants (13 with non-fluent, 12 with semantic, and 16 with logopenic variant PPA; 13 with amnestic Alzheimer’s disease [AD]; 13 with behavioral variant frontotemporal dementia; and 13 healthy controls). Plasma NFL concentration was measured using a high-sensitivity enzyme-linked immunosorbent assay (ELISA) kit. PET imaging was performed in a subgroup of patients.
Results:
NFL discriminated patients from controls with an area under the curve of 0.914 (95% CI, 0.843–0.984; p < 0.001) (cut-off: 76.46 pg/mL; 94% sensitivity, 76.9% specificity). There were no significant differences between clinical syndromes (PPA subtypes), the main clinical forms of dementia (frontotemporal dementia and AD), or the expected pathological groups (frontotemporal lobar degeneration-tau [FTLD-tau], FTLD-TDP43, and AD). NFL levels showed weak to moderate correlations with age and functional scale score. We found no significant correlation with the extent of hypometabolism observed on FDG-PET images.
Conclusion:
Plasma NFL is a non-specific marker of neurodegeneration, and may be helpful in the diagnosis of PPA. However, NFL does not permit differential diagnosis between PPA subtypes and is not correlated with the extent of neurodegeneration.
Keywords
INTRODUCTION
Primary progressive aphasia (PPA) is a clinical syndrome encompassing a heterogeneous group of neurodegenerative diseases, including several forms of frontotemporal lobar degeneration (FTLD) and Alzheimer’s disease (AD) [1]. According to the consensus diagnostic criteria, three main clinical syndromes are recognized: the non-fluent, semantic, and logopenic variants [1]. Interestingly, each variant is linked to a specific neuropathology [2]. Although the correlation with neuropathology is far from complete, PPA is a good model for the study of neurodegeneration [3, 4]. In addition, as in other neurodegenerative syndromes, diagnosis in early stages often represents a challenge. Therefore, there is an urgent need for biomarkers to assist in the diagnosis of PPA and its variants.
Neurofilament light chain (NFL) has been recently proposed as a promising biomarker of neurodegeneration [5]. Neurofilaments are abundant proteins expressed in neurons that are increased in the setting of neuroaxonal injury of several origins (neurodegeneration, inflammation, trauma, etc.). Neurofilaments belong to the intermediate filament family proteins, and they have several subunits including NFL, neurofilament medium chain, neurofilament heavy chain, alpha-internexin, and peripherin [5]. Among these, NFL is the most common and has been the most studied subunit as a biomarker. Elevation of neurofilaments is regarded as specific of neuronal damage, independently of the specific etiology. NFL can be determined in cerebrospinal fluid (CSF), serum, or plasma [6]; intriguingly, the strong correlation observed between CSF and blood NFL levels constitutes an advantage over other biomarkers that need to be measured in CSF [7, 8]. Furthermore, methods of detection of NFL have been improved in recent years, increasing the chance for clinical use.
To our knowledge, only one study has focused specifically on the utility of serum NFL determination in PPA, showing that NFL may discriminate between non-fluent and semantic versus logopenic aphasia with 81% sensitivity and 67% specificity [9]. Other studies measuring CSF or serum NFL levels have also included some patients with PPA, with variable results [7, 10]. Another open question in the literature is the association between NFL levels and the clinical stage or the extent of neurodegeneration, as well as the question of whether NFL reflects the preferential involvement of particular brain regions.
In this study, we analyzed the clinical utility and metabolic correlates of plasma NFL in a cohort of patients with PPA and related disorders, in several stages of the disease. Our aims were threefold: first, to examine the diagnostic properties and the differences between the clinical subtypes; second, to evaluate whether NFL levels are linked to more advanced stages of the diseases; and third, to assess whether specific brain regions are more strongly correlated with NFL levels than others.
MATERIALS AND METHODS
Study population
Forty-one patients with PPA were enrolled in the study. They were classified as having non-fluent variant PPA (nfvPPA; n = 13), semantic variant PPA (svPPA; n = 12), or logopenic variant PPA (lvPPA; n = 16). For comparison, we included 13 healthy controls (HC), 13 patients with amnestic presentation of AD (aAD), and 13 patients with behavioral variant frontotemporal dementia (bvFTD). HCs were recruited from among spouses and healthy volunteers without neurological complaints, and were followed up for at least one year after plasma extraction, without developing any neurodegenerative or neurological disorder. Patients were also categorized into the following groups: AD (including lvPPA and aAD) and FTD (comprising nfvPPA, svPPA, and bvFTD). Finally, a group of patients were classified according to the expected proteinopathy: AD (lvPPA and aAD; n = 29), FTLD-tau (patients developing features of progressive supranuclear palsy during follow-up or carrying MAPT mutations; n = 9), and FTLD-TDP43 (those with svPPA or carrying a C9orf72 repeat expansion or progranulin mutations; n = 17).
The local Clinical Research Ethics Committee approved the study protocol. All participants or their caregivers gave written informed consent.
Clinical assessment and diagnosis
All patients met the current diagnostic criteria [1, 12]. In all cases, FDG-PET confirmed the expected pattern of brain metabolism established in the diagnostic criteria for each neurodegenerative disorder. All patients had at least one year of follow-up confirming the clinical diagnosis. The neuropsychological and language assessment protocol used has been described elsewhere [13, 14]. The Clinical Dementia Rating (CDR) (global score and sum of boxes) and Frontotemporal Lobar Degeneration–modified Clinical Dementia Rating (FTLD-CDR) scales were used for staging [15, 16]. By CDR performance, participants were categorized as 0 (n = 15, 18.8%), 0.5 (n = 12, 15%), 1 (n = 19, 23.8%), 2 (n = 19, 23.8%), and 3 (n = 15, 18.8%).
Neurofilament light chain measurement
Blood samples were collected in EDTA-treated tubes. Cells were removed from plasma by centrifugation for 10 min at 1500× g. The resulting supernatant was transferred to an empty tube and centrifuged for 15 min at 2500× g in order to separate platelets from the plasma. Finally, plasma samples were stored at –80°C.
Plasma NFL concentrations were measured using a new high-sensitivity enzyme-linked immunosorbent assay (ELISA) kit for human samples (Aviva Systems Biology, San Diego, USA), according to the manufacturer’s instructions. Each plate contained a standard curve (0–100 pg/mL). All patient samples were suitably diluted to ensure they fell within the range of the standard curve; control samples were not diluted.
FDG-PET image acquisition, preprocessing, and analysis
PET images were acquired on a Siemens Biograph TruePoint PET/CT scanner, according to the European guidelines for PET brain imaging [17]. Patients fasted for at least 6 h before injection of the radiotracer (18F-fluorodeoxyglucose), which was administered intravenously (mean dose: 185 MBq). Subsequently, the patients remained at rest for 30 min. CT parameters were: 130 kVp, 40 effective mAs, and 1 rotation. Slice thickness was 3 mm, reconstruction interval 1.5 mm, and pitch 0.75 mm. Reconstruction was performed using an iterative method in three-dimensional planes, with 2 iterations and 21 subsets. Only FDG-PET images acquired from the bvFTD and PPA groups and within a time interval of less than 6 months after serum extraction were included (n = 43; 13 lvPPA, 11 nfvPPA, 10 svPPA, and 9 bvFTD). In 23 cases, FDG-PET images were acquired during follow-up and not at the first consultation.
Statistical Parametric Mapping 8 (SPM8) (The Wellcome Trust Centre for Neuroimaging, Institute of Neurology, University College of London; https://www.fil.ion.ucl.ac.uk/spm/) was used for the preprocessing and statistical analysis of images. Images were normalized to the Montreal Neurological Institute standard space using a specific FDG-PET template validated for dementia [18]. Smoothing was applied at 12 mm full width at half maximum.
A region of interest (ROI) analysis of brain metabolism was performed with the MarsBaR software (http://marsbar.sourceforge.net). A two-sample t test was performed to compare each diagnostic syndrome (nfvPPA, svPPA, lvPPA, and bvFTD) against a group of 40 age- and sex-matched controls. A family-wise error–corrected p-value <0.05 and a cluster extent threshold of k = 50 were used. Cluster extent threshold was used considering the expected number of voxels per cluster provided by SPM. Age and sex were included as covariates in the statistical model. Significant clusters were combined in a single ROI for each diagnosis (Fig. 1), and FDG uptake in these regions was used for analysis of correlation with NFL levels. Furthermore, the analysis included the following ROIs from the Anatomic Automatic Labeling atlas: anterior cingulate gyrus, caudate nucleus, parahippocampal gyrus, precuneus, posterior cingulate gyrus, gyrus rectus, superior frontal gyrus, superior and inferior parietal lobules, inferior frontal gyrus, superior and middle temporal poles, supramarginal gyrus, and thalamus [19]. False discovery rate correction was applied, with a corrected p-value <0.05 as threshold.
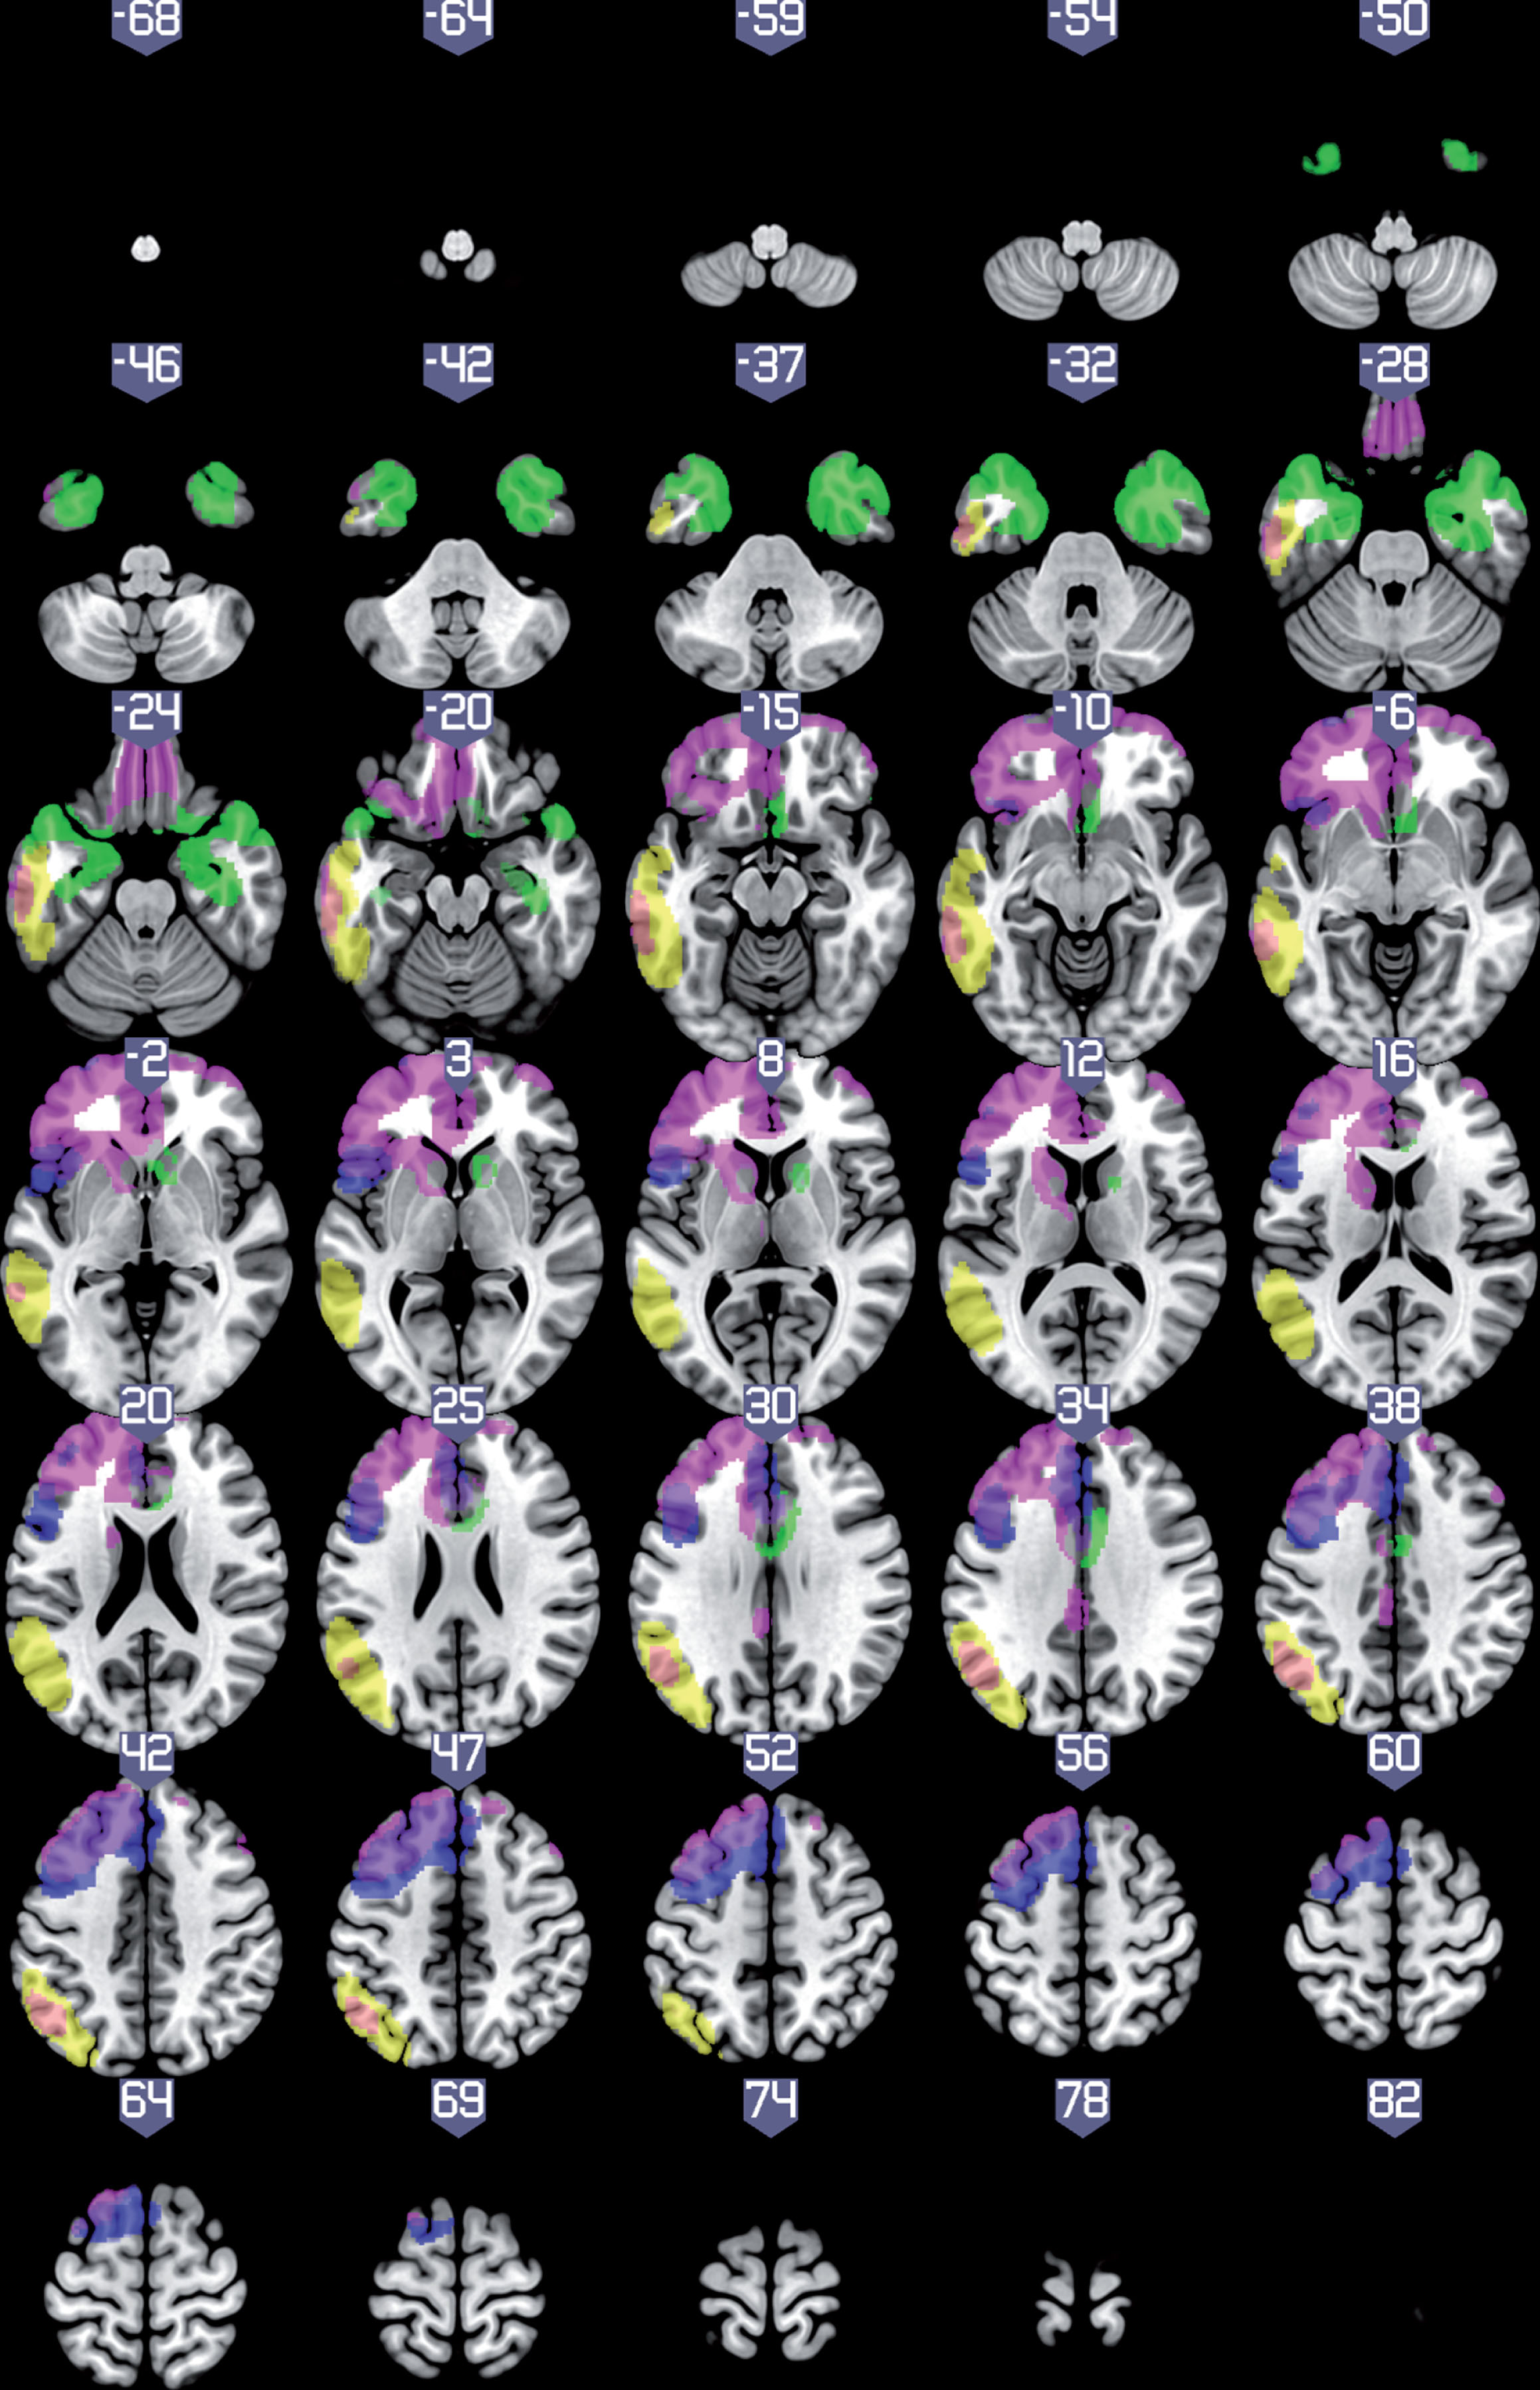
Statistical parametric map showing regions with lower metabolism in patients with each clinical syndrome compared to healthy controls (family-wise error–corrected p-value<0.05, k = 50), rendered on an MRI template with neurological orientation. Blue: non-fluent variant primary progressive aphasia (PPA); green: semantic variant PPA; yellow: logopenic variant PPA; violet: behavioral variant frontotemporal dementia.
Furthermore, a single-subject brain metabolism analysis was performed to estimate the extent of brain hypometabolism in each patient. In this case, each patient was compared to the same healthy control group using a two-sample t test with age and sex as covariates. Image intensity was scaled to the global mean metabolism for each individual, as has been recommended for single-subject SPM analyses [20]. An uncorrected p < 0.001 and k = 20 were used as threshold. The number of voxels with statistically significant differences was used as a measurement of the extent of neurodegeneration.
Statistical analysis
Statistical analysis was conducted using IBM® SPSS 20.0, R version 3.3.3, and Prism 8 GraphPad for macOS. The normality of data was evaluated with the Kolmogorov-Smirnov test. Because NFL levels showed a trend toward a non-normal distribution (Z = 1.328, p = 0.059), data were log-transformed. The Pearson correlation coefficient (r) or Spearman coefficient (rho), when appropriate, were used to calculate correlations between NFL levels and other quantitative variables. Intergroup comparisons were made with the Kruskal-Wallis H test with post-hoc Dunn analysis; the Bonferroni correction was applied to this calculation. Non-parametric tests were used because sample size of the groups was generally small (<30). Diagnostic performance was assessed using ROC curves with 95% confidence intervals (95% CI). The Youden index was used to estimate the optimal cut-off point. Statistical significance was established at p < 0.05.
RESULTS
NFL levels between groups
NFL levels were higher in patients than controls (U = 75.0, p < 0.001). The area under the curve for discriminating between patients and controls was 0.914 (95% CI, 0.843–0.984, p < 0.001). The optimal cut-off point was 76.46 pg/mL (94% sensitivity, 76.9% specificity) (Fig. 2). The area under the curve for discriminating between PPA and controls was very similar (0.919 [0.844–0.999], p < 0.001).

Receiver operating characteristic curve and optimal cut-off point for discriminating between patients and healthy controls according to neurofilament light chain (NFL) level (raw data).
A significant group effect was found for NFL when comparing AD, FTD, and HC (H = 22.91, p < 0.001) (Supplementary Table 1). Post hoc analysis revealed differences between HC and AD (p < 0.001) and between HC and FTD (p < 0.001), but not between FTD and AD (p = 0.367) (Fig. 3A).

LogNFL levels (means with 95% CI) across diagnostic groups. A) Comparison between HC, AD, and FTD. B) Comparison between diagnostic groups (HC, lvPPA, aAD, nfvPPA, svPPA, bvFTD). C) Comparison between expected pathological groups (HC, FTLD-tau, FTLD-TDP43, and AD). aAD, amnestic presentation of Alzheimer’s disease; AD, Alzheimer’s disease; bvFTD, behavioral variant frontotemporal dementia; FTD, frontotemporal dementia; HC, healthy controls; logNFL, log-transformed neurofilament light chain; lvPPA, logopenic variant primary progressive aphasia; nfvPPA, non-fluent variant primary progressive aphasia; svPPA, semantic variant primary progressive aphasia. **p < 0.001.
The comparison between all clinical syndromes also identified a significant group effect (H = 28.45, p < 0.001) (Table 1). Post hoc analysis showed significant differences between HC and the other diagnostic groups (all p < 0.001 except for bvFTD [p = 0.025]). Conversely, there were no significant differences between clinical syndromes (PPA variants) (Fig. 3B). No significant differences were identified in the direct comparison between lvPPA and nfvPPA/svPPA (U = 185.0, p = 0.702).
Comparison between main diagnostic groups
Data are expressed as mean±standard deviation [95% confidence intervals in NFL levels]. aAD, amnestic presentation of Alzheimer’s disease; bvFTD, behavioral variant frontotemporal dementia; CDR, Clinical Dementia Rating scale; FTLD-CDR-SOB, Frontotemporal Lobar Degeneration–modified Clinical Dementia Rating scale (sum of boxes); HC, healthy controls; logNFL, log-transformed neurofilament light chain; lvPPA, logopenic variant primary progressive aphasia; NFL, neurofilament light chain; nfvPPA, non-fluent variant primary progressive aphasia; svPPA, semantic variant primary progressive aphasia.
A significant group effect was also observed in the comparison between the expected pathological groups (H = 22.56, p < 0.001) (Supplementary Table 2). Post hoc analysis found significant differences between HC and each pathological group (FTLD-TDP43, AD, and FTLD-tau; p < 0.001 for all comparisons), but not between pathological groups (e.g., FTLD-TDP43 versus FTLD-tau) (Fig. 3C).
Correlation with clinical data and hypometabolism
In the whole sample, NFL levels were correlated with age (r = 0.325, p = 0.003). A correlation was also observed with CDR (rho = 0.365, p = 0.001) and FTLD-CDR sum of boxes scores (rho = 0.388, p < 0.001) (Fig. 4A). In contrast, CDR and FTLD-CDR scores were not correlated with age (rho = 0.053, p = 0.643 and rho = 0.033, p = 0.774, respectively). NFL levels were not correlated with the number of voxels displaying hypometabolism (r = –0.063, p = 0.690) (Fig. 4B). The number of hypometabolic voxels was correlated with CDR (rho = 0.641, p < 0.001) and FTLD-CDR sum of boxes scores (rho = 0.609, p < 0.001).
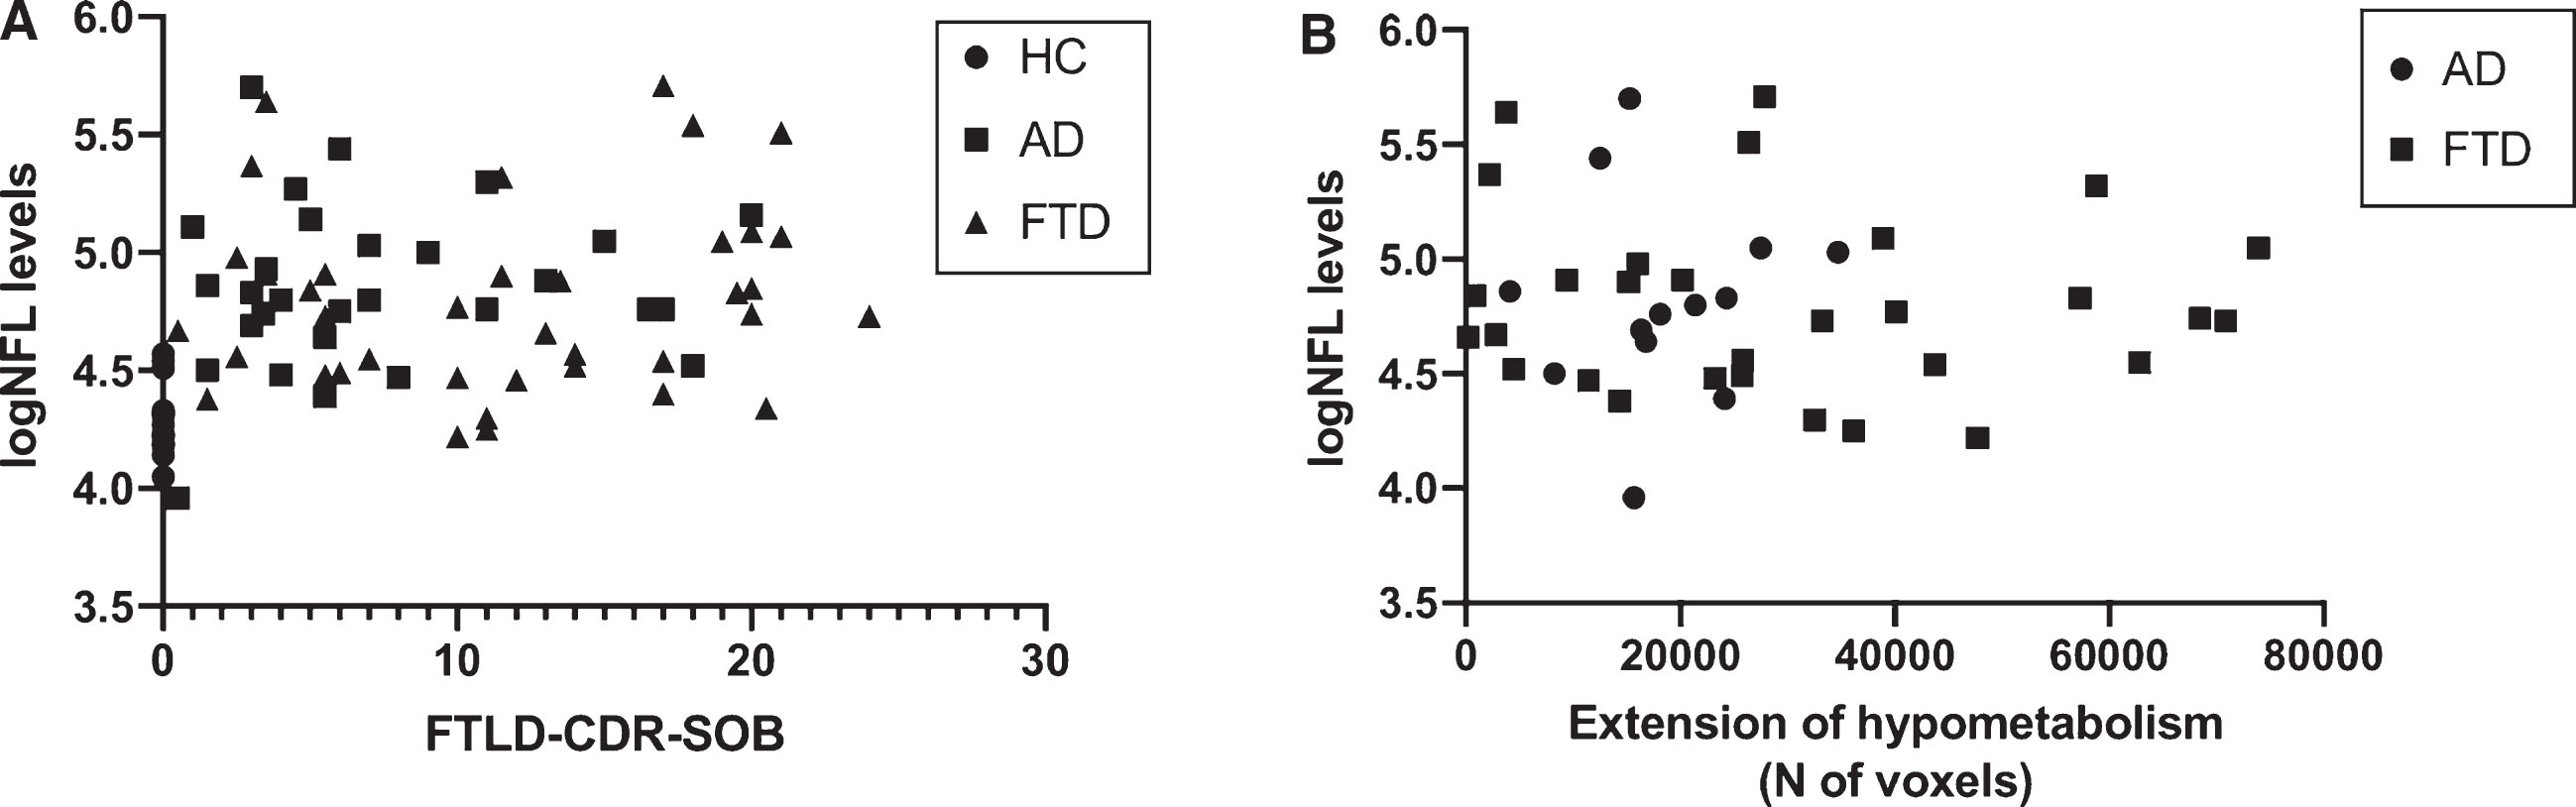
Correlation between logNFL and FTLD-CDR-SOB scores (A) and extent of hypometabolism (B). FTLD-CDR-SOB, Frontotemporal Lobar Degeneration–modified Clinical Dementia Rating scale (sum of boxes); logNFL, log-transformed neurofilament light chain.
In the PPA group, NFL levels were not correlated with scores for the CDR (rho = 0.186, p = 0.244), FTLD-CDR (rho = 0.263, p = 0.097), or the language domain of the FTLD-CDR (rho = 0.251, p = 0.114). The extent of hypometabolism (number of voxels) was not correlated with NFL (r = –0.08, p = 0.965) or FTLD-CDR language domain scores (rho = 0.158, p = 0.373), but did show a correlation with CDR (rho = 0.541, p = 0.001) and FTLD-CDR scores (rho = 0.477, p = 0.004).
Correlations with brain regions
NFL levels were inversely correlated with brain metabolism in the ROI involved in svPPA (r = –0.371, p = 0.008). Trends were observed with the ROIs associated with nfvPPA (r = –0.237, p = 0.066) and bvFTD (r = –0.246, p = 0.058). No correlation was observed with the region involved in lvPPA (r = –0.134, p = 0.199). Correlations with metabolism in other brain regions were generally weak or moderate (r < 0.35), but no correlation survived false discovery rate correction (Supplementary Table 3).
DISCUSSION
We found higher plasma NFL levels in patients with all variants of PPA than in the HC group. Amnestic AD and bvFTD showed comparable NFL levels to those observed in patients with PPA. Therefore, plasma NFL provided a very good discriminant capacity for differentiating between HC and all patients, and between HC and patients with PPA. In contrast, there were no significant differences between clinical syndromes (PPA subtypes), the main clinical forms of dementia (FTD and AD), or between the expected pathological groups (FTLD-tau, FTLD-TDP43, and AD). This suggests that plasma NFL may be a useful blood biomarker for the diagnosis of neurodegenerative diseases. This may be especially relevant in early stages of neurodegenerative diseases, when clinical symptoms are often mild or non-specific. However, our results did not support the use of plasma NFL for differential diagnosis between PPA variants or between PPA associated with AD and FTLD. Similarly, several other studies have found NFL levels to be elevated in a wide range of neurodegenerative diseases, including AD, FTD, atypical parkinsonism, and amyotrophic lateral sclerosis [5], which are pathologically associated with PPA syndromes. Although some studies report more elevated levels in some conditions, especially motor neuron disease, the existence of potential differences between clinical or pathological subtypes (TDP43 versus tau) within the FTD spectrum was hypothesized but has not consistently been demonstrated [21] (Table 2).
Main studies with NFL including patients with PPA
CSF, cerebrospinal fluid; lvPPA, logopenic variant primary progressive aphasia; NFL, neurofilament light chain; nfvPPA, non-fluent variant primary progressive aphasia; PPA, primary progressive aphasia; sens., sensitivity; spec., specificity; svPPA, semantic variant primary progressive aphasia.
Another interesting result of our study is the absence of a significant correlation between NFL levels and the extent of neurodegeneration, as shown by brain metabolism. FDG-PET is considered a reliable tool for evaluating synaptic failure and the localization and extent of neurodegeneration; to our knowledge, no previous studies correlate NFL with brain metabolism. In this regard, the extent of hypometabolism in our sample was highly correlated with functional scale scores, showing that clinical impairment increases in parallel with the number of regions involved. Conversely, correlations between functional scale scores and NFL levels were moderate or low, as has been found in other studies [21].
Regarding the correlations with brain metabolism, our results showed that NFL levels are weakly correlated with metabolism in several regions associated to different PPA subtypes and the AD-FTD spectrum. The strength of the correlation seems to be greater in regions associated with FTD (for instance, ROI associated to svPPA, the gyrus rectus, and the caudate nucleus) than those associated with AD (the posterior cingulate gyrus and ROI associated with lvPPA), which may explain the higher levels observed in FTD patients than in those with AD in some studies. This fact has been explained by certain microstructural characteristics of the frontal and temporal lobes and subcortical structures, such as axon caliber [10]. However, because the correlation is also weak in FTD, our study supports the idea that all brain regions to some extent contribute to NFL levels in the context of neurodegeneration and that NFL should not, therefore, be considered specific to certain neurodegenerative diseases [22].
Our study does have certain limitations. This is a cross-sectional study in which we included patients at all stages of disease progression in order to better capture possible changes over time [23]. On the one hand, a specific study including only patients at mild stages of PPA would be needed to confirm the high discrimination power at early stages of neurodegeneration. In this regard, studies of genetic variants of both AD and FTLD seem to indicate that NFL levels are elevated from an early stage of neurodegeneration [8, 24]. On the other hand, a longitudinal design would be appropriate for evaluating the significance of changes in NFL levels on an individual basis and their potential prognostic role. Because the distribution of males and females between diagnostic groups was different, future studies should also address the impact of this variable in NFL levels and diagnostic capacity.
Because the sample size of our study is limited, we cannot exclude the possibility of a type II error regarding the absence of statistically significant differences in NFL levels between disease groups. However, considering an effect size large or moderate (d = 0.8 or d = 0.6), with a power of 80% and an alpha = 0.05, a total sample size of n = 52 (26 per group) or n = 72 (36 per group), respectively, should be enough to detect statistically significant and clinically meaningful differences between groups such as AD and FTD. In addition, using data of previous research about serum NFL in PPA [7], a sample size of approximately 10–15 patients per group should be adequate to detect differences between PPA groups with a power of 80%.
In conclusion, our results suggest that NFL is a non-specific marker of neurodegeneration in dementia, and displays very favorable diagnostic properties in PPA. However, NFL does not permit differential diagnosis between PPA subtypes, or between PPA and aAD or bvFTD, and was not found to be correlated with the extent of neurodegeneration. The correlation with age and multiple brain regions suggests that NFL level depends on several factors, which hinders its use in differential diagnosis between neurodegenerative diseases, such as PPA variants. Future studies should assess whether NFL collection over time may have a role in monitoring at an individual level, or if combination with other plasma or serum biomarkers could provide new insight into the differential diagnosis of neurodegenerative diseases. Furthermore, direct comparison in multimodality neuroimaging studies between atrophy and hypometabolism with NFL would be interesting.
DISCLOSURE STATEMENT
Authors’ disclosures available online (https://www.j-alz.com/manuscript-disclosures/19-0838r1).