
Abstract
Currently, best-characterized indicators for Alzheimer’s disease (AD) diagnosis are the decreased levels of amyloid-β protein 42 and increased levels of phosphorylated tau in cerebrospinal fluid (CSF). The positron emission tomography (PET) imaging with Pittsburgh compound B (PiB) is also used in AD diagnosis by visualizing amyloid deposition in the brain. These methods are invasive or expensive; therefore, less invasive and easily detectable blood biomarkers are required. Because our previous study showed that flotillin release, a marker of exosomes, was attenuated by Aβ, we designed the present study to determine whether flotillin level could be reduced in CSF and/or serum of patients with AD. In this study, we analyzed flotillin levels in CSF and serum of non-AD controls, patients with AD and mild cognitive impairment (MCI) by western blotting. Flotillin levels in cerebroventricular fluid (CVF) and serum of AD, vascular dementia (VaD), and non-AD autopsy cases were also analyzed. Flotillin levels significantly decreased in the CSF and serum of AD patients compared with those of non-AD controls, respectively. Moreover, in patients with MCI due to AD determined by PiB-PET, CSF and serum flotillin levels significantly decreased compared with those of patients with MCI due to non-AD. Flotillin levels remained unchanged in CVF and serum of autopsy cases diagnosed as VaD. Serum flotillin level is negatively associated with brain amyloid deposition indicated as PiB uptake. These results demonstrate that serum flotillin level can serve as one of the blood markers for estimation of brain amyloid deposition and early diagnosis of AD.
Keywords
INTRODUCTION
An easy and early diagnostic marker for Alzheimer’s disease (AD) is not yet available [1]. Extracellular amyloid plaques and intracellular neurofibrillary tangles are the two major pathological characteristics of AD. Amyloid plaques are mainly composed of aggregated amyloid-β protein (Aβ), of 40–43 amino acids, and neurofibrillary tangles are the aggregates of the phosphorylated tau protein [2]. Aβ is cleaved from a transmembrane amyloid-β protein precursor (AβPP) by β-secretase and γ-secretase into various lengths. Aβ42 and Aβ43, the longer species, are highly prone to self-aggregation and considered to be the causative molecules for AD [3–5]. Aβ42 deposition is the most abundant species in amyloid plaques, which can be detected in the brain many years prior to AD development [6].
The decreased Aβ42 level in the cerebrospinal fluid (CSF) of AD patients [7–9], and the increased level of phosphorylated tau protein in the CSF of AD patients [7, 10] is a well-established method to help with AD diagnosis. Analyses of dominantly inherited AD reveal that CSF Aβ42 levels begin to decline as early as 25 years before AD onset and increased tau protein levels in CSF are detected 15 years before expected symptom onset [11]. Although CSF Aβ42 and tau protein levels emerge to be reliable markers for the diagnosis of AD, they are difficult to use for cognitively normal individuals or for all patients with cognitive impairment because taking CSF is invasive and requires specialized techniques.
Thus, in many studies, the association between plasma Aβ and AD onset have been examined but the findings are contradictory. A high plasma Aβ42 level or a high Aβ42/Aβ40 ratio was reported to be a risk factor for AD onset, whereas recent studies showed the opposite results [12–14]. In addition to the use of biological fluid markers, amyloid imaging using Pittsburgh compound B and positron emission tomography (PiB-PET) has become a diagnostic method for AD by detecting amyloid deposition and excluding other cause of dementia. However, the PET examination is not easily available for patients as a usual clinical examination.
Here, we aimed to find an easily detectable CSF or blood marker for AD that could indicate the level of brain Aβ deposition. Our previous study has shown that Aβ42 reduced exosome secretion demonstrated by the decreased level of flotillin, a marker of exosome [15]. Exosomes were shown to be involved in the trapping and elimination of Aβ42 and its levels were decreased in brains of APP transgenic mice and cynomolgus monkeys with aging [16, 17]. These lines of evidence led us to perform experiments to determine the levels of flotillin in CSF and serum from AD and MCI patients, and non-AD cases. Here, we report that flotillin levels are significantly decreased in CSF, cerebroventricular fluid (CVF), and serum from patients with AD. Moreover, the flotillin levels CSF and serum are lower in the patients with MCI due to AD than those in the patients with MCI due to non-AD. Our findings suggest that flotillin is a novel serum marker for the diagnosis of AD and MCI due to AD.
MATERIALS AND METHODS
CSF, serum, and CVF collection and preparation
This study was conducted with samples from the patients with Asian and the time frame of the sample collection from the patients was from 2012 to 2018. All subjects underwent clinical examination that included physical, neurologic, and neuropsychologic evaluations, 3.0T brain magnetic resonance imaging (MRI), PiB-PET, and CSF analysis. Each subject signed an informed consent form before inclusion, and the ethics committee of Oita University Hospital approved the study. All methods were performed in accordance with the relevant guidelines and regulations. Amnestic MCI was diagnosed as described in previous reports as follows [18]: 1) subjective memory complaints and objective memory impairment; 2) Mini-Mental State Examination (MMSE) scores of 24–30; 3) impairment of education-adjusted scores in delayed recall of logical memory in Wechsler’s Memory Scale Revised (WMS-R II; 0–9 years of education, 2 or lower; 10–15 years of education, 4 or lower; 16 years of education or longer, 8 or lower); 4) Clinical Dementia Rating score of 0.5; and 5) absence of significant impairment of cognitive function or activities of daily living. We excluded subjects with a history of stroke, other neurologic and psychiatric disorders (e.g., major depression, psychosis), severe head trauma, alcoholism, severe cardiac disease, arrhythmia, hepatic failure, and recent changes in medication. Information regarding age, sex, and educational level was collected, and cognitive function was assessed using MMSE, Alzheimer’s Disease Assessment Scale-cognitive component-Japanese version (ADAS-Jcog), and WMS-R II. Laboratory tests included analysis of complete blood count, urine components, blood biochemistry, thyroid hormone levels, and vitamin B1 and B12 levels.
Human CSF and serum from living AD patients, non-AD control subjects, and MCI patients were collected using standard methods. For CSF collection, 10 AD patients, 10 non-AD control subjects, 10 MCI due to AD patients, and 11 MCI due to non-AD patients visiting Oita University Hospital were enrolled (Table 1). For serum collection, 15 AD patients, 15 age-matched non-AD control subjects, 24 patients with MCI due to AD, and 18 patients with MCI due to non-AD visiting Oita University Hospital were enrolled (Table 1). AD was diagnosed according to the criteria of the National Institute of Neurological and Communicative Disorders and Stroke and the Alzheimer’s disease and Related Disorders Association (NINCDS-ADRDA) criteria for probable AD [19]. The mean±S.E.M of MMSE score of the patients with AD was 16.7±2.1, that of the patients with MCI due to AD was 24.9±1.1, that of the patients with MCI due to non-AD was 26.0±0.5, and that of normal control was 28.3±0.5. The sera were also collected from the patients with cancers, whose diagnosis is shown in Table 2.
Diagnostic categories and demographic data of the sample under study
Diagnostic categories and demographic data of samples examined
Cerebroventricular (CVF) samples were collected from 15 non-AD and 11 AD autopsy brains, and postmortem serum from 17 vascular dementia (VaD) patients and 20 AD patients were also collected (Table 3). The clinical diagnoses of AD, VaD, and non-AD was confirmed by pathological studies of the brain in Fukushimura Hospital. The samples were aliquoted and stored at –80°C until analyses. The study was examined and approved by the Ethics Committee of Fukushimura Hospital and Nagoya City University.
Diagnostic categories and demographic data of the sample under study
PMI, postmortem interval.
PET
Static 11C-PiB-PET images were acquired using a Siemens Biograph mCT40 (Siemens) in the three-dimensional scanning mode. 11C-PiB was supplied by the PET center of our hospital. X-ray computed tomography for attenuation correction was performed before PET imaging. Each patient was injected intravenously with a bolus of 11C-PiB (555±185 MBq) followed by a saline flush. Starting at 50 min post injection, PET scanning was performed for 20 min, providing 110 slices of 1.5 mm thickness that covered the entire brain. The spatial resolution at 1 cm away from the center of PET was 6.0 mm transversely and 5.7 mm axially. All imaging data were reconstructed into a 256×256 matrix and a 3× magnification with an ordered subset expectation maximization (OSEM) + point spread function (PSF) + time of flight protocol, which included six iterations and 21 subsets using a 2 mm Gaussian filter (the reconstructed images had 1.06 mm pixels).
The obtained PiB-PET images were spatially normalized to a customized PiB-PET template in the Montreal Neurological Institute reference space using Statistical Parametric Mapping 8 (Wellcome Trust Centre for Neuroimaging, London, UK). The region of interest (ROI) was analyzed using FreeSurfer (http://surfer.nmr.mgh.harvard.edu), which is an automated tool for reconstructing the brain’s cortical surface from structural MRI data [20]. Moreover, ROIs in the frontal lobes, parietotemporal lobes, and posterior cingulate gyrus were extracted using MarsBaR. The ROI values were averaged across both hemispheres. PiB uptake was assessed on the basis of a standardized uptake value ratio (SUVR), which is calculated by dividing the 11C-PiB retention level in a particular ROI by the ROI value in both cerebellar hemispheres. Mean cortical SUVR was expressed as the average SUVR of the means of the frontal lobes, parietotemporal lobes, and posterior cingulate regions. An SUVR cutoff of 1.4 was used to classify the subjects into the PiB-positive or PiB-negative subgroups.
Immunoblotting
Equal volumes of CSF and CVF (10μl) samples were dissolved in a sample buffer consisting of 100 mM Tris-HCl (pH 7.4), 10% glycerol, 4% SDS, 10% mercaptoethanol, and 0.01% bromophenol blue, and then subjected to SDS-PAGE using 10% gel. For serum, an equal volume of serum was diluted with PBS at 1 : 100 and mixed with the sampling buffer described above, and then subjected to SDS-PAGE using 10% gel. Equal volume of serum samples containing 25–30μg protein was loaded in each lane. The separated proteins were electrophoretically transferred onto PVDF membranes (Immobilon, Millipore), using a transfer buffer (0.1 M Tris, 0.192 M glycine, and 20% methanol). Membranes were then incubated overnight at 4°C in a blocking solution consisting of 5% powdered milk in TBST [10 mmole/L Tris-HCl (pH 8.0), 150 mmole/L NaCl, and 0.1% Tween 20], followed by immunoblotting with appropriate antibodies. The primary antibodies used were a rabbit anti-flotillin 1 polyclonal antibody (Sigma-Aldrich, USA) and an anti-apoE antibody (AB947), EMD Millipore Corporation, Billerica, MA, USA).
ELISA of Aβ40, Aβ42, and phosphorylated tau in human CSF and CVF
Aβ40 and Aβ42 concentrations were determined using ELISA kits (Wako Pure Chemical Industries, Osaka, Japan). Human CSF and CVF from AD patients and non-AD control subjects were added to ELISA plates precoated with an antibody (BNT77) and incubated at 4°C for 16 h. The plates were washed and incubated with specific anti-human-Aβ40 and Aβ42 monoclonal antibodies conjugated with HRP at room temperature for 30 min. Human tau phosphorylated at pS199 was quantified using an Invitrogen human tau ELISA kit (Invitrogen Corporation, Camarillo, CA, USA). Human CSF and CVF samples diluted in the provided standard diluent buffer (1 : 4) were added into the plates and incubated for 2 h at room temperature. After washing, the plates were incubated with a rabbit polyclonal anti-pS199-tau antibody for 1 h at room temperature. After washing and color development absorbance was measured at 450 nm. All samples were measured in triplicate.
Statistical analysis
Immunopositivity bands visualized by western blot analysis were quantified using Image J (NIH, USA). Results are expressed as mean±S.E.M. The statistical significance of the difference between groups was analyzed by one-way ANOVA followed by the Bonferroni multiple comparison post-hoc test. A p-value <0.05 was considered to indicate a significant difference. PiB SUVR in patients with AD, MCI-AD, MCI-non-AD, and Non-AD subjects were compared with flotillin levels in the serum collected from these subjects using Spearman’s Rho.
RESULTS
Levels of flotillin in human CSF from patients with AD and MCI patients
We have reported that Aβ42 reduces the levels of flotillin released from primary cultured astrocytes without affecting cell viability [15]. To determine whether flotillin level was altered in the brain of patients with AD, where Aβ is highly accumulated, we firstly examined the level of flotillin in CSF from patients with AD and patients with MCI. The amyloid deposition in the brain was examined by PiB-PET. All AD patients and non-AD controls were subjected to amyloid PET imaging, and AD was diagnosed in the basis of clinical criteria and the results of amyloid PET imaging. The amyloid-negative MCI patients, that is, patients with MCI due to non-AD (MCI-non-AD), served as controls for amyloid-positive MCI patients, that is, patients with MCI due to AD (MCI-AD). Flotillin levels significantly decreased by 28.4% in the AD group (Fig. 1A, C) and by 45.9% in the MCI due to AD group (Fig. 1B, D) compared with the non-AD group and MCI due to non-AD group, respectively, suggesting that brain amyloid deposition is associated with the decrease in flotillin level in CSF.

Level of flotillin in human CSF from patients with AD and MCI. Western blot analysis of CSF obtained from patients with AD, non-AD controls, MCI-non-AD, and MCI-AD was performed according to the methods described in the Methods section. A,B) Representative images demonstrated by western blot analysis are shown. Non-AD control group, n = 10; AD group, n = 10; MCI-non-AD group, n = 11; MCI-AD group, n = 10. C, D) The intensity of the flotillin bands was quantified using imaging analysis software (Image J). Intensity of each flotillin band of the non-AD (C) and MCI-non-AD group (D) was normalized by the average of intensity of non-AD and MCI-non-AD as 1. Each dot represents the relative intensity of the flotillin band. Data are mean±S.E.M. Significance of difference was determined by ANOVA. MCI-AD, MCI due to AD; MCI-non-AD, MCI due to non-AD.
Analysis of CSF Aβ, and phospho-tau (ps199) levels in AD and MCI patients
We also confirmed the known CSF markers of AD, Aβ42, and phosphorylated tau protein. As expected, Aβ42 levels significantly decreased and Aβ40 levels significantly increased in the CSF of AD patients compared with the non-AD controls (Fig. 2A, B). Phosphorylated tau protein levels in the CSF of AD patients were 2.8-fold higher than those of non-AD controls (Fig. 2C). The decrease in Aβ42 level was also found in patients with MCI due to AD compared with those with MCI due to non-AD, whereas the Aβ40 levels did not differ between these groups (Fig. 2D, E). Nevertheless, the levels of phosphorylated tau protein in the CSF of the MCI due to AD patients were significantly higher than that of the MCI due to non-AD patients (Fig. 2F). These results suggest that the decrease in CSF Aβ42 level consistently occurs not only in the AD patients, but also in the MCI-due to AD patients, and is closely associated with brain amyloid deposition.
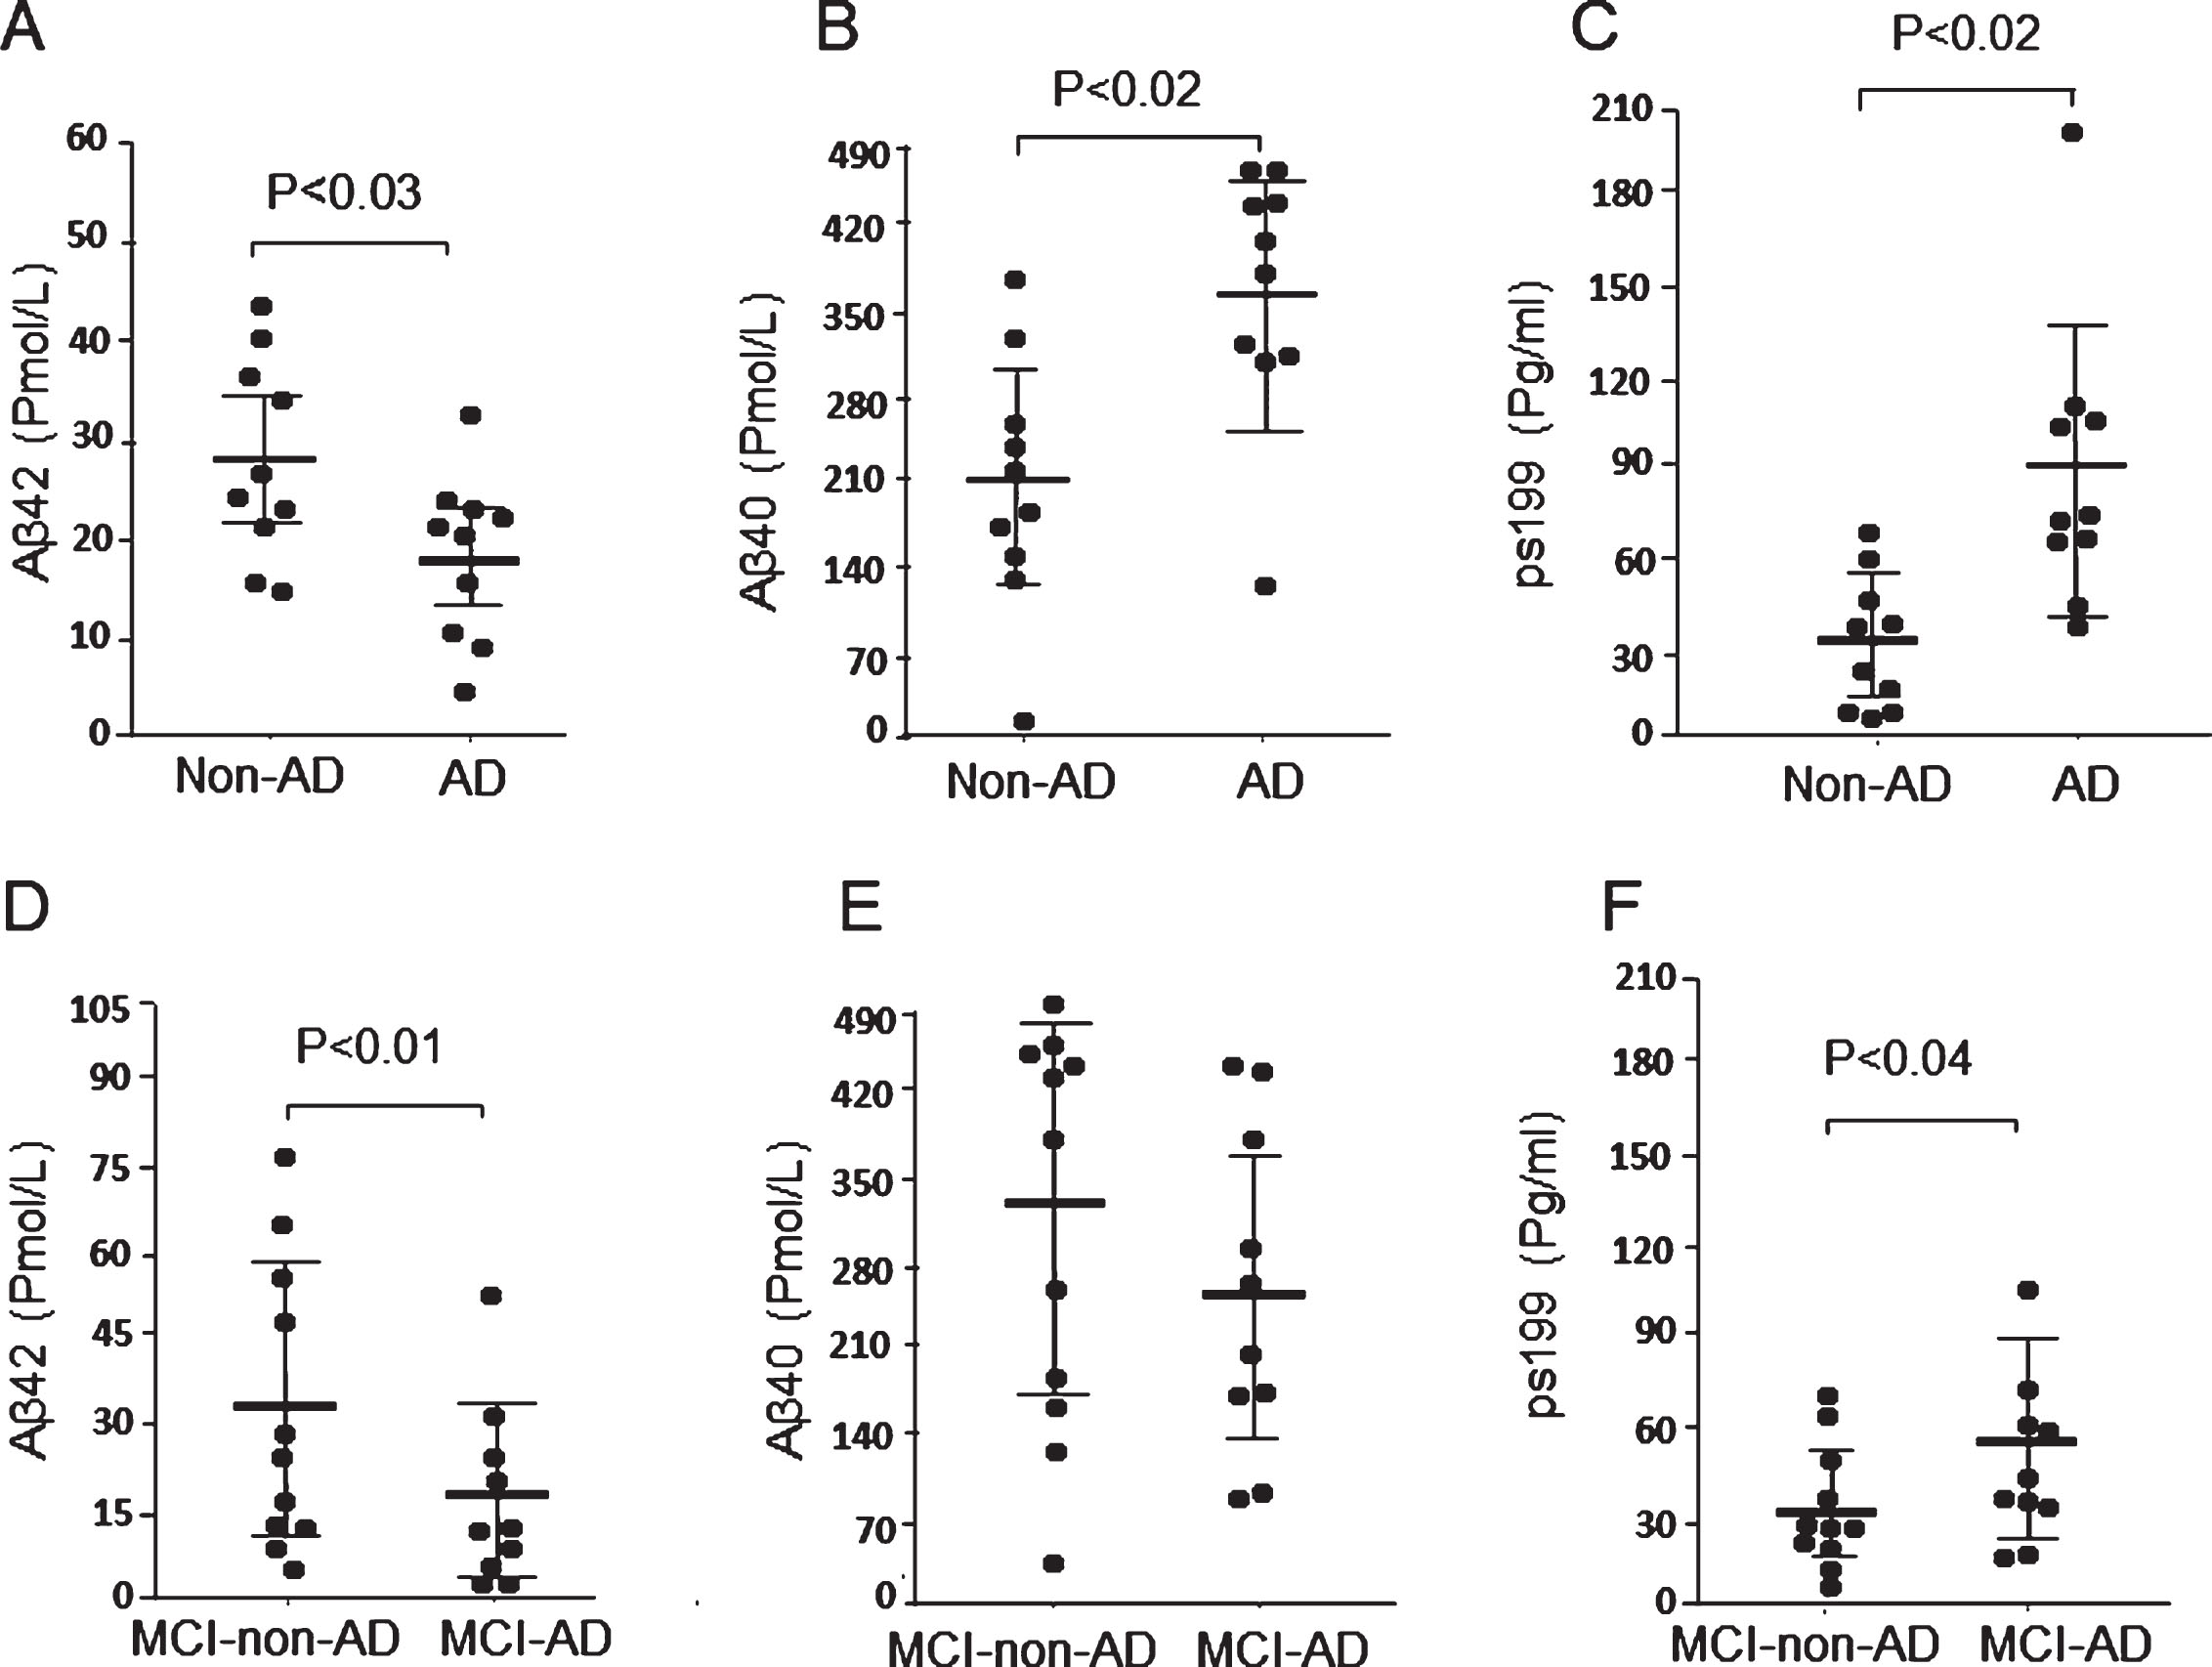
Levels of Aβ and tau (ps199) in CSF obtained from patients with AD and MCI. Levels of CSF Aβ42, Aβ40, and tau (ps199) in non-AD control, AD, MCI-non-AD, and MCI-AD groups were measured by ELISA as described in Methods section. Non-AD control group, n = 10; AD group, n = 10; MCI-non-AD group, n = 11; MCI-AD group, n = 10. A) The CSF Aβ42 level of the AD group is lower than that of the non-AD control group. B) The CSF Aβ40 level of the AD group is significantly higher than that of the non-AD control group. C) The CSF tau (ps199) level of AD Group is significantly higher than that of the non-AD control group. D) The CSF Aβ42 level of MCI-AD group is significantly lower than that of the MCI-non-AD group. E) The CSF Aβ40 level of the MCI-AD group did not significantly differ from that of the MCI-non-AD group. F) The CSF tau (ps199) level of the MCI-AD group is significantly higher that of the MCI-non-AD group. Data are mean±S.E.M. Statistical analysis was performed by ANOVA. MCI-AD, MCI due to AD; MCI-non-AD, MCI due to non-AD.
We have also analyzed the correlation between flotillin, Aβ1–42, and p-tau levels in CSF. As shown in Supplementary Figure 1A, the levels of flotillin and Aβ42 were positively and significantly correlated (Spearman r = 0.4044, p = 0.009); however, there was no correlation between the levels of flotillin and p-tau (Supplementary Figure 1B).
Levels of flotillin, ApoE, Aβ, ant tau (ps199) in CVF from autopsy patients with AD and non-AD controls
CSF is firstly secreted by the choroid plexus into cerebral ventricles as CVF, which then circulates in the CSF space [21]. We also examined the flotillin levels in the CVF of autopsy cases with AD. As expected, almost all of the autopsy cases with AD showed remarkable decreases in CVF flotillin levels and the decrease is even larger than that in CSF compared with non-AD cases (Fig. 3A, B). In contrast, the levels of apoE secreted in CVF were not significantly different between AD and non-AD cases (Fig. 3A, C). Aβ42 levels in the CVF of autopsy cases with AD significantly decreased by more than 70% compared with that of non-AD controls, whereas the Aβ40 levels did not significantly differ between the groups (Fig. 3D, E). Phosphorylated tau protein levels in the CVF of autopsy cases with AD showed a 2.3-fold increase compared with those of the non-AD group (Fig. 3F). These results together with the results of CSF samples suggest that CSF flotillin is a diagnostic marker of AD similar to CSF Aβ42 and phosphorylated tau.
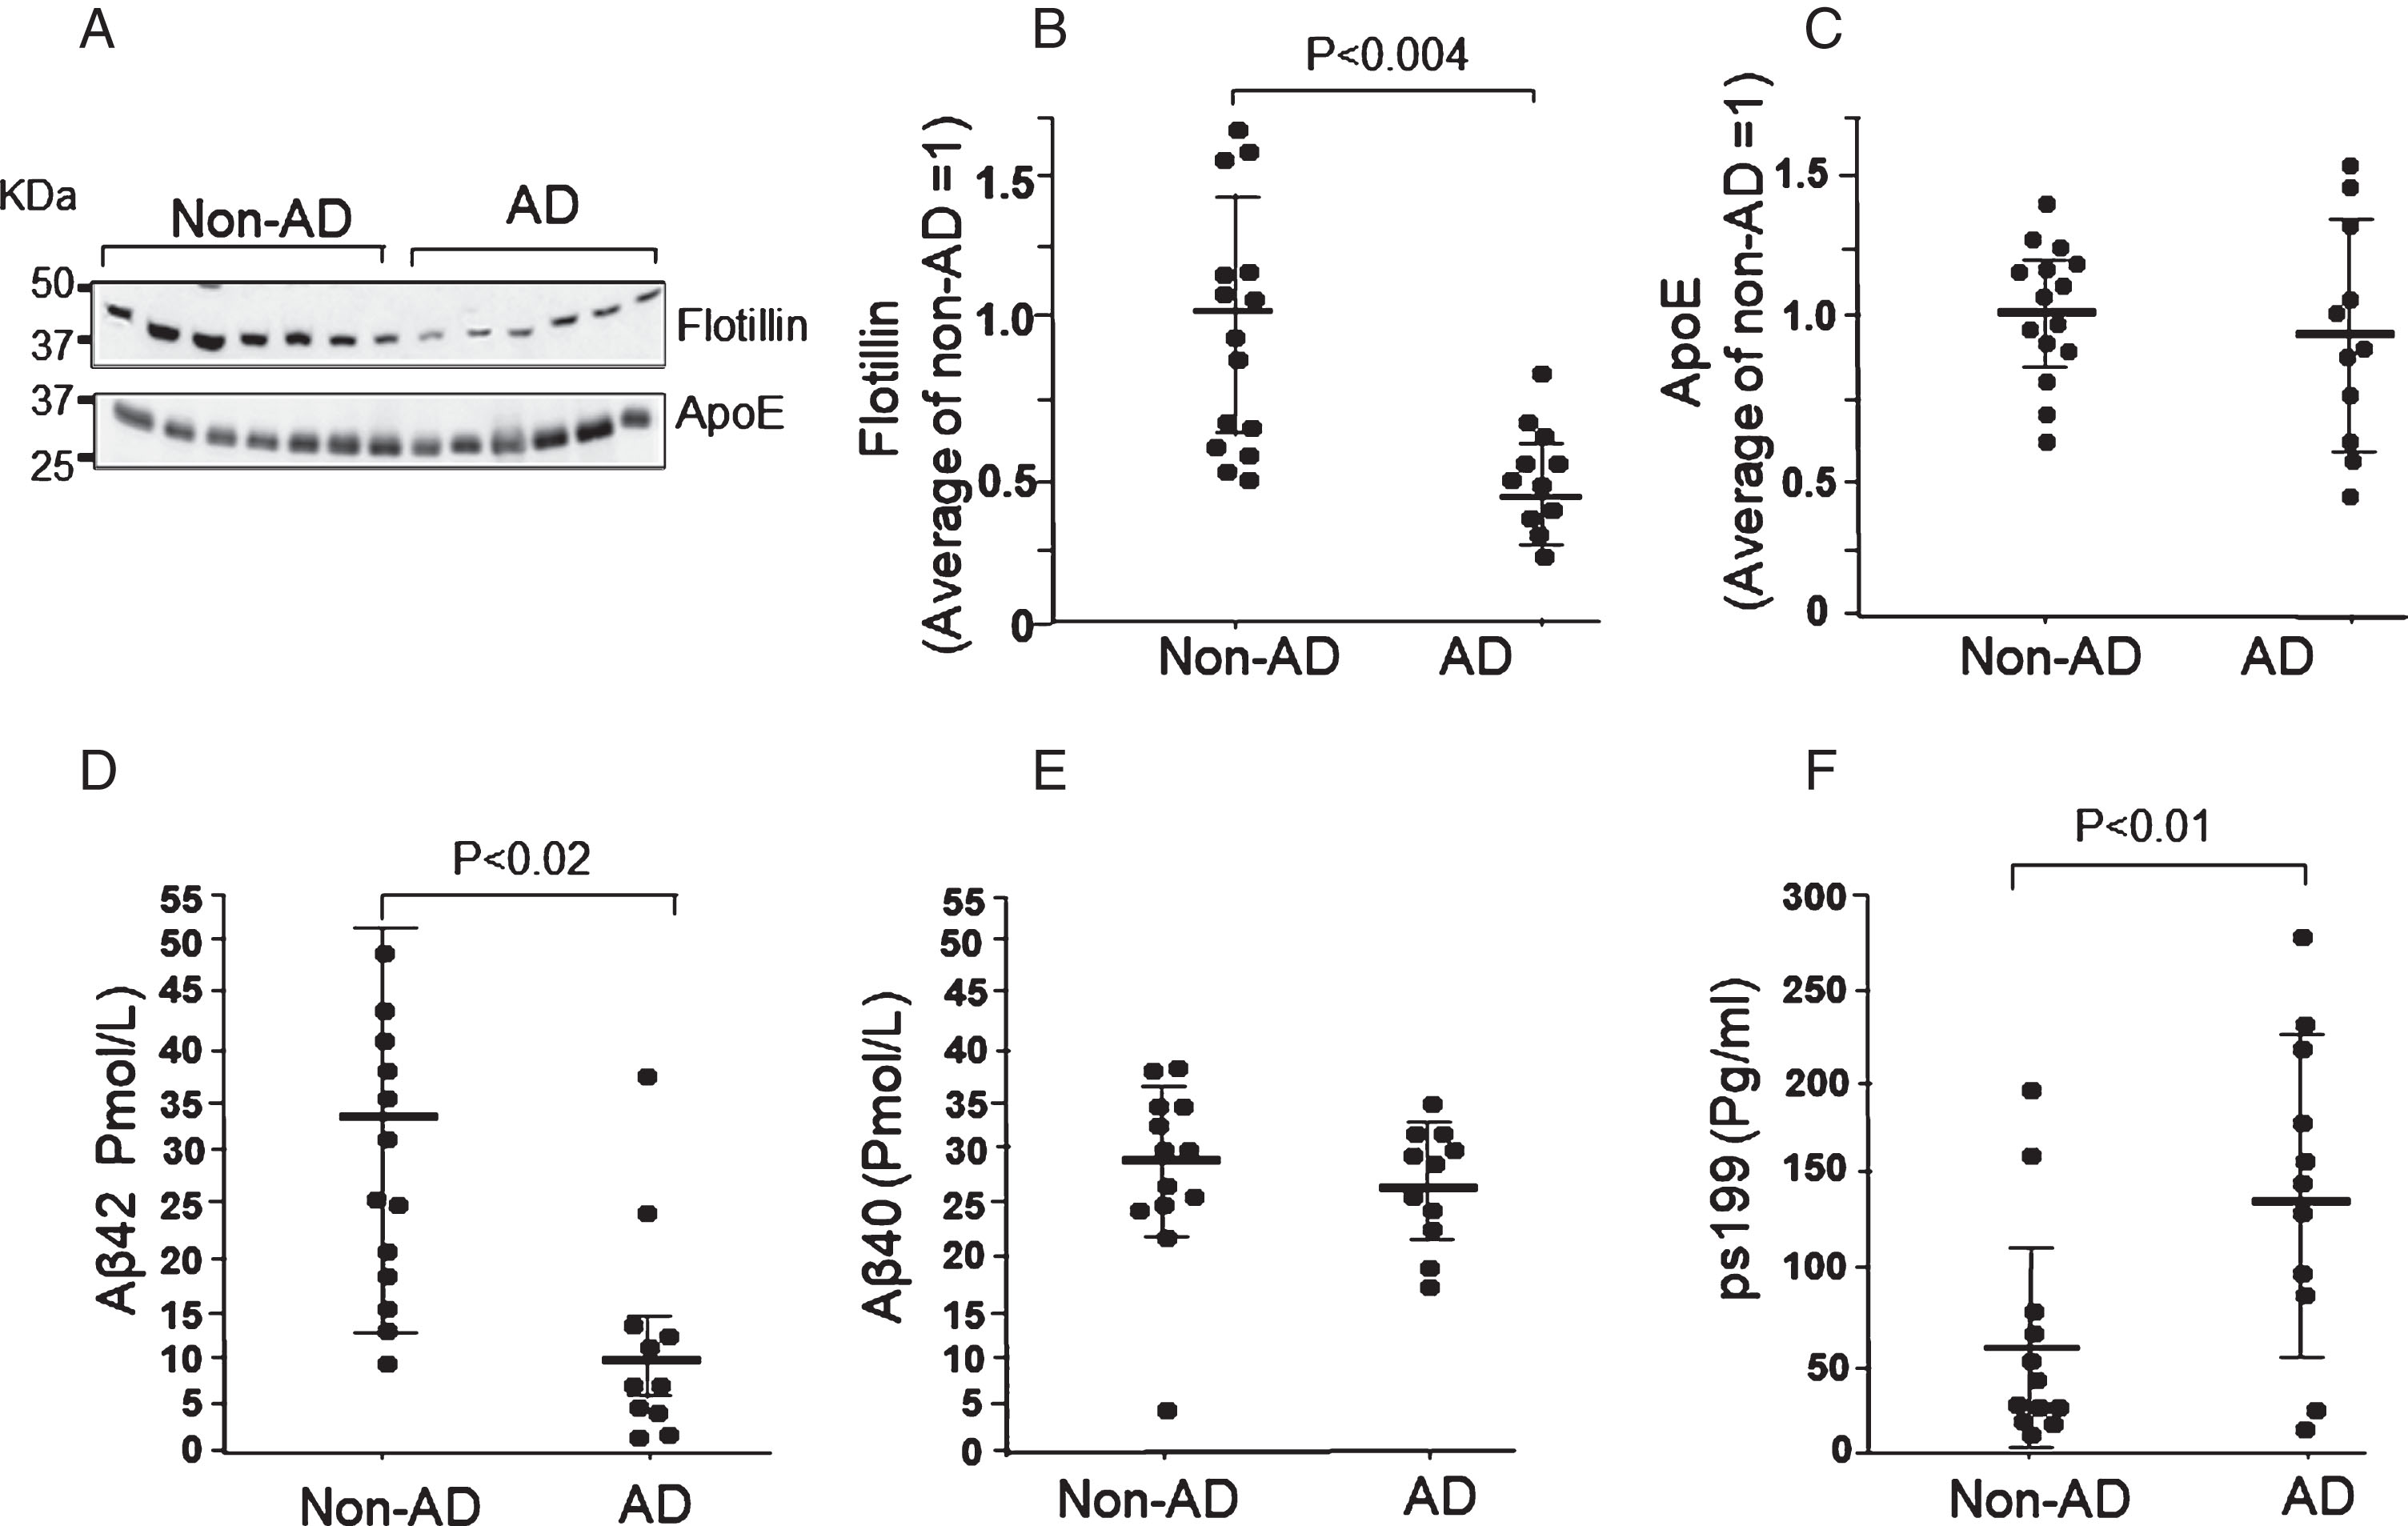
Levels of flotillin, ApoE, Aβ, and tau (ps199) in CVF obtained from autopsy cases with AD and non-AD groups. Western blot analysis of CVF obtained from autopsy cases with AD and non-AD controls was performed according to the methods described in the Methods section. A) Representative western blot of flotillin and ApoE in CVF from patients with AD and non-AD controls. B, C) The intensity of the bands of flotillin (B) and ApoE (C) were measured using Image J. Relative value of intensity of each band was normalized by the average value of the non-AD group as 1. Each dot represents the relative intensity of the flotillin band. D–F) Levels of CVF Aβ1–42, Aβ1–40, and tau (ps199) in non-AD autopsy cases and cases with AD groups were measured by ELISA as described in the Methods section. Data are mean±S.E.M. Statistical analysis was performed by ANOVA.
Serum flotillin levels in autopsy patients with AD were significantly lower than those in patients with VaD
It has been shown that the choroid plexus is the direct connection between blood and the CSF compartment and major portions of CSF are finally circulated or absorbed into blood through cervical lymphatics and arachnoid villi [21, 22]. We therefore postulated that plasma flotillin level may also change in patients with brain amyloid deposition. We compared between the serum flotillin levels in VaD patients and AD patients. The diagnosis of these patients was confirmed by pathological analysis of autopsy samples. We found that the serum flotillin levels in AD patients were 40% lower than those in VaD patients (Fig. 4A, B). This finding further suggests that the decrease in serum flotillin level could be a blood indicator of brain amyloid deposition and for the differential diagnosis between VaD and AD.
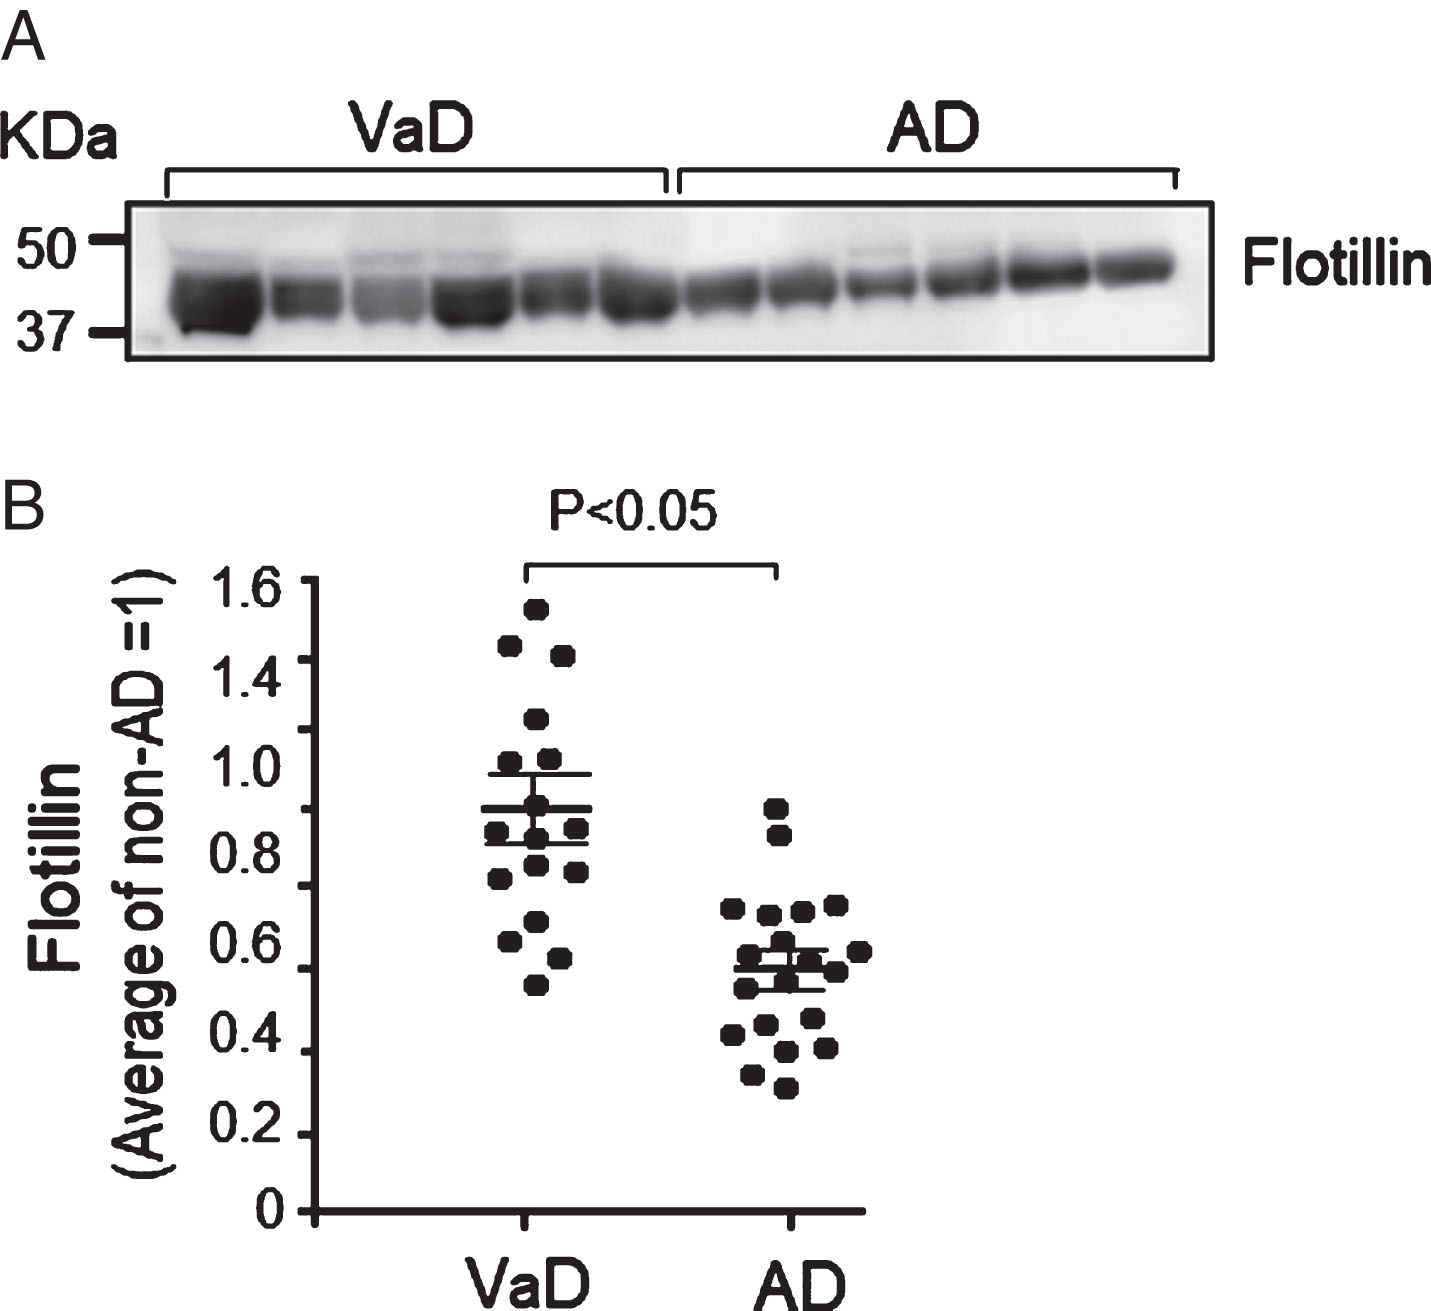
Serum flotillin levels in autopsy cases with AD were lower than those in cases with vascular dementia (VaD). Western blot analysis of serum obtained from autopsy cases with AD and VaD was performed according to the methods described in the Methods section. A) Representative western blot of flotillin in serum from the autopsy cases with AD and VaD. B) The intensities of flotillin bands were measured using Image J and the intensity of each band was normalized by the average value of samples from cases with VaD as 1. The serum flotillin levels significantly decreased in cases with AD compared with cases with VaD. VaD group, n = 17; AD group, n = 20. Data are mean±S.E.M. Statistical analysis was performed by ANOVA.
Serum flotillin levels in patients with AD and MCI-AD were lower than those in patients with MCI-non-AD
The brain amyloid deposition in patients with MCI and AD was examined by amyloid PET, and diagnosed as MCI due to AD (MCI-AD), MCI due to non-AD (MCI-non-AD), and AD. The serum levels of flotillin also decreased by nearly 30% in AD and more than 20% in MCI-AD group compared with the age-matched MCI-non-AD group (Fig. 5). The serum levels of flotillin also decreased by nearly 40% in AD group compared with the age-matched Non-AD group (Fig. 6). The levels of serum flotillin were also analyzed and compared between male and female in Non-AD group, AD group, MCI-due to non-AD group, and MCI-due to AD group. There were no significant gender differences regarding serum flotillin levels in each group (Supplementary Figure 2A–D).
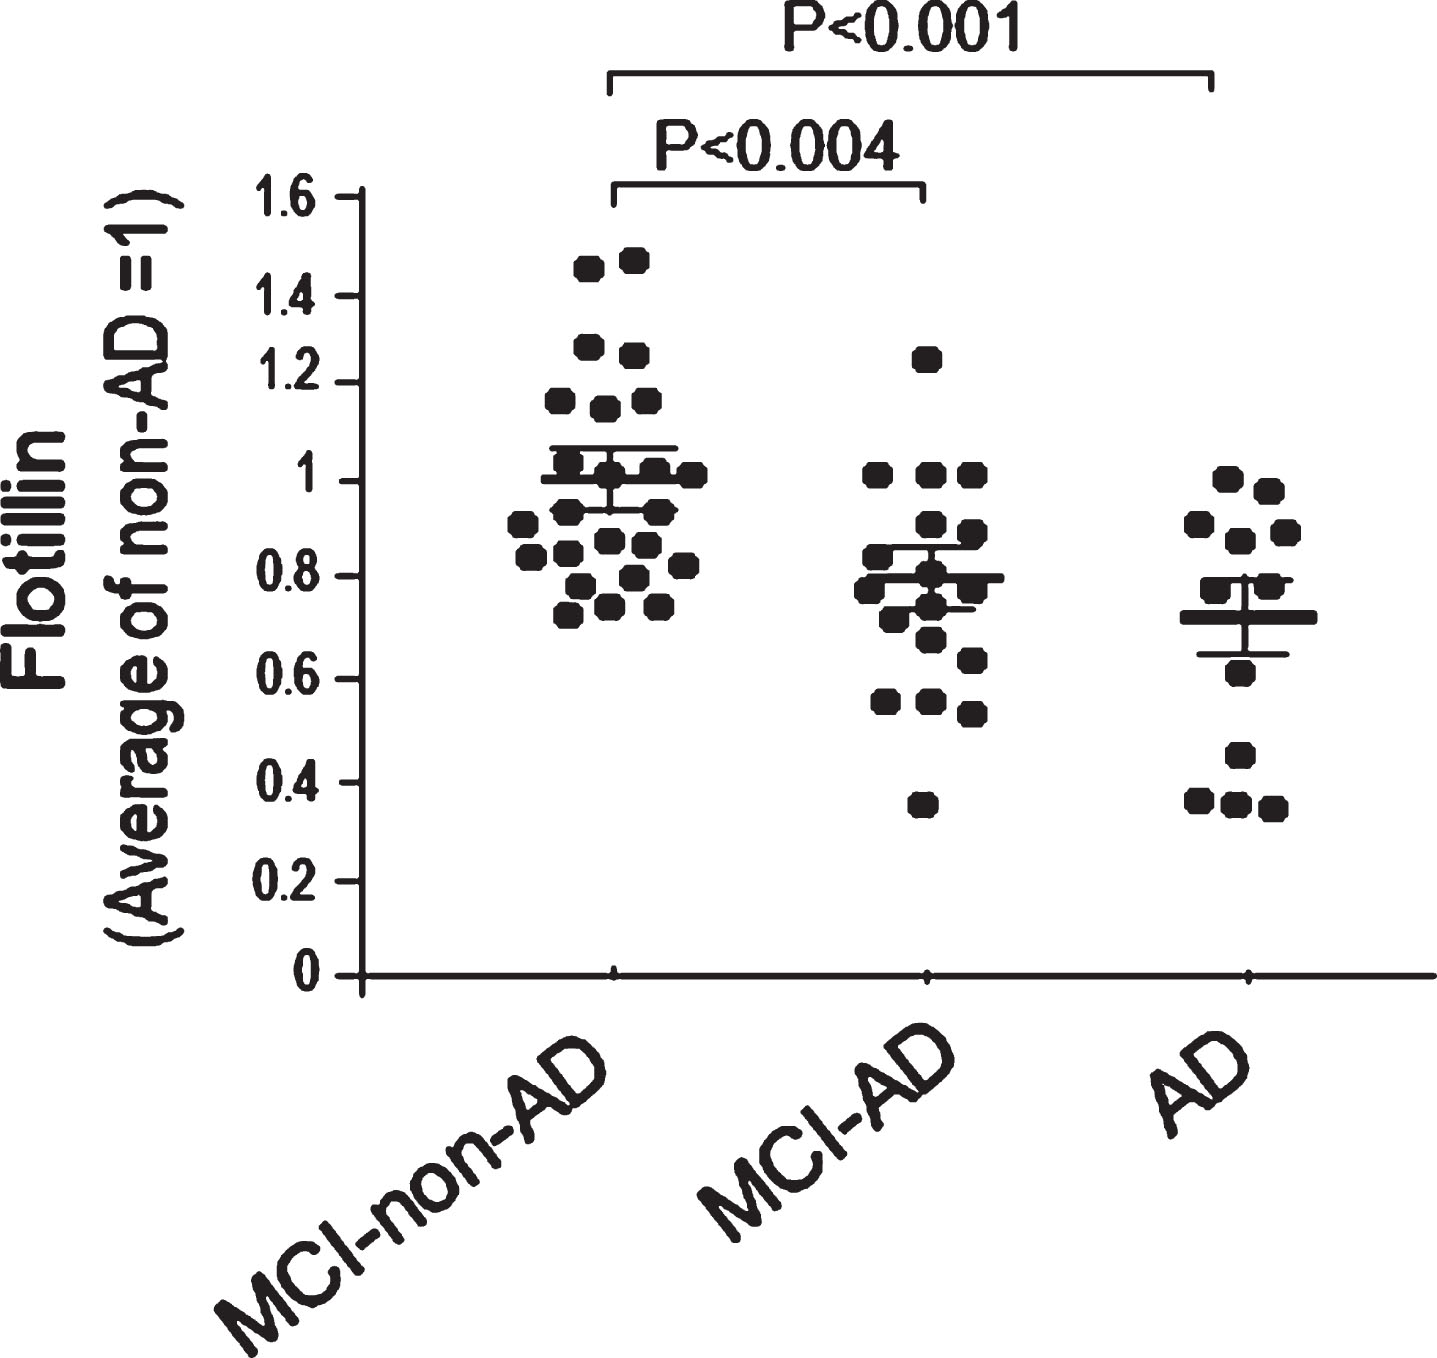
Serum flotillin levels in patients with AD and MCI-AD were significantly lower than those in patients with MCI-non-AD. Western blot analysis of flotillin in serum from the patients with AD, MCI-AD, and MCI-non-AD was performed. Intensity of flotillin band of each sample was quantified using Image J and each intensity was normalized by the average value of non-AD group as 1 to obtain relative values of each sample. The serum flotillin levels significantly decreased in MCI-AD and AD patients compared with non-AD controls. MCI-non-AD, n = 24; MCI-AD, n = 18; AD, n = 12. Data are mean±S.E.M. Statistical analysis was performed by ANOVA.
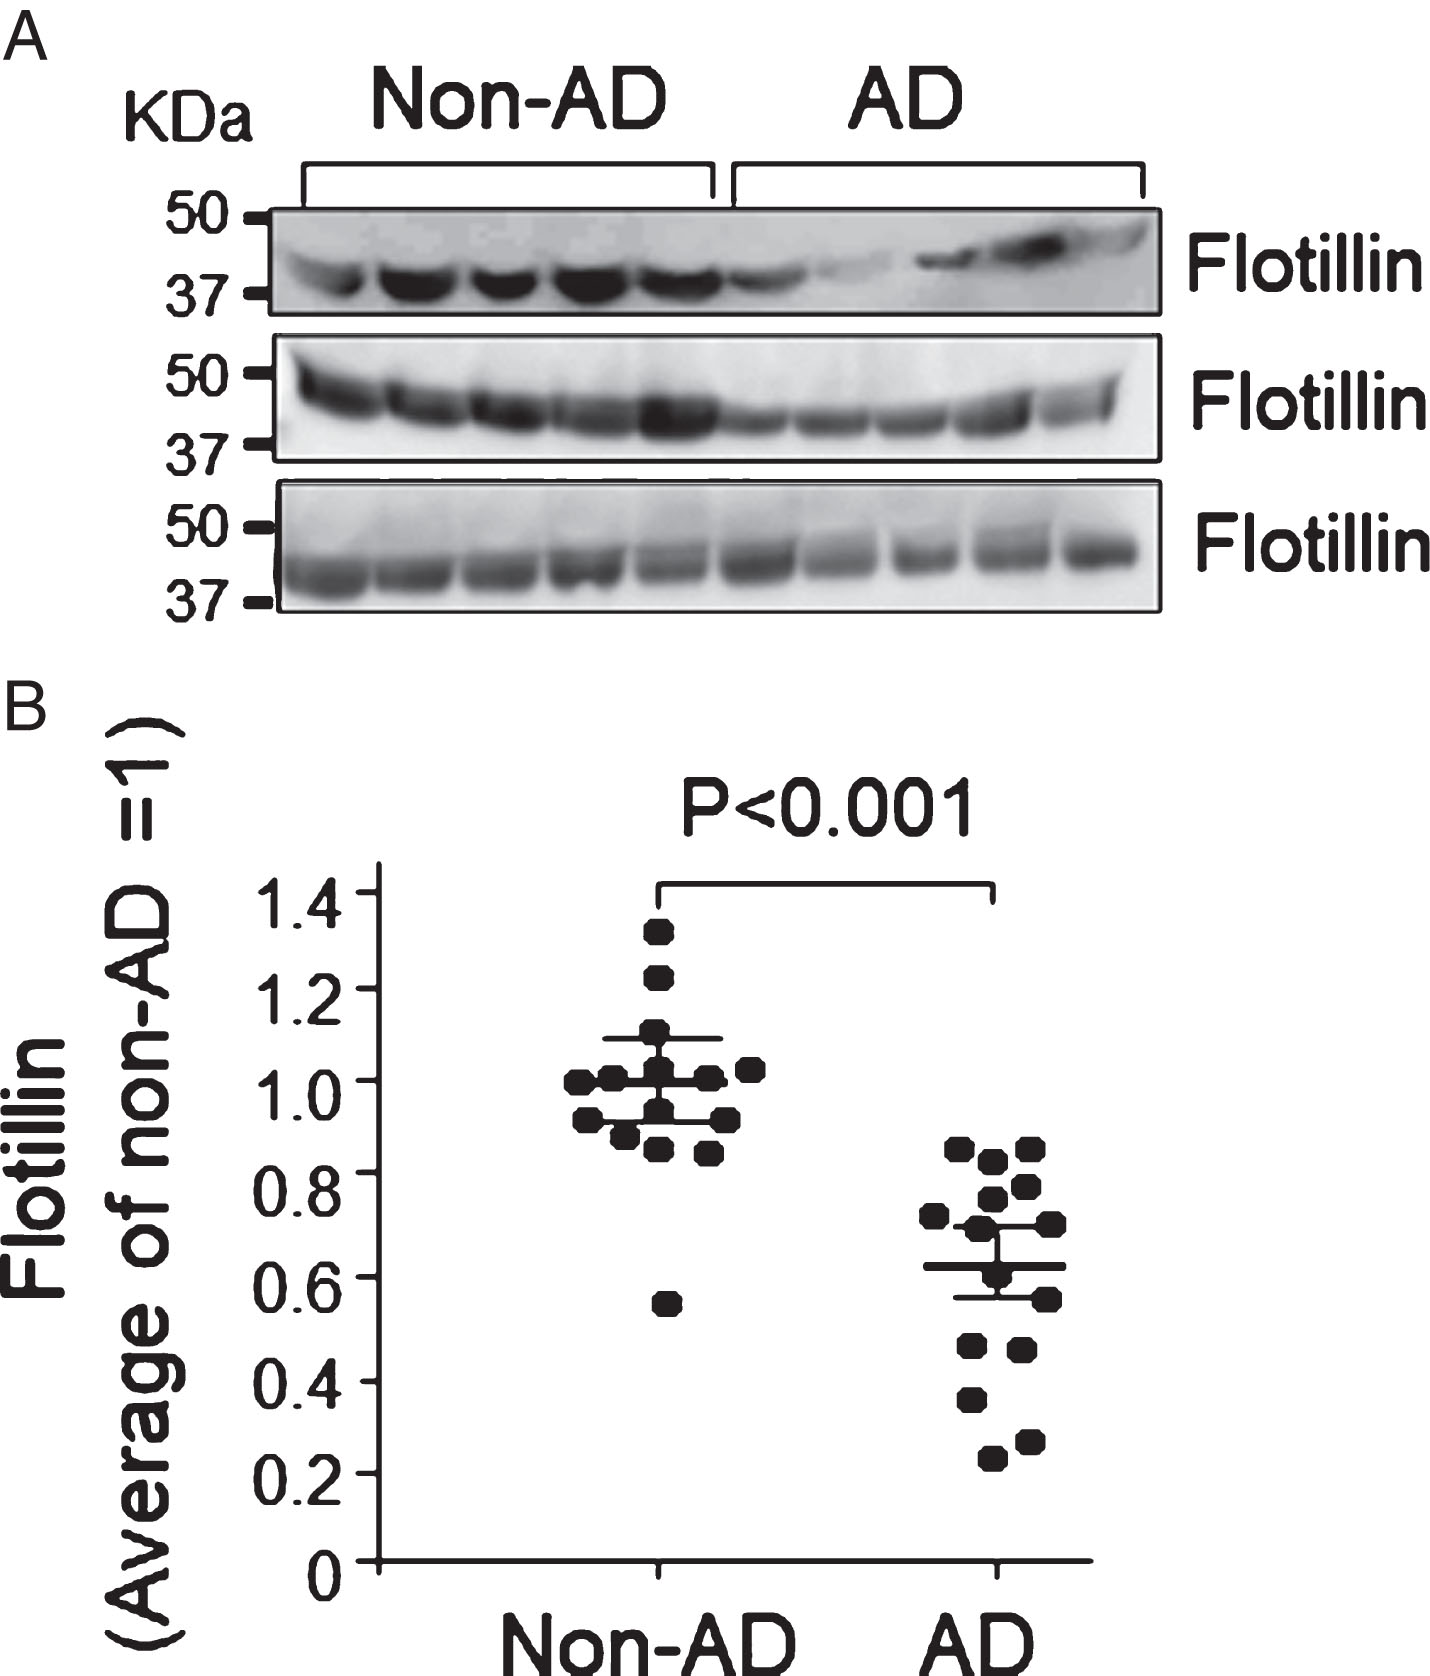
Serum flotillin levels in patients with AD were lower than those in non-AD cases. Flotillin in serum collected from patients with AD and non-AD cases was examined by western blot analysis. Intensity of flotillin bands was quantified using Image J. A) The representative results analyzed by western blot are shown. B) The quantitative analysis was performed and relative value of intensity of each band was normalized by the average value of flotillin in patients with non-AD as 1. Non-AD group, n = 15; AD group, n = 15. Data are mean±S.E.M. Statistical analysis was performed by ANOVA.
Analysis of correlation between serum flotillin and mean cortical PiB retention levels
Amyloid PET was performed to determine amyloid deposition in patients with AD and healthy control (Non-AD). Amyloid PET was also performed in patients with MCI to separate MCI-AD and MCI-non-AD. Sera were collected from these patients and were subjected to western blot analysis to determine flotillin levels. We analyzed the association between serum flotillin levels and PiB standard uptake value ratio (SUVR) determined by PiB PET examination. Serum flotillin levels are plotted against PiB SUVR. The serum flotillin level is significantly and inversely correlated with PiB SUVR (r =–0.493; p < 0.001) (Fig. 7). Taken together, our results suggest that the decrease in serum flotillin level reflects brain amyloid deposition.

Analysis of correlation between serum flotillin levels and mean cortical PiB retention levels. Serum flotillin and PiB retention levels in the non-AD, AD, MCI-non-AD, and MCI-AD groups were plotted. Serum flotillin levels significantly and negatively correlated with PiB retention levels shown as SUVR (r =–493; p < 0.001, Spearman’s rank correlation coefficient).
Serum levels of flotillin in patients with cancers
Because previous reports has shown that flotillin is frequently overexpressed in various types of cancers [23], we analyzed serum levels of flotillin in the samples from patients with cancers. The levels of serum flotillin in patients with cancers showed no difference compared with those of age-matched controls and younger controls (Fig. 8). It is of note that serum flotillin levels remain unchanged between healthy younger (average 29.7 years old) and healthy aged (average 60.8 years old) groups (Fig. 8).

Serum flotillin levels in patients with cancers and healthy controls. Western blot analysis of flotillin in serum from the patients with cancers and healthy controls was performed. The diagnosis of cancers with patients is shown in Table 3. Intensity of flotillin band of each sample was quantified using Image J and the relative value of intensity of each band was normalized by the average value of young healthy control group as 1. There is no difference in the flotillin levels among the groups examined. Age-matched control group, n = 6; Young control group, n = 10; Cancer group, n = 19. Data are mean±S.E.M. Statistical analysis was performed by ANOVA.
DISCUSSION
In this study, we found that the level of a single molecule, flotillin, was significantly decreased in the CSF and serum from AD patients and MCI due to AD patients. The decrease in flotillin level is associated with brain amyloid deposition, but not with cognitive impairment in patients with VaD or MCI due to non-AD, indicating that flotillin could be used as a single blood marker for the diagnosis of AD and MCI due to AD. Results of several studies have suggested that a pattern of a set of plasma proteins or plasma phospholipids may change in AD patients or MCI patients compared with normal controls. These studies include the quantitation of 18 plasma signaling proteins by ELISA [24], the quantitation of 10–18 other plasma proteins by multiplex assay [25, 26] or SOMAscan assay [27], and the measurement of 10 plasma phospholipids by mass spectrometry [28]. These sets of plasma proteins or phospholipids may reflect the multiple changes in AD or MCI, such as synapse dysfunction, neuronal death, or abnormal activation of glia cells. A recent study showed that AβPP/Aβ composites determined by immunoprecipitation and mass spectrometry may predict the brain amyloid status [29]. However, in all these previous studies, the measurement of multiple plasma molecules is required or require specific instruments to determine the levels of target molecules in the blood. Thus, utilizing a blood marker, flotillin, has an advantage that it is a single molecule and is easily assayed by immunoblot analysis and/or ELISA method.
Aβ42 initiates a pathological cascade including amyloid deposition, synapse dysfunction, tau phosphorylation, and eventually AD [30]. On the basis of this amyloid cascade theory, approaches targeting amyloid including immunization strategies, and the use of γ-secretase and β-secretase inhibitors have been attempted; however, none of the Aβ-targeted phase III clinical trials have shown significant benefits [31–33]. It is believed that administration of an Aβ-targeting treatment is too late to have any beneficial effects after cognitive impairment symptoms appeared. Thus, it is important to start the treatment and prevent AD while still in their preclinical stages. Brain amyloid deposition and the decline of CSF Aβ42 occur several years before AD symptom onset [2]. Although amyloid PET imaging and CSF Aβ42 ELISA can identify the preclinical stage of AD, they are difficult to apply to cognitively normal individuals because PET and CSF examinations are expensive and/or invasive. Our present study showed that the serum flotillin level was low in patients with AD and MCI, both of which were demonstrated by PET and thus the level of brain amyloid deposition increased. However, that was not the case for other patients without brain amyloid deposition, such as patients with VaD who were diagnosed by pathological examination and those with MCI due to non-AD diagnosed by PiB-PET. These findings suggest that flotillin may serve as a predictive blood marker indicating brain amyloid deposition in the preclinical stage of AD. In support of this notion, the relationship between amyloid deposition demonstrated by PiB-PET imaging and serum flotillin level was found to negatively correlate (Fig. 7).
A recent meta-analysis revealed that amyloid PET imaging might have the potential to be most helpful for the differential diagnosis of early-onset dementia, particularly in differentiating the early stage of AD from VaD and frontotemporal dementia [34]. However, some reported that the prevalence of amyloid positivity decreased in aged AD patients [34]. In our study, the level of serum flotillin consistently decreased in aged AD patients determined by autopsy pathological studies, but not in aged VaD patients, suggesting that serum flotillin level is useful for the differential diagnosis of AD and other dementia. In MCI patients, the level of serum flotillin is lower in the amyloid-positive group than in the amyloid-negative group (MCI-non-AD) (Fig. 5). These lines of evidence indicate that serum flotillin level as a blood marker indicates levels of brain amyloid deposition and it could be a substitute parameter or may complement amyloid PET imaging findings.
Our previous study has shown that extracellular flotillin level was decreased in astrocytes by the treatment with Aβ42 [15]. Flotillin has been used as an exosome marker for a long time. In addition, a recent study showed that flotillin is present in all types of extracellular vesicles, regardless of the size and density of the vesicles [35]. Thus, it is possible that the decrease in extracellular flotillin level by the treatment with Aβ42 suggests that Aβ42 may also reduce the secretion of all types of extracellular vesicles. In the brain, the accumulation of Aβ42 may reduce the secretion of extracellular vesicles from glial cells and neurons and lead to the decrease in CSF and CVF flotillin levels (Figs. 1 and 3). However, the mechanism underlying the decrease in serum flotillin levels in the amyloid-positive AD and MCI patients should be elucidated. Our results indicate that flotillin levels negatively correlated with brain amyloid deposition detected by PiB-PET (Fig. 7). Because our previous study has shown that extracellular Aβ reduces flotillin release from cultured astrocyte [15], one possible explanation may be that brain amyloid deposition and/or increased level of brain Aβ affects endothelial cells (EC) consisting blood-brain barrier to release flotillin. EC surface is facing brain side and also blood side. Therefore, increased level of Aβ in the brain side may have an effect on brain and blood sides to modulate flotillin release to both sides. The surface of ECs facing the blood side is large enough to have an effect on flotillin levels in the blood. Another possibility may be that flotillin in the extracellular vesicles including exosome flow out to the brain parenchyma/CSF into blood through perivascular pathways into the cervical lymph nodes [36].
Taken together, we found that serum and CSF flotillin levels significantly decreased in patients with AD and MCI due to AD who showed brain amyloid deposition demonstrated by PET. This was also the case for AD autopsy cases who showed amyloid deposition in their brains. The decrease in serum flotillin level was highly associated with brain amyloid deposition, but not with cognitive function, as shown in cases of VaD. Thus, serum flotillin level could serve as a blood marker for the differential diagnosis of AD and MCI-due to AD from other types of dementia. It could also be useful for the large-scale preclinical screening of brain amyloid deposition in normal populations.
Footnotes
ACKNOWLEDGMENTS
This work was supported by a Grant-in-Aid for Scientific Research B (16H05559) (to M.M.), a Grant-in-Aid for Challenging Exploratory Research (15K15712) (to M.M.), and a Grant-in-Aid for Young Scientists (19K17040) (to M.A.) from the Ministry of Education, Culture, Sports, Science and Technology, Japan. This study was also supported by the Project of Translational and Clinical Research Seed A from Japan Agency for Medical Research and Development (AMED: A-128) (to M.M.), and AMED under Grant Number 18he142003, 18dk020730 (to E.M.).