



Abstract
Background:
The National Institute on Aging and Alzheimer’s Association proposed an ATN classification system which divided Alzheimer’s disease biomarkers into three binary classes: amyloid deposition (A), tauopathy (T), and neurodegeneration or neuronal injury (N).
Objective:
To estimate the prevalence of each profile and to describe the demographic characteristics of each group in Chinese cognitively intact older adults.
Methods:
In this cross-sectional study, 561 cognitively intact participants from the Chinese Alzheimer’s Biomarker and LifestylE (CABLE) study were classified into eight groups using cerebrospinal fluid amyloid-β 42/40 as A, phosphorylated tau as T, and total tau as N. Multinomial models were used to determine the estimated prevalence of the eight groups.
Results:
The number and proportion of 561 participants in each ATN profile were 254 A-T-N- (45.3%), 28 A-T+N- (5.0%), 21 A-T-N+ (3.7%), 71 A-T+N+ (12.7%), 78 A + T-N- (13.9%), 14 A + T+N- (2.5%), 21 A + T-N+ (3.7%), and 74 A + T+N+ (13.2%). Individuals in N+ groups tend to be older than N- groups. A+ groups included more female individuals. The prevalence of A-T-N- profile declined with age, while that of A + T+N+ increased continuously.
Conclusion:
This is the first work to estimate the prevalence of each ATN profile and describe the demographic characteristics of ATN profiles based on a Chinese cohort. The clinical implications of our findings need to be scrutinized further in longitudinal studies of the ATN classification system.
INTRODUCTION
Alzheimer’s disease (AD) is a progressive, neurodegenerative disease characterized by amyloid plaques, tau neurofibrillary tangles, neurodegeneration, and synaptic loss. Biomarkers of the AD were incorporated into the diagnostic criteria in the 2011 National Institute on Aging-Alzheimer’s Association (NIA-AA) recommendations [1–4]. It divided the biomarkers into two major categories: the biomarkers of amyloid-β (Aβ) accumulation (amyloid PET or cerebrospinal fluid (CSF) Aβ42), and the biomarkers of neuronal degeneration or injury (CSF p-tau or t-tau, FDG-PET or structural MRI).
In 2018, the NIA-AA published an updated research framework defining AD by its underlying pathologic processes that can be documented by postmortem examination or in vivo by biomarkers [5]. The updated research framework divided AD biomarkers into three binary classes: “A” refers to the biomarkers of Aβ plaques (amyloid PET, CSF Aβ42 or Aβ42/Aβ40 ratio); “T”, the value of a tau pathology biomarker (CSF phosphorylated tau or tau PET); and “N”, a quantitative or topographic biomarker of neurodegeneration or neuronal injury (CSF total tau, FDG-PET, or structural MRI). The classification scheme labeled AT(N) was first proposed by an international group in 2016 [6].
Recent cross-sectional studies from the Mayo Clinic and H70 Gothenburg Birth Cohort reported the prevalence of each AT(N) profile in cognitively unimpaired individuals [7, 8]. However, there have not been cross-sectional studies based on Chinese population reported the AT(N) profile prevalence. The objective of this study was to apply the AT(N) categorization to Chinese cognitively intact older adults aged 40 years and older from the Chinese Alzheimer’s Biomarker and LifestylE (CABLE) study, estimating the prevalence of each ATN profile and describing the demographic characteristics of individuals in each group.
MATERIALS AND METHODS
Study participants
Five hundred and sixty-one cognitively intact older adults who were northern Han Chinese were derived from the CABLE study. The CABLE study is an ongoing large-scale cohort study initiated in 2017, mainly focusing on AD risk factors and biomarkers in the northern Chinese Han population. This cohort is hospital-based. Individuals were recruited at Qingdao Municipal Hospital, Shandong Province, China. All enrolled participants in the CABLE were Han Chinese aged between 40 to 90 years. The exclusion criteria include: 1) central nervous system infection, head trauma, epilepsy, multiple sclerosis or other major neurological disorders; 2) major psychological disorders; 3) severe systemic diseases (e.g., malignant tumors) that may affect CSF or blood levels of AD biomarkers including Aβ and tau; 4) family history of genetic diseases. All participants underwent clinical and neuropsychological assessments, biochemical testing, as well as blood and CSF sample collection. Demographic information, AD risk factor profile, and medical history were collected via a structured questionnaire and an electronic medical record system. In conjunction with the investigation, oral informed consent for future use of their CSF and blood samples for research purposes was obtained. All patients were later instructed to withdraw their permission if they changed their minds. The design of the study was approved by the Institutional Review Board of Qingdao Municipal Hospital, and the study procedure was conducted in accordance with the Declaration of Helsinki [9].
Individuals from the CABLE were included in our study if they had undergone CSF Aβ analysis (A), CSF p-tau examination (T), and CSF t-tau examination (N). Participants were classified as having normal (A-) or abnormal (A+) amyloid using CSF Aβ42/Aβ40 ratio, normal (T-) or abnormal (T+) tau using CSF p-tau, normal (N-) or abnormal (N+) neurodegeneration or neuronal injury using CSF t-tau [5, 6]. Individuals without data of Mini-Mental State Examination (MMSE) or apolipoprotein E (APOE) genotype and individuals with apparent errors or missing data were excluded. To avoid drawing conclusions based on extreme cases, we excluded individuals if individual coefficients of variation (CV) of each biomarker were greater than 15%. Outliers located outside±5 standard deviation (SD) were excluded. To exclude individuals with cognitive impairment, the education-adjusted cutoff points were used in MMSE: 19/20 for illiterate individuals (0 year of education), 24/25 for individuals with 1–6 years of education, and 27/28 for individuals with 7 or more years of education [10]. Finally, 561 participants were enrolled in our study. Only cognitively normal (CN) individuals were included.
CSF AD biomarkers
In CABLE, collection and storage of fasting lumbar CSF samples were performed at Qingdao Municipal Hospital. CSF was drawn and processed within 2 h after collection. Each tube was centrifuged at 2000×g for 10 min, and CSF was separated and stored in enzyme free EP tube at –80°C until further use in this study. The samples were subjected to a maximum of two freeze-thaw cycles. CSF biomarker values were analysis manually. CSF Aβ42, Aβ40, t-tau, and p-tau181 were determined with the ELISA kit (Innotest β-AMYLOID (1–42), β-AMYLOID (1–40), hTAU-Ag, and PHOSPHO-TAU (181p); Fujirebio, Ghent, Belgium) on the microplate reader (Thermo Scientific™ Multiskan™ MK3). Each sample was measured in duplicate for each analyte. Individual CVs of each biomarker from the duplicates were controlled less than 20% in the database. The intra-assay CVs were <6% (5.0% for Aβ42, 3.7% for Aβ40, 2.5% for p-tau181, and 4.8% for t-tau). The inter-assay CVs were controlled <15% in our study (8.9% for CSF Aβ42, 8.3% for CSF Aβ40, 11.5% for p-tau181, and 10.6% for t-tau).
APOE and cognitive assessment
The DNA in the blood samples were used to extract DNA using QIAamp® DNA Blood Mini Kit (250), and the extracted DNA was separated and stored in enzyme free EP tube at –80°C until APOE genotyping in this study. Specific loci were selected for genotyping with restriction fragment length polymorphism (RFLP) technology, including the two loci related to APOE ɛ4 status (rs7412 and rs429358). Individuals with at least one APOE ɛ4 allele were included in APOE ɛ4 carrier status. Global cognitive function was assessed using the MMSE.
Statistical analysis
Approximately one-third of cognitively normal older adults have AD pathology in their brains, as indicated by amyloid imaging [11–13] and neuropathological studies [14–16]. Therefore, a cutoff point on 1/3 sensitivity for abnormality of each biomarker was applied in the previous study [17]. In our study, biomarker abnormality was defined as having CSF Aβ42/40 ratio levels in the lower one-third of the distribution of participants (<0.02) or having CSF p-tau (>38.6 pg/mL) or CSF t-tau (>179.5 pg/mL) levels in the upper one-third of the distribution.
According to the ATN classification scheme [5, 6], each participant was classified into one of the eight ATN profiles using the predefined cutoff points. Age of participants was stratified as two subgroups (40–64 and 65–88 years). Multinomial models were used to estimate the prevalence of each ATN biomarker group: eight ATN groups were the response with age and sex as covariates, or age and APOE ɛ4 as covariates. Age was modeled with a restricted cubic spline with knots at ages 50, 60, and 70. Differences across the eight biomarker profiles were tested by the Kruskal-Wallis test for continuous variables with skewed distributions and Pearson Chi-Square or Fisher’s exact test for categorical data. To test the differences in age across eight biomarker profiles in the biomarker framework, we applied Kruskal-Wallis tests followed by Bonferroni post hoc analyses. Statistical significance was defined as p < 0.05 for all analyses. Statistical analyses were performed using the R statistical software (version 3.6.1) and SPSS Statistics 23.
RESULTS
Demographic features of all 561 participants were shown in Table 1. Table 2 and Fig. 1 show ATN group characteristics of total participants. Of the 561 individuals who were enrolled in our study, age ranged from 40 to 88 with a median 62 years. Proportion of eight groups in two subgroups and the total CN individuals were shown in Fig. 2. The number and proportion of total participants in each ATN profile were 254 A-T-N- (45.3%), 28 A-T+N- (5.0%), 21 A-T-N+ (3.7%), 71 A-T+N+ (12.7%), 78 A + T-N- (13.9%), 14 A + T+N- (2.5%), 21 A + T-N+ (3.7%), and 74 A + T+N+ (13.2%). The proportion of NIA-AA preclinical AD stage 1 (A + T-N-) was 13.9%; that of stage 2 or 3 (A + T+N-, A + T-N+, or A + T+N+) was 19.4%; suspected non-AD pathophysiology (SNAP; e.g., A-T+N-, A-T-N+, and A-T+N+) accounted for 21.4%. The proportion of A-T-N- profile in age 40-64 years were higher than in age 65–88 years (p < 0.05); while that of A + T+N+ in age 65–88 years were higher than in age 40–64 years (p < 0.05).
Descriptive characteristics of subjects
Data are median (IQR) or number (%) unless otherwise stated. Cognitively intact participants were divided into two subgroups by age. n, number; APOE, Apolipoprotein E; Aβ, amyloid-β; CSF, cerebrospinal fluid; IQR, inter quartile range; MMSE, Mini-Mental State Examination; P-tau, phosphorylated tau; T-tau, total tau.
Characteristics of 561 participants by ATN biomarker classification
Data are median (IQR) or number (%) unless otherwise stated. n, number; P-tau, phosphorylated tau; T-tau, total tau; APOE, Apolipoprotein E; Aβ, amyloid-β; CSF, cerebrospinal fluid; ATN, amyloid, tau, and neurodegeneration or neuronal injury; A–, amyloid normal using CSF Aβ42/40; A+, amyloid abnormal using CSF Aβ42/40, T–, tau normal using CSF p-tau; T+, tau abnormal using CSF p-tau; N–, neurodegeneration or neuronal injury normal using CSF t-tau; N+, neurodegeneration or neuronal injury abnormal using CSF t-tau; IQR, inter quartile range; MMSE, Mini-Mental State Examination.
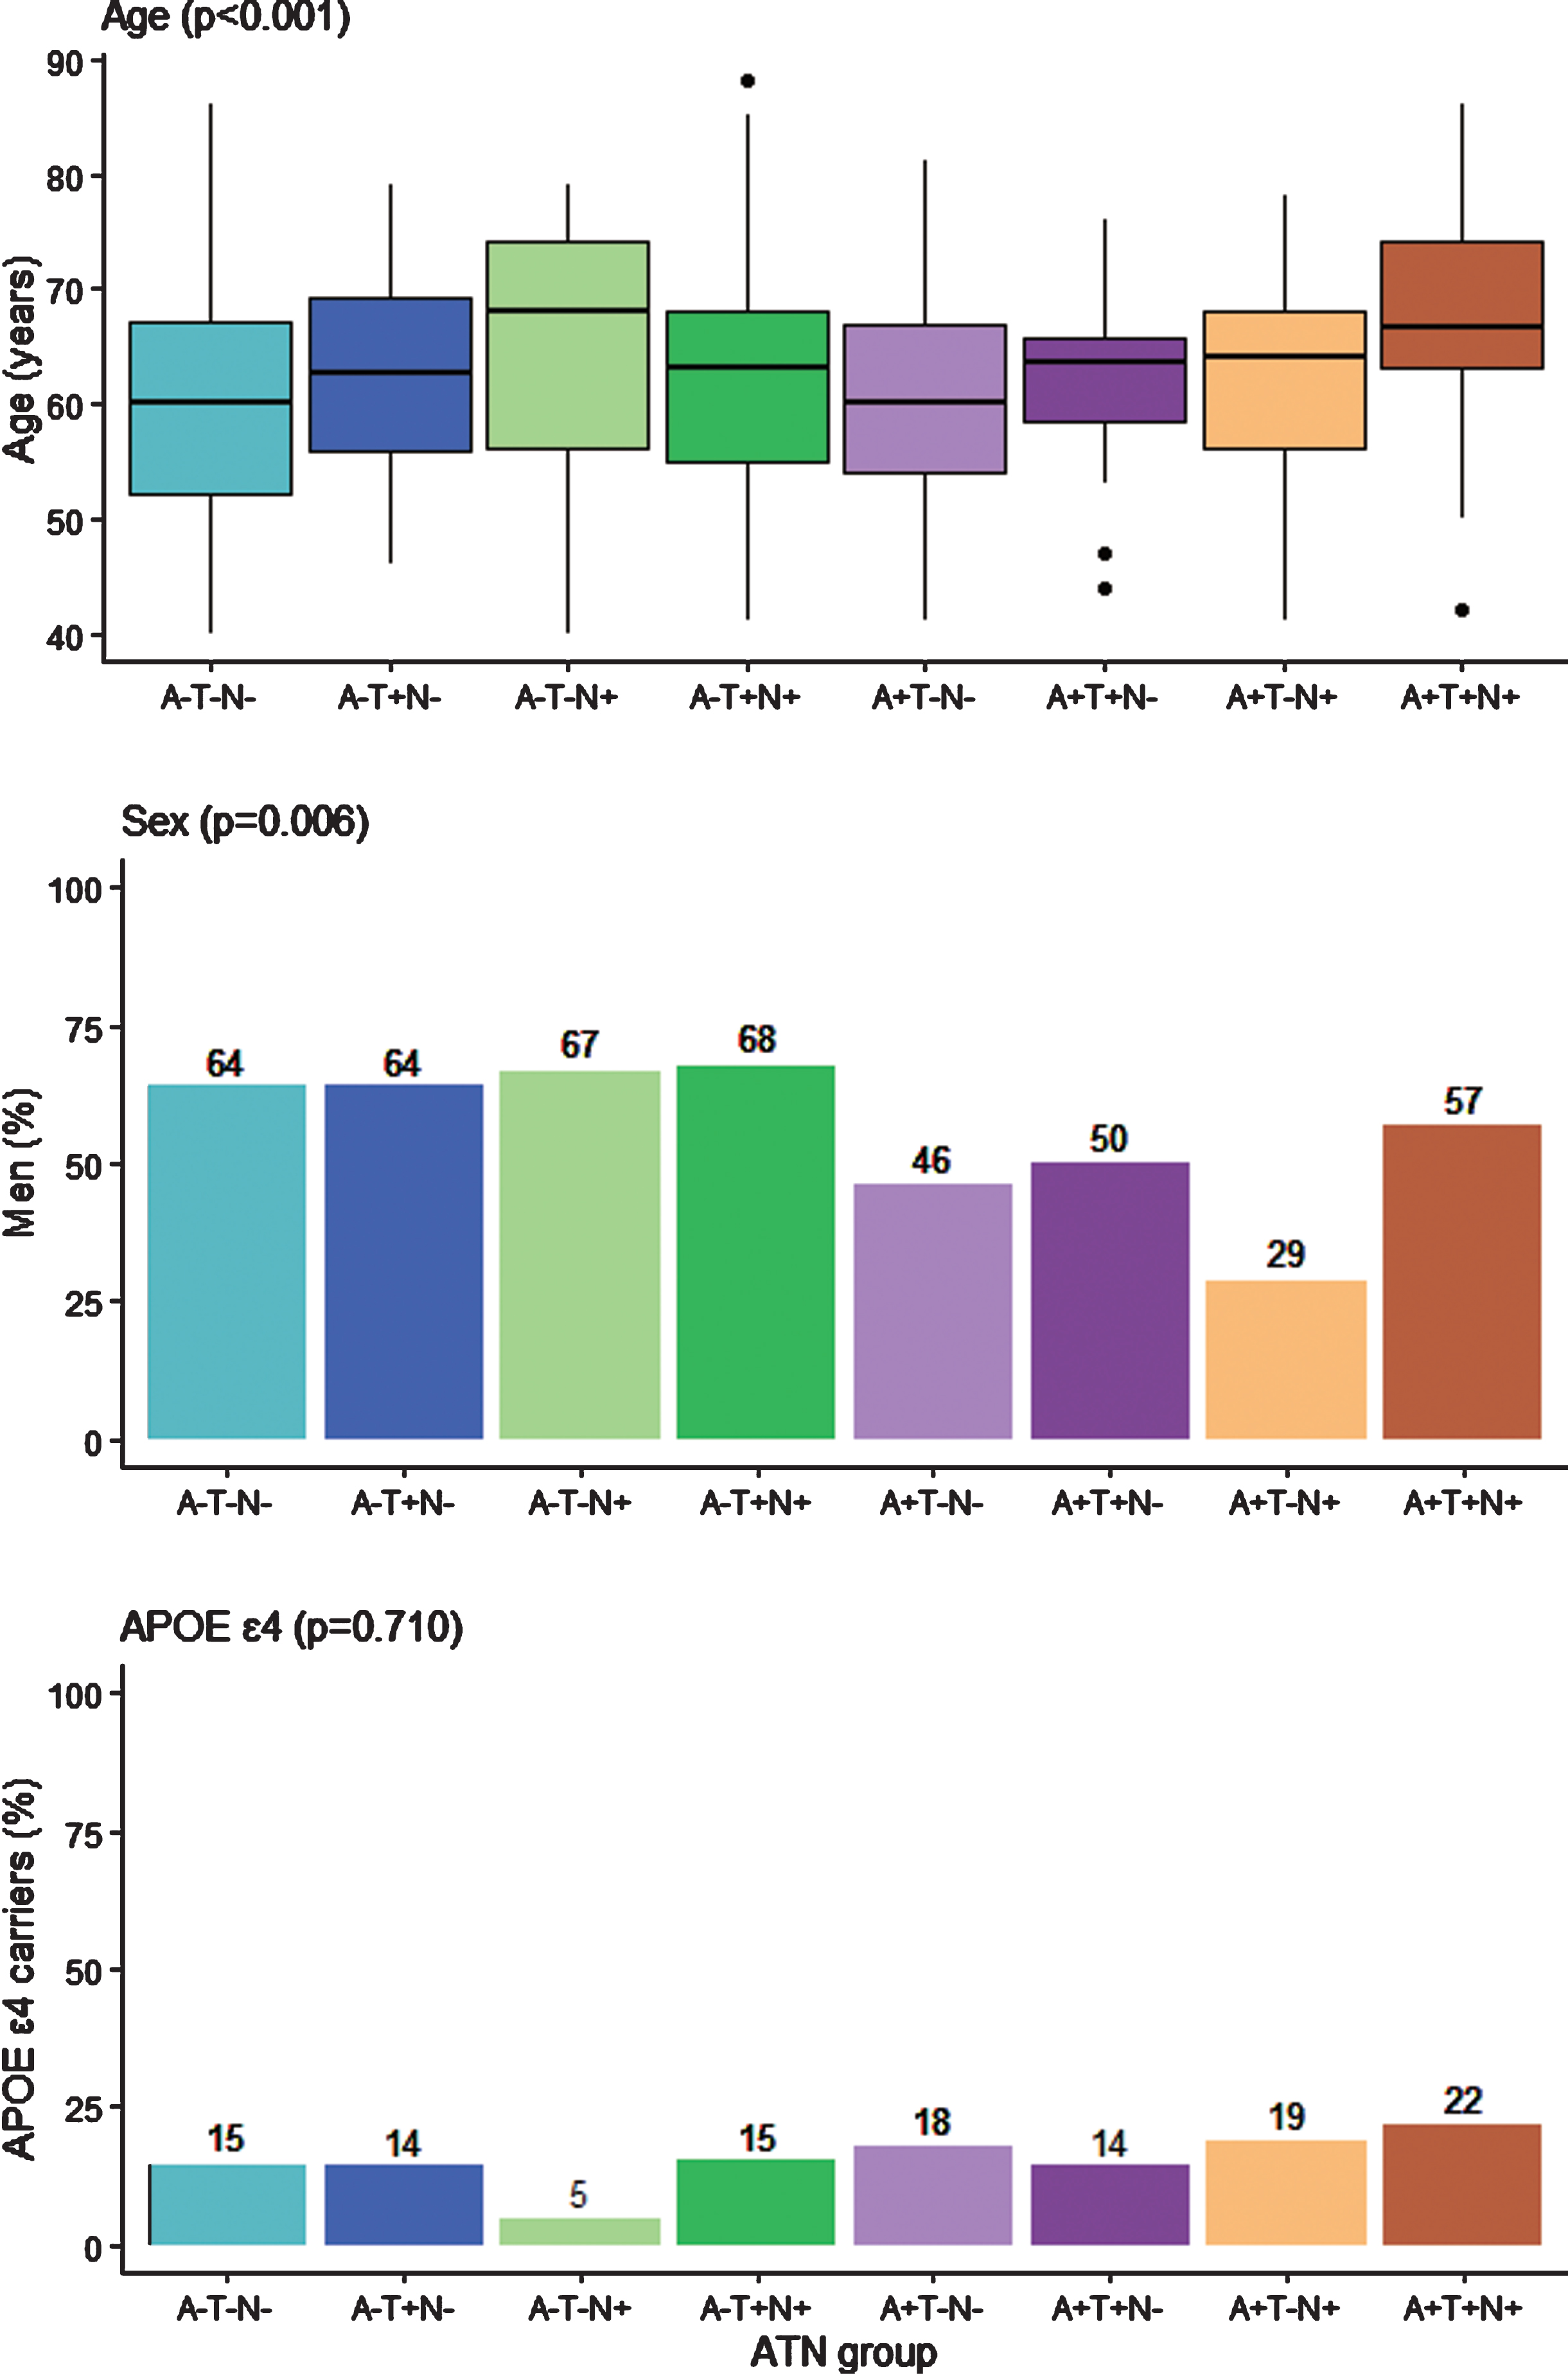
ATN group characteristics of all 561 participants. Box plot of age by ATN biomarker group of all 561 participants and bar charts summarizing percentages of categorical variables from Table 1. p values are from the Pearson Chi-Square, Fisher’s exact test, or Kruskal-Wallis test, reflecting any difference in each variable among the eight groups. The box plot whiskers extend to the lowest and highest data points within 1.5 times the inter quartile range from the lower and upper quartiles. The dots represent individual points that fall outside this range. APOE, Apolipoprotein E; ATN, amyloid, tau, and neurodegeneration or neuronal injury; A–, amyloid normal using CSF Aβ42/40; A+, amyloid abnormal using CSF Aβ42/40; T–, tau normal using CSF p-tau; T+, tau abnormal using CSF p-tau; N–, neurodegeneration or neuronal injury normal using CSF t-tau; N+, neurodegeneration or neuronal injury abnormal using CSF t-tau.
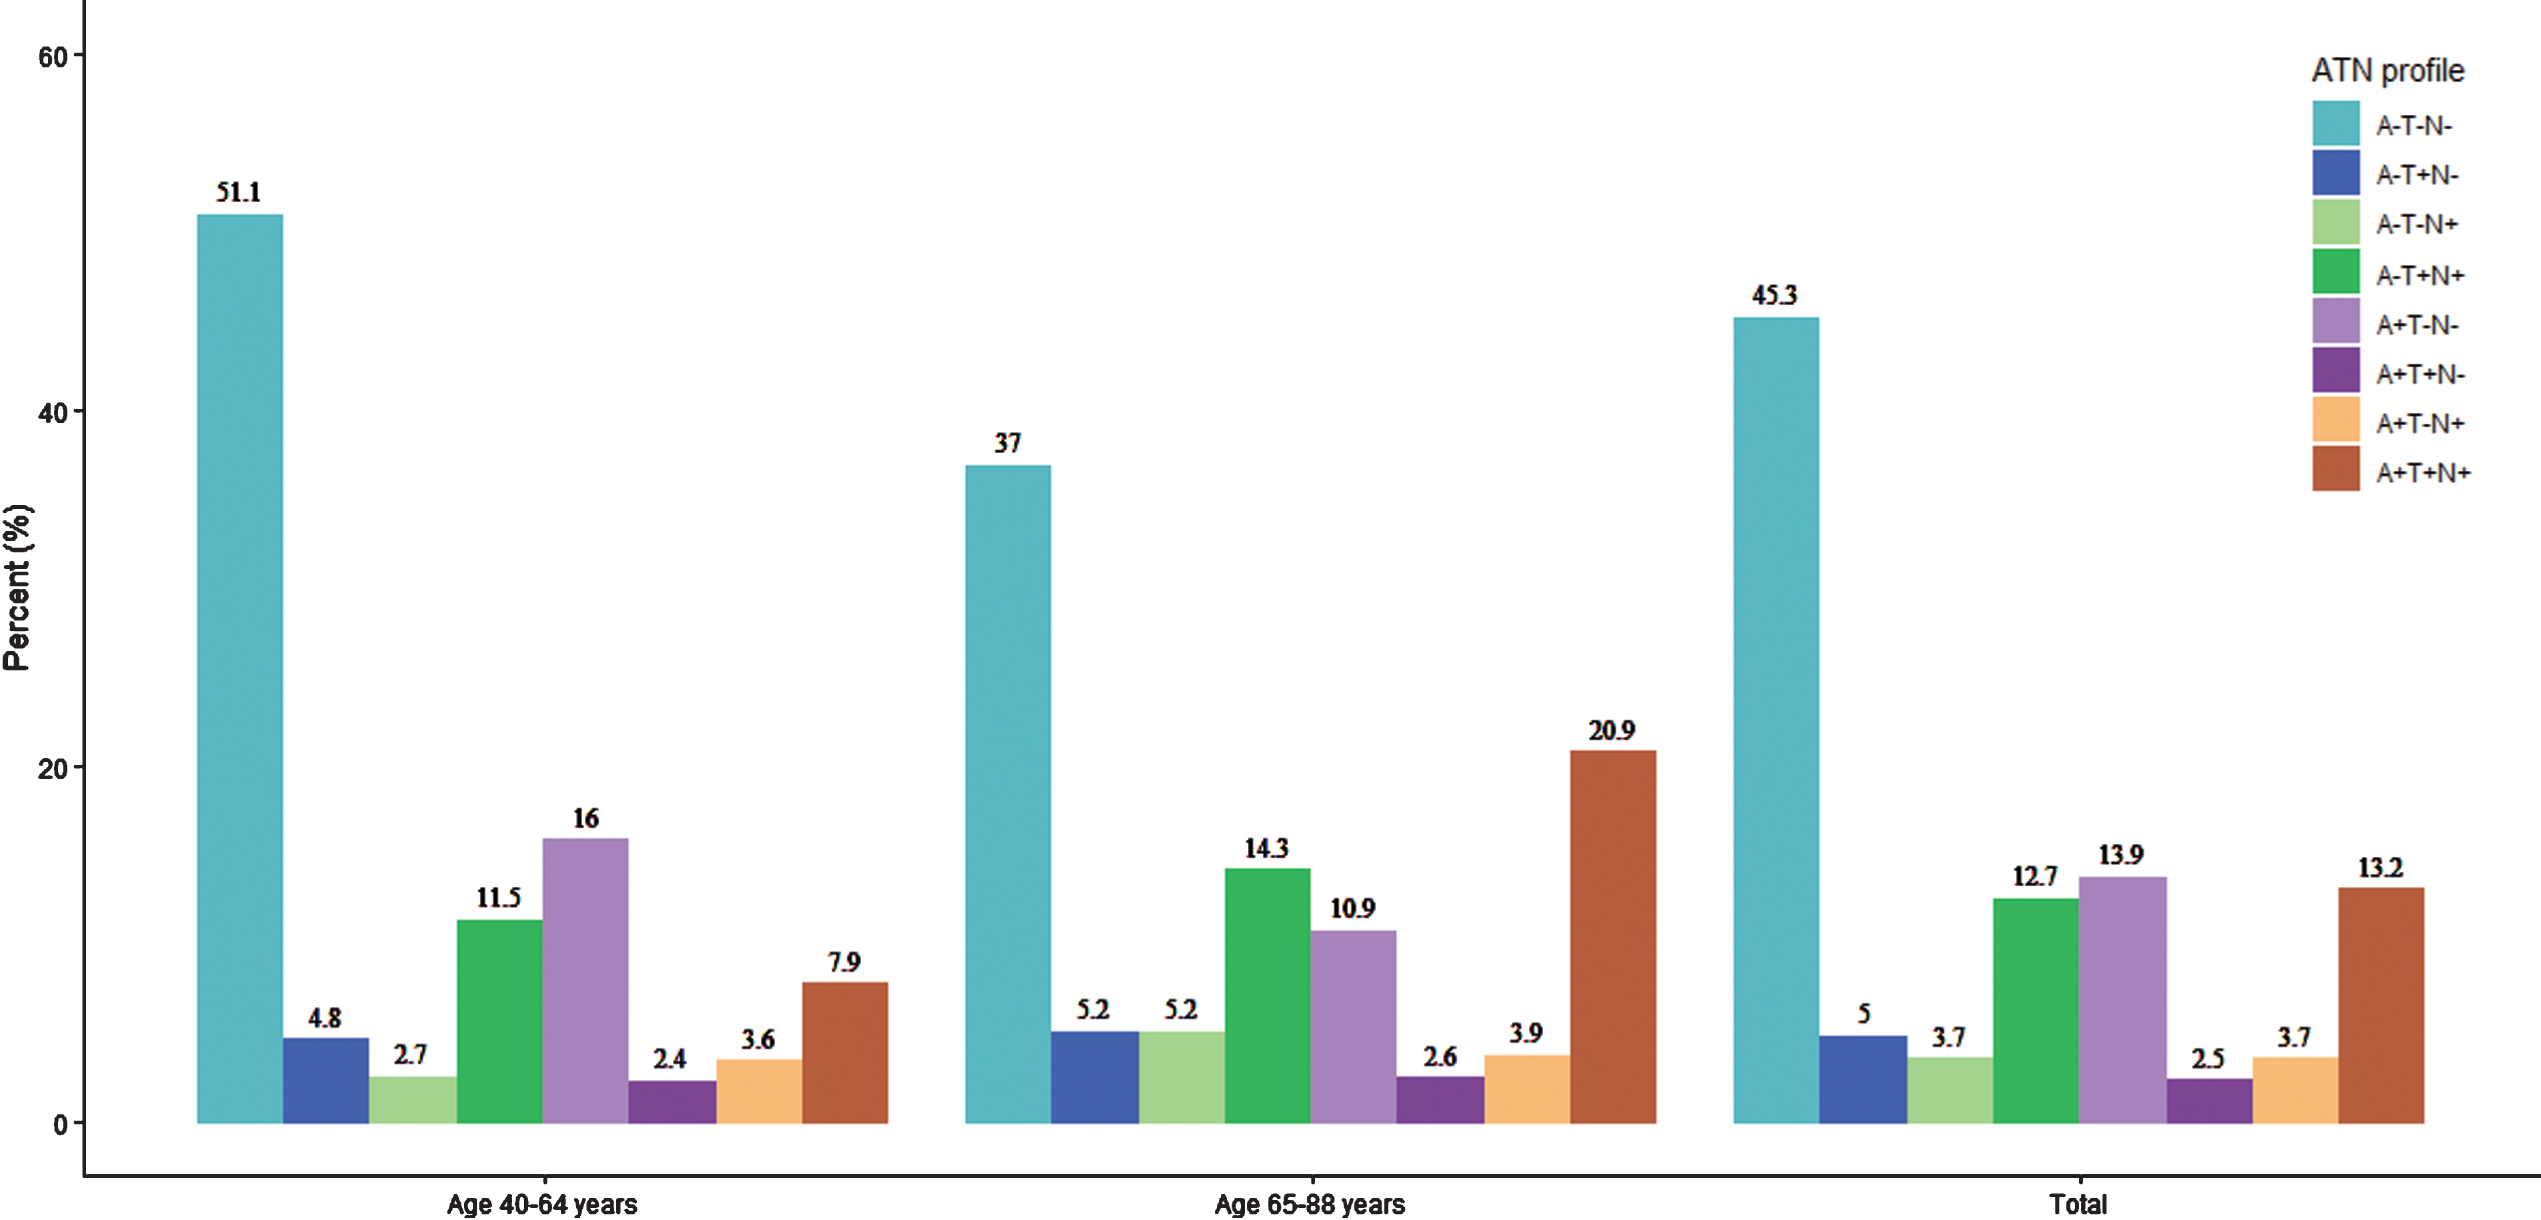
Frequency distributions of ATN profiles among different groups. The distributions of the eight ATN profiles in the two age groups and total cognitively intact participants. ATN, amyloid, tau, and neurodegeneration or neuronal injury; A–, amyloid normal using CSF Aβ42/40; A+, amyloid abnormal using CSF Aβ42/40; T–, tau normal using CSF p-tau; T+, tau abnormal using CSF p-tau; N–, neurodegeneration or neuronal injury normal using CSF t-tau; N+, neurodegeneration or neuronal injury abnormal using CSF t-tau.
Age differed among ATN groups (p < 0.001) with individuals in N+ groups tending to be older. After correcting for multiple comparisons using the Bonferroni procedure, we observed statistically significant differences between A-T-N- and A + T+N+ (p < 0.001), A + T-N- and A + T+N+ (p < 0.001). Sex ratio varied by ATN profile (p = 0.006) and A+ groups included more female individuals (p < 0.001). Female had more abnormal amyloid-β burden (42%) than male (27%). The group with the greatest proportion of men was A-T-N+ (68%); the group with the greatest proportion of women was A + T-N+ (71%). The number of APOE ɛ4 carriers did not show statistically significant differences among the ATN profiles (p = 0.710).
As shown in Fig. 3, for both men and women, the prevalence of A-T-N- declined with age while that of A + T+N+ increased continuously with age. A + T-N- reached peak in prevalence at the middle age 50 s and then declined markedly. The prevalence of remaining groups (A-T+N-, A-T-N+, A-T+N+, A + T-N+, and A + T+N-) did not show obvious tendency with age and were at a lower level throughout. Figure 3C and Fig. 3D showed a numerically higher level of A + T+N+ estimated prevalence in APOE ɛ4 carriers than APOE ɛ4 non-carriers and was remarkable from about age 50. The overall ATN prevalence tendencies with age were parallel either separated by sex or APOE ɛ4 status. When estimated prevalence were averaged over sex or APOE ɛ4 to show the direct age-specific prevalence, A-T-N- was the most prevalent group from age 40 to about age 80 s. From age 80 s onwards, A + T+N+ was the most prevalent group.
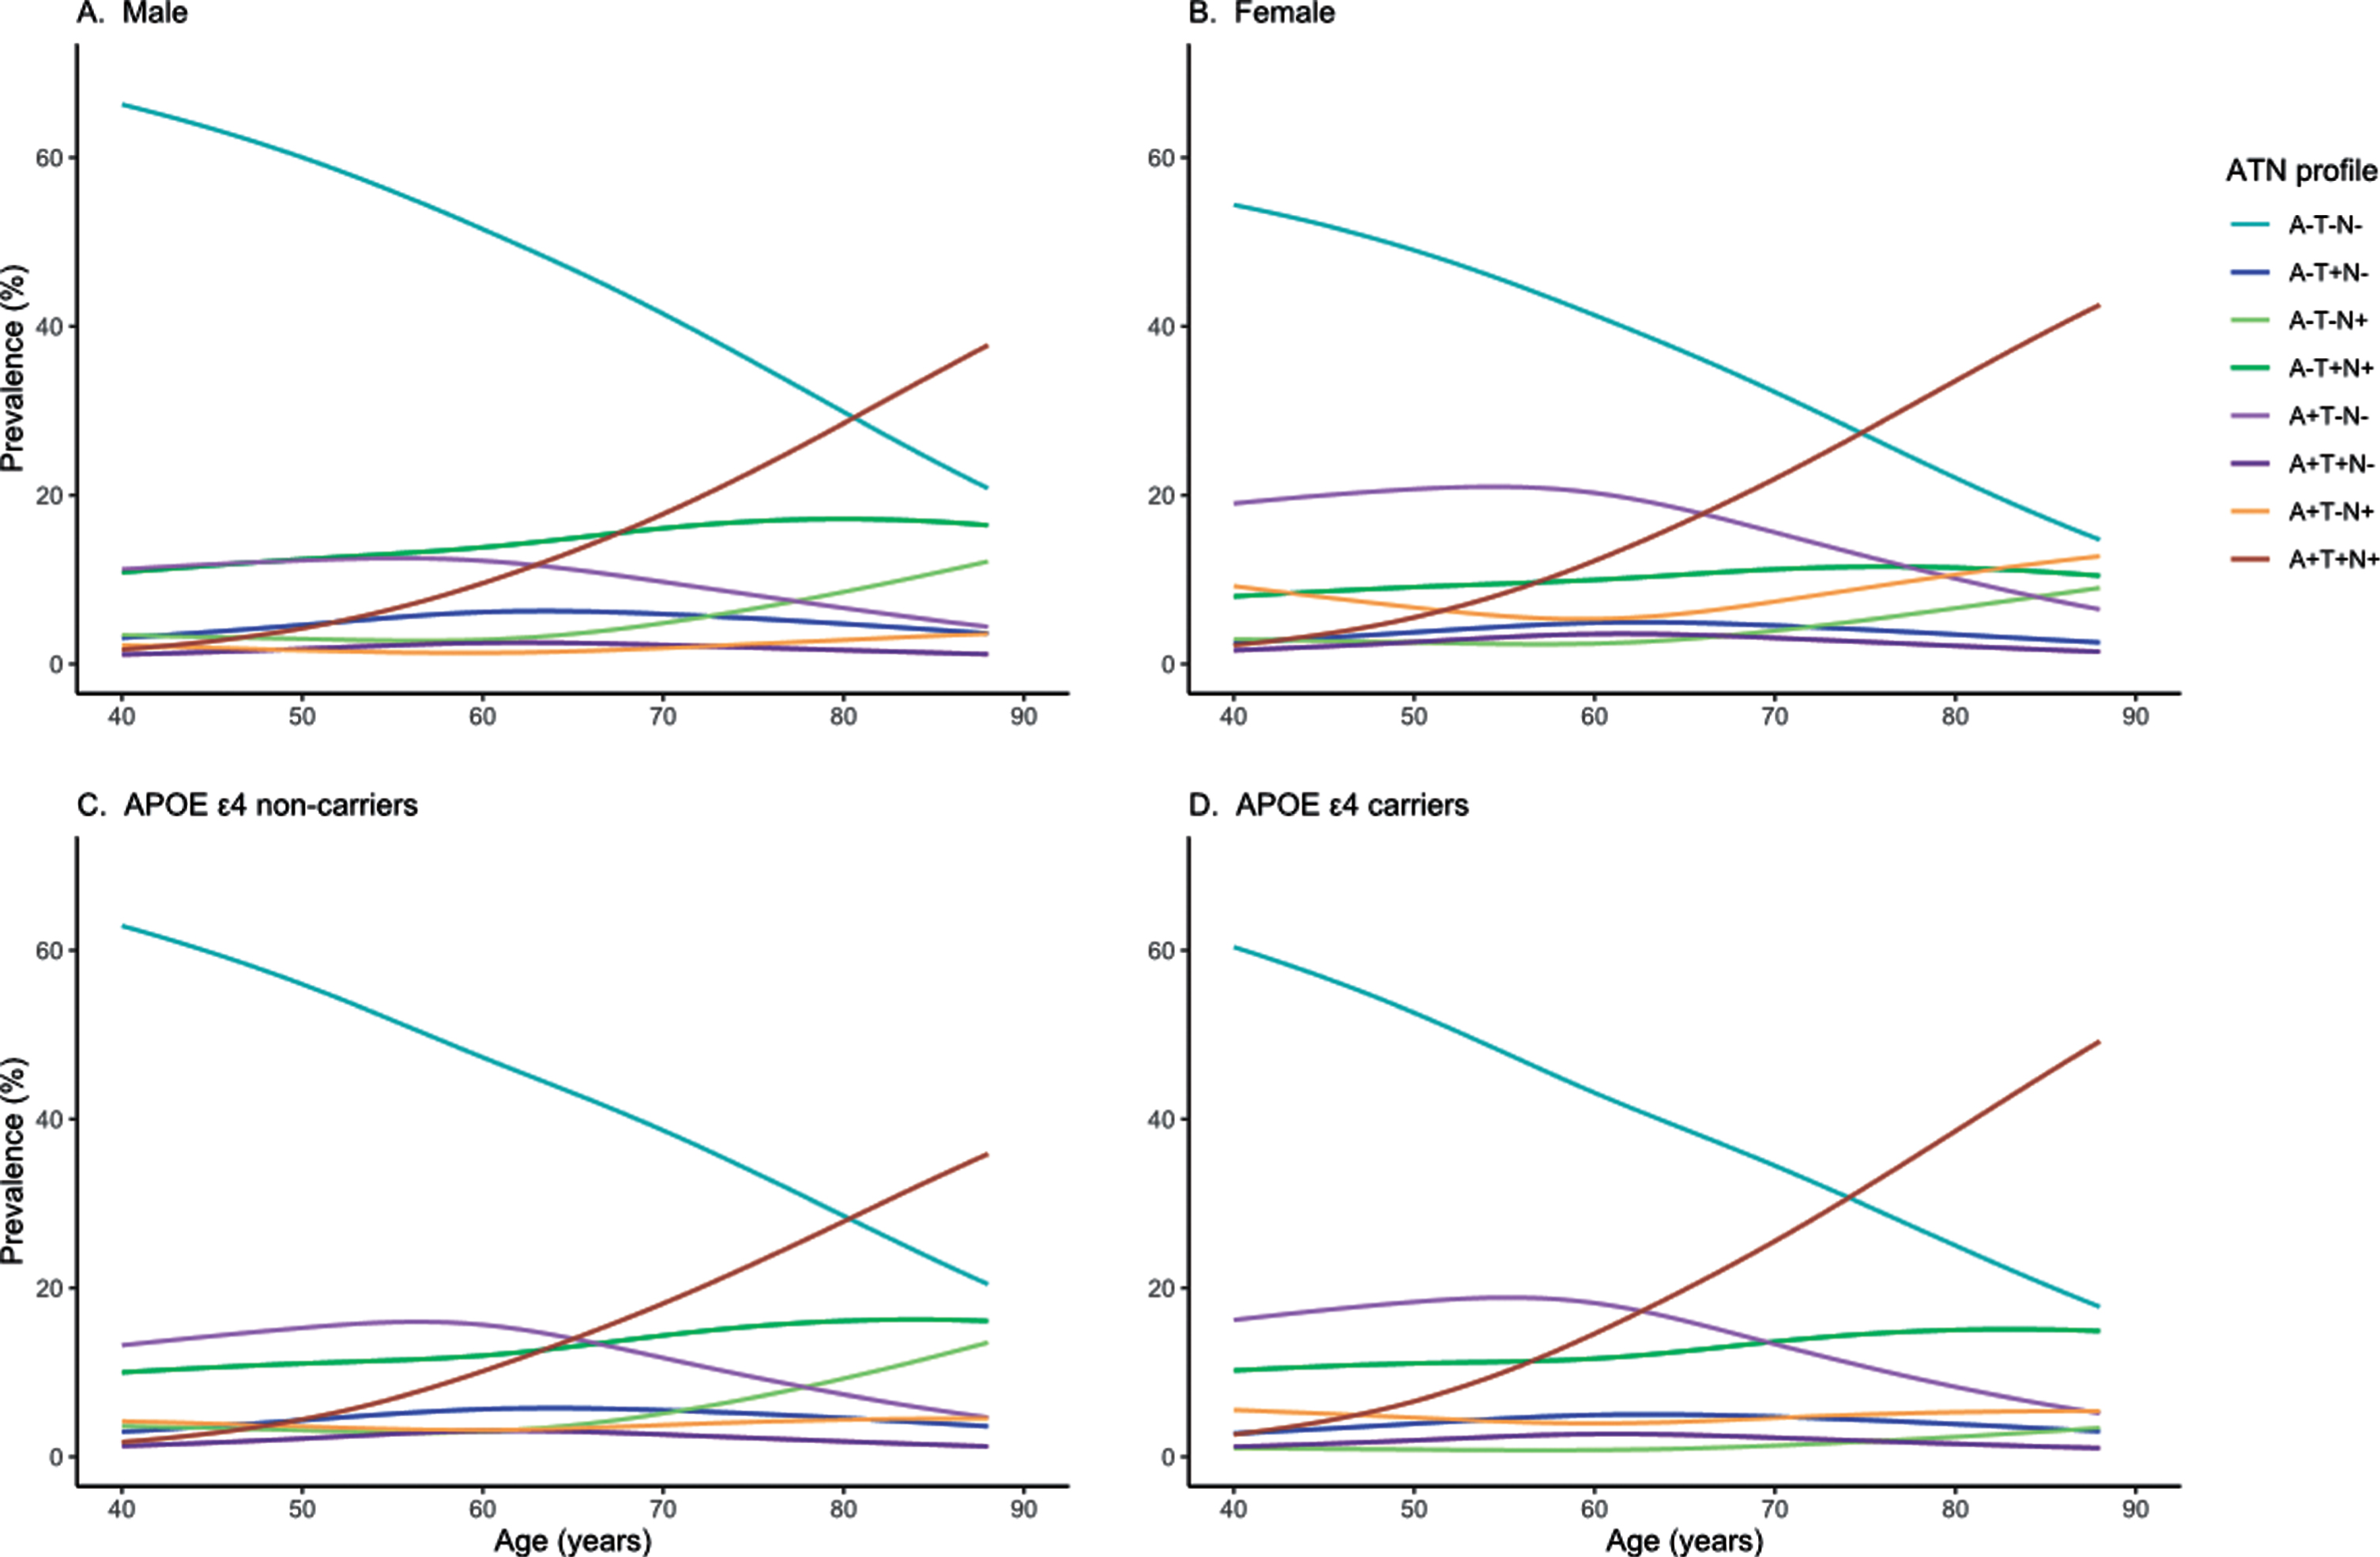
Estimated prevalence of the ATN biomarker groups by age. Estimated prevalence curves by age and sex for all ATN groups (A), and estimated prevalence curves by age and APOE ɛ4 for all ATN groups (B). APOE, Apolipoprotein E; ATN, amyloid, tau, and neurodegeneration or neuronal injury; A–, amyloid normal using CSF Aβ42/40; A+, amyloid abnormal using CSF Aβ42/40; T–, tau normal using CSF p-tau; T+, tau abnormal using CSF p-tau; N–, neurodegeneration or neuronal injury normal using CSF t-tau; N+, neurodegeneration or neuronal injury abnormal using CSF t-tau.
Figure 4 showed the estimated distribution of each ATN group at ages 50 and 80 years, which illustrated that the presence of having more than one abnormality in A, T, and N was common at old ages than at middle ages.

Estimated distribution of each ATN group at ages 50 and 80 years. Venn diagrams depicting the estimated distribution of all 561 subjects by ATN classification at ages 50 years (A) and 80 years (B). Graphic areas roughly reflect the proportion of each group. A–, amyloid normal using CSF Aβ42/40; A+, amyloid abnormal using CSF Aβ42/40; T–, tau normal using CSF p-tau; T+, tau abnormal using CSF p-tau; N–, neurodegeneration or neuronal injury normal using CSF t-tau; N+, neurodegeneration or neuronal injury abnormal using CSF t-tau.
DISCUSSION
Some previous literatures based on different cohorts showed different results in the prevalence of the ATN groups [7, 19]. Our finding of the ATN prevalence was comparable to a study from the longitudinal Australian Imaging, Biomarker & Lifestyle (AIBL) cohort [19], but had some differences from others. We showed a lower proportion of A-T-N+ profile and a higher proportion of A-T+N+ comparing to a study from the Mayo Clinic Study of Aging (MCSA) cohort [7]. The CN participants in a previous literature based on the Alzheimer’s Disease Neuroimaging Initiative (ADNI) study [18] accounts more in A±T+N- and less in A-T-N than our results, which we interpreted as the older ages of participants in this ADNI study [18]. Besides, different ATN definition by neuroimaging or CSF biomarkers might result in the different prevalence. The MCSA study [7] used amyloid PET, tau PET and structural MRI to define A, T, and N. The ADNI study [18] used both neuroimaging and CSF biomarkers, while the AIBL cohort [18] and our study were based on same CSF biomarkers and showed comparable ATN prevalence. The CSF biomarker level was obtained from a CSF immunoassay and different techniques may generate different results. Our study and the ADNI study defined T by CSF p-tau with the same tau phosphorylation site but using different kit, which might lead to differences. Additionally, different cutoff points of CSF biomarkers and the lower number of APOE ɛ4 carriers in our study might also result in the differences from other studies. In our data, the resulting proportion of individuals in the 2011 NIA-AA preclinical stages was comparable to the previous study [20].
We used cross-sectional prevalence curves to understand the pathological progressing pattern and direction of ATN biomarker combination. The differences of estimated prevalence across age 40 to 88 years among eight ATN groups were largely interpreted as transition from one group to another with age increasing, as interpreted in a previous literature [7]. Thus, our findings were interpreted that individuals can transition from group with normal AD biomarkers (A-T-N-) to abnormal groups and from other groups to preclinical AD category (A + T+N+).
There is an interesting turning point at about age 50 to 60 years in our data. Before about age 50, the increase of A + T+N+ prevalence was indistinctive, which was interpreted that the earliest evidence of AD pathophysiological changes lay beneath the threshold of AD biomarkers when people were young, as an updated hypothetical model of dynamic biomarkers proposed [21]. After the “turning point”, A±T-N- prevalence declined markedly, and A + T+N+ prevalence increased rapidly. We interpreted that tauopathy and neurodegeneration progressed with time [21], remarkably after about late age 50 s. Accordingly, we chose ages 50 to represent individuals of age 40–64 years and ages 80 to represent individuals of age 65–88 years. We used Venn diagrams of ages 50 and 80 years to intuitively show the differences of ATN estimated distribution between the two subgroups (Fig. 4).
Individuals with a normal amyloid biomarker but with abnormal T or N, or both (A-T+N-, A-T-N+, and A-T+N+) have been labeled “suspected non-Alzheimer’s pathophysiology” (SNAP) [20]. In our data, about 21% of individuals were classified as SNAP, which was similar to other biomarker/imaging literatures on SNAP [8, 22]. Tau pathology in the absence of Aβ deposits (tau+/Aβ-) or with minimal Aβ deposits in cognitively normal aged individuals was described as “primary age-related tauopathy” (PART) [23]. Researcher suggests that PART-type pathologic changes may underlie a subset of persons with the SNAP biomarker profile in the broader population [23]. From the definition from literatures, the link between SNAP and PART was evident [24]. We postulate that SNAP and PART has similar pathology (A-N+) and pathological sequences. It has even been debated whether this entity represents an early stage of AD with Aβ-independent processes [24–26] or merely reflects a neurodegenerative process at an early stage [7, 27].
Abnormal CSF p-tau and t-tau were both defined as neurodegeneration in the 2011 NIA-AA criteria [1–4]. However, CSF t-tau and p-tau diverge in conditions with acute brain damage, such as traumatic brain injury and stroke that correlates with the severity of neuronal damage [28, 29]. CSF t-tau reflects the intensity of neuronal damage at a specific point while p-tau seems more specific for the burden of AD-type tau pathology accumulated over time [30]. The AT(N) classification differentiates between p-tau (T) and t-tau (N) [5, 6]. Although A-T+N- and A-T-N+ were both considered as SNAP, they might reflect different biological progress. Tau and neurodegeneration biomarkers were discordant in a considerable part of individuals categorized as SNAP: 39% at age 50 years and 43% at age 80 years. We postulate that the A-T-N+ profile corresponds to neurodegeneration due to non-AD pathologies. A logical assumption is that the A-T+N- profile corresponds to an early stage of AD with Aβ-independent processes. However, studies of autopsy or longitudinal design are needed to confirm these hypotheses. A + T-N-, A + T+N-, A + T-N+, and A + T+N+ profiles represent “Alzheimer’s continuum” category [5]. We believe that A + T-N- and A + T-N+ indicate meaningfully different pathologic states: both represents AD pathologic change while in the A + T- context, non-AD neurodegeneration or neuronal injury lead to N+ [7].
The demographic characteristics showed some interesting differences among eight ATN profiles. Individuals in N+ groups were older than N- groups. This finding is reasonable because with increasing age, there may be increasing susceptibility to multimorbidity which is confirmed to be associated with N+ [31]. In our data, female had more abnormal Aβ burden (42%) than male (27%). However, a study showed different result [32]. APOE ɛ4 carriers showed a numerically greater prevalence of A + T+N+ profile which is classified as preclinical AD and may be shortly before clinical symptoms first appear [1, 2]. This finding is consistent with the idea that as one of genetic risk factors for sporadic AD [33], APOE ɛ4 is associated with increased Aβ burden [34] as well as increased cerebral tau pathology [35].
Our study had some limitations. The number of some groups was small, which may lead to the lack of statistically significant. Dichotomizing each biomarker simplifies what is an underlying continuous process. We emphasize that binary (+/-) categorization does not imply that individuals who fall below the cut point for a particular biomarker have no pathology in the brain. The binary (+/-) categorization is economy, conceptual clarity and ease of use. One alternative is to score the severity of each biomarker on a continuous or semicontinuous scale [6]. The cutoffs we used for dichotomous stratification were roughly set on 1/3 sensitivity for abnormality of each biomarker. This method is based on previous studies but may lack precision and still needs to be proved, especially in Chinese population. The estimated prevalence curves by age were cross-sectional curves, which cannot describe longitudinal changes. Our inferences of these ATN profiles need to be scrutinized further in longitudinal studies.
In conclusion, our study described the prevalence of preclinical stages of AD in Chinese cognitively intact older adults and found some significant differences of demographic characteristics among ATN profiles. Longitudinal studies of the ATN classification system are urgently needed to scrutinize clinical implications of our findings.
Footnotes
ACKNOWLEDGMENTS
The authors thank the colleagues who have made contributions to build the CABLE cohort. The authors also thank the subjects and their family for their cooperation in this study. This study was supported by grants from the National Key R&D Program of China (2018YFC1314700), the National Natural Science Foundation of China (91849126), Shanghai Municipal Science and Technology Major Project (No.2018SHZDZX01) and ZHANGJIANG LAB, Tianqiao and Chrissy Chen Institute, and the State Key Laboratory of Neurobiology and Frontiers Center for Brain Science of Ministry of Education, Fudan University.
