
Abstract
Background:
Cortical iron accumulation has been reported as a pathological feature of Alzheimer’s disease (AD). The cause of cortical iron elevation in AD is unknown but may be contributed by hemosiderin deposits in cerebral microbleeds that frequently occur in this disease.
Objective:
To investigate the impact of cerebral microbleeds (which are more frequent in AD) on the magnetic susceptibility of the surrounding brain tissue.
Methods:
32 MRI scans from the Australian Imaging, Biomarker and Lifestyle (AIBL) study were found to have cerebral microbleeds by manual assessment of susceptibility weighted images. Quantitative susceptibility mapping (QSM; an MRI technique that is sensitive to iron) was used to estimate iron content in the tissue surrounding the microbleed in four concentric radii. Furthermore, the mirror regions on the contralateral hemisphere were also demarcated. A simulation analysis was conducted to investigate the effect of QSM imaging on cerebral microbleeds with varying sizes.
Results:
77 microbleeds were identified from the available scans. The immediate proximal region to the cerebral microbleeds had enhanced tissue susceptibility (∼0.02 PPM), but importantly, this did not extend beyond one voxel radius. This finding with in vivo data was also replicated in a simulation study. However, the presence of microbleeds could lead to over-estimation of tissue QSM in unsupervised quantification, therefore processing methods to avoid this artefact without the need for their manual identification are proposed.
Conclusion:
The local changes in susceptibility due to microbleeds outside the focal lesion are restricted to 1 voxel and may be explained by partial voluming artefacts caused by limited imaging resolution. The susceptibly change induced by the microbleed is a relatively small proportion of tissue and could not account for regional iron changes observed in AD cortex.
Keywords
INTRODUCTION
Cerebral microbleeds (CMBs) are a common vascular pathology that emerges with age: 17.8% of people aged in their 60s have CMBs, which increases to 38.3% in those aged over 80 [1]. These lesions are frequently caused by cerebral amyloid angiopathy [2] and are associated with more severe white matter hyperintensity [3], APOE ɛ4 status [3], and amyloid-β load detected by PET [4, 5]. CMBs have been considered as asymptomatic findings but are associated with an increased risk of cognitive decline and dementia [6]. We have also shown that the incidence of CMBs was 6-fold higher in cognitively normal people with evidence of amyloid-β plaques, compared to cognitively normal people without amyloid-β deposition [7]. Therefore, CMBs are common findings in aging and dementia cohorts, and it is possible that they adversely impact on disease progression.
CMBs are small hemosiderin deposits that are rich in iron and are the result of blood leakage from the ruptures in small blood vessels [2]. The strong paramagnetic and ferromagnetic properties of iron allow for sensitive imaging of microbleeds in the brain using T2* gradient-recall echo (GRE) sequence and further enhanced with susceptibility weighted imaging (SWI) and quantitative susceptibility mapping (QSM) MRI modalities. It is unknown whether microbleeds extrude iron to the surrounding tissue, or whether the iron is contained in the microbleed. This may be important because iron can damage the brain via oxidative stress and the regulated cell death pathway termed ferroptosis [8]. Indeed, iron has been reported to be elevated in AD-affected brain [9–11], and with fluid and imaging biomarker studies of brain iron burden showing increased iron in AD participants [12–14], and further studies showing iron loading in the brain predicting disease progression [11, 13–17].
The specific factors that lead to brain iron elevation in AD are unknown. Microbleeds that increase with age and disease may be a contributing factor, which we investigated here by examining QSM (an MRI technique that is sensitive to iron levels) signals in the tissue surrounding CMBs. Also, from the perspective of regional QSM quantification processing, microbleeds may confound these measures, by biasing the average calculation of the QSM measurement in the region of interest of the brain parenchyma. This may be important because microbleeds are currently identified manually, and if they are not first identified and excluded from the quantification, they have the potential to cause overestimation of the regional QSM measurements.
MATERIAL AND METHODS
Subjects
The Australian Imaging, Biomarkers and Lifestyle (AIBL) study [18] study was approved by the institutional ethics committees of Austin Health, St Vincent’s Health, Hollywood Private Hospital and Edith Cowan University, and all volunteers gave written informed consent before participating in the study. A subset of 32 subjects from the AIBL study was selected for this study due to their MRI scans revealing the presence of one or more microbleeds, and had an accompanying QSM image. The 32 included subjects were classified clinically as either cognitively normal (CN; N = 17), mild cognitive impairment (MCI; N = 10), or Alzheimer’s disease (AD; N = 5). The detailed characteristics are presented in Table 1. The focus of this study was not to compare the differences in microbleeds between disease groups, but, rather, to investigate the impact of CMBs (which are more frequent in AD [7]) on the magnetic susceptibility of the surrounding brain tissue.
Subject demographics
Image acquisition
Subjects underwent anatomical T1-weighted (T1W) and SWI acquisitions on a 3T Siemens TRIO scanner with 12-channel head coil. The SWI were automatically reconstructed online using the scanner system (software VB17). T1W images were acquired using a standard 3D magnetization-prepared rapid gradient-echo sequence with in-plane resolution 1.0×1.0 mm, slice thickness 1.2 mm, repetition-time/echo-time/T1 = 2.300/2.98/900, flip angle 9°, field of view 240×256, and 160 slices. The 3D SWIs were acquired with 0.93×0.93 mm in-plane resolution and 1.75 mm slice thickness, field of view 176×256, and 80 slices, repetition time/echo time of 27/20 ms, and flip angle 20°. The magnitude and phase images of the SWI sequence were retrospectively reconstructed for each head coil channel from the k-space data.
Microbleed identification using SWI data
For microbleed identification, 3D SWIs were manually inspected by two clinical experts using the MARS rating method (the microbleed anatomical rating scale [19]), and labelled potential CMBs as definite and possible. CMBs are considered as spherical hypointense lesions smaller than or equal to 10 mm [20]. After independent reading by the two readers, a consensus was reached for presence and number of lesions on each scan. The agreement between readers 1 and 2 was 83% (κ= 0.65); reader 1 versus consensus 91% (κ= 0.8); and reader 2 versus consensus 91% (κ= 0.83). For this investigation, we only considered definite CMBs on the baseline scan of subjects who had an available QSM image.
A total of 77 definite CMBs were identified by two clinical experts inspecting 32 SWI baseline scans. The prevalence of CMBs were 48 for CN, 18 for MCI, and 11 for AD subjects. The detailed characteristics information is presented in Table 1.
Image processing
For retrospective QSM image reconstruction, first a brain mask was generated from the bias-field corrected SWI-magnitude image (after combining the coil data) using FSL’s BET with the robust parameter set. A Laplacian-based method was used to unwrap each coil SWI-phase image followed by background field elimination using vSHARP [21]. The corrected phase images were then combined by weighting the magnitude of the corresponding channel. STI Suite software (v2.2) [22] was used for QSM reconstruction by performing dipole inversion using an iLSQR technique.
The QSM and corresponding CMB mask were co-registered to the T1W data and were then rigidly aligned to standard Montreal Neurological Institute (MNI) space (with 1×1×1 mm3 resolution) using the open-source Mirorr tool [23]. A fixed plane in the mid-sagittal section of the MNI space was then considered for separating the left and right hemisphere. Due to the minor appearance differences of CMBs between QSM and SWI images, the voxels representing CMBs were manually redefined by an expert on QSM image (hyperintense voxels).
Simulation
In order to investigate the partial voluming effects (the loss of contrast between two neighboring tissues caused by insufficient resolution) and QSM-algorithmically-induced effects on the presence of CMBs, artificial CMBs with varying sizes were synthesized. The simulated images were generated by finely sampling several objects in the image domain using a large matrix size (512×512×512). The objects were primitive shapes representing different brain structure such as ventricles, skull, cerebrospinal fluid (CSF), gray matter (GM), white matter (WM), caudate, putamen, and pallidum. A set of CMBs of radii [4 : 1:24] with a susceptibility value of 20 ppb was placed in the middle of the WM with susceptibility of 23 ppb. The field perturbation maps were computed by convolving the synthesized susceptibility maps with a dipole kernel in the frequency domain. The gyromagnetic ratio, B0 of 3.0Tesla, and TE of 20 ms were used to compute the phase image. To simply impose the partial voluming effect, the phase images were downsampled to (128×128×128) using cubic interpolation when transformed to the complex domain. The QSM deconvolution was performed using the iLSQR technique with the same parameters as the in vivo experiments. An example of such a susceptibility map with a CMB of radius 1 is shown in Fig. 3A.
Analysis
To investigate the influence that the presence of CMBs may have in calculation of regional susceptibility, a small 3D region-of-interest (ROI) of size 5×5×5 voxel was considered around CMBs. For computing regional susceptibility, three different methods including mean, median, and Gaussian fitting were considered.
Demarcation of four concentric radii (R1–4, of an increasing radius of 1 voxel [1×1×1 mm3]) emanating from the outer boundary of the CMB was undertaken as shown in Fig. 1C, for both SWI and simulated images. The mirror regions on the contralateral hemisphere were also demarcated. For verifying the effect of CMBs on susceptibility in adjacent tissues, a comparison between QSM measurements in the surrounding tissue of the CMB and the mirror region on the contralateral hemisphere were analyzed using ANOVA.
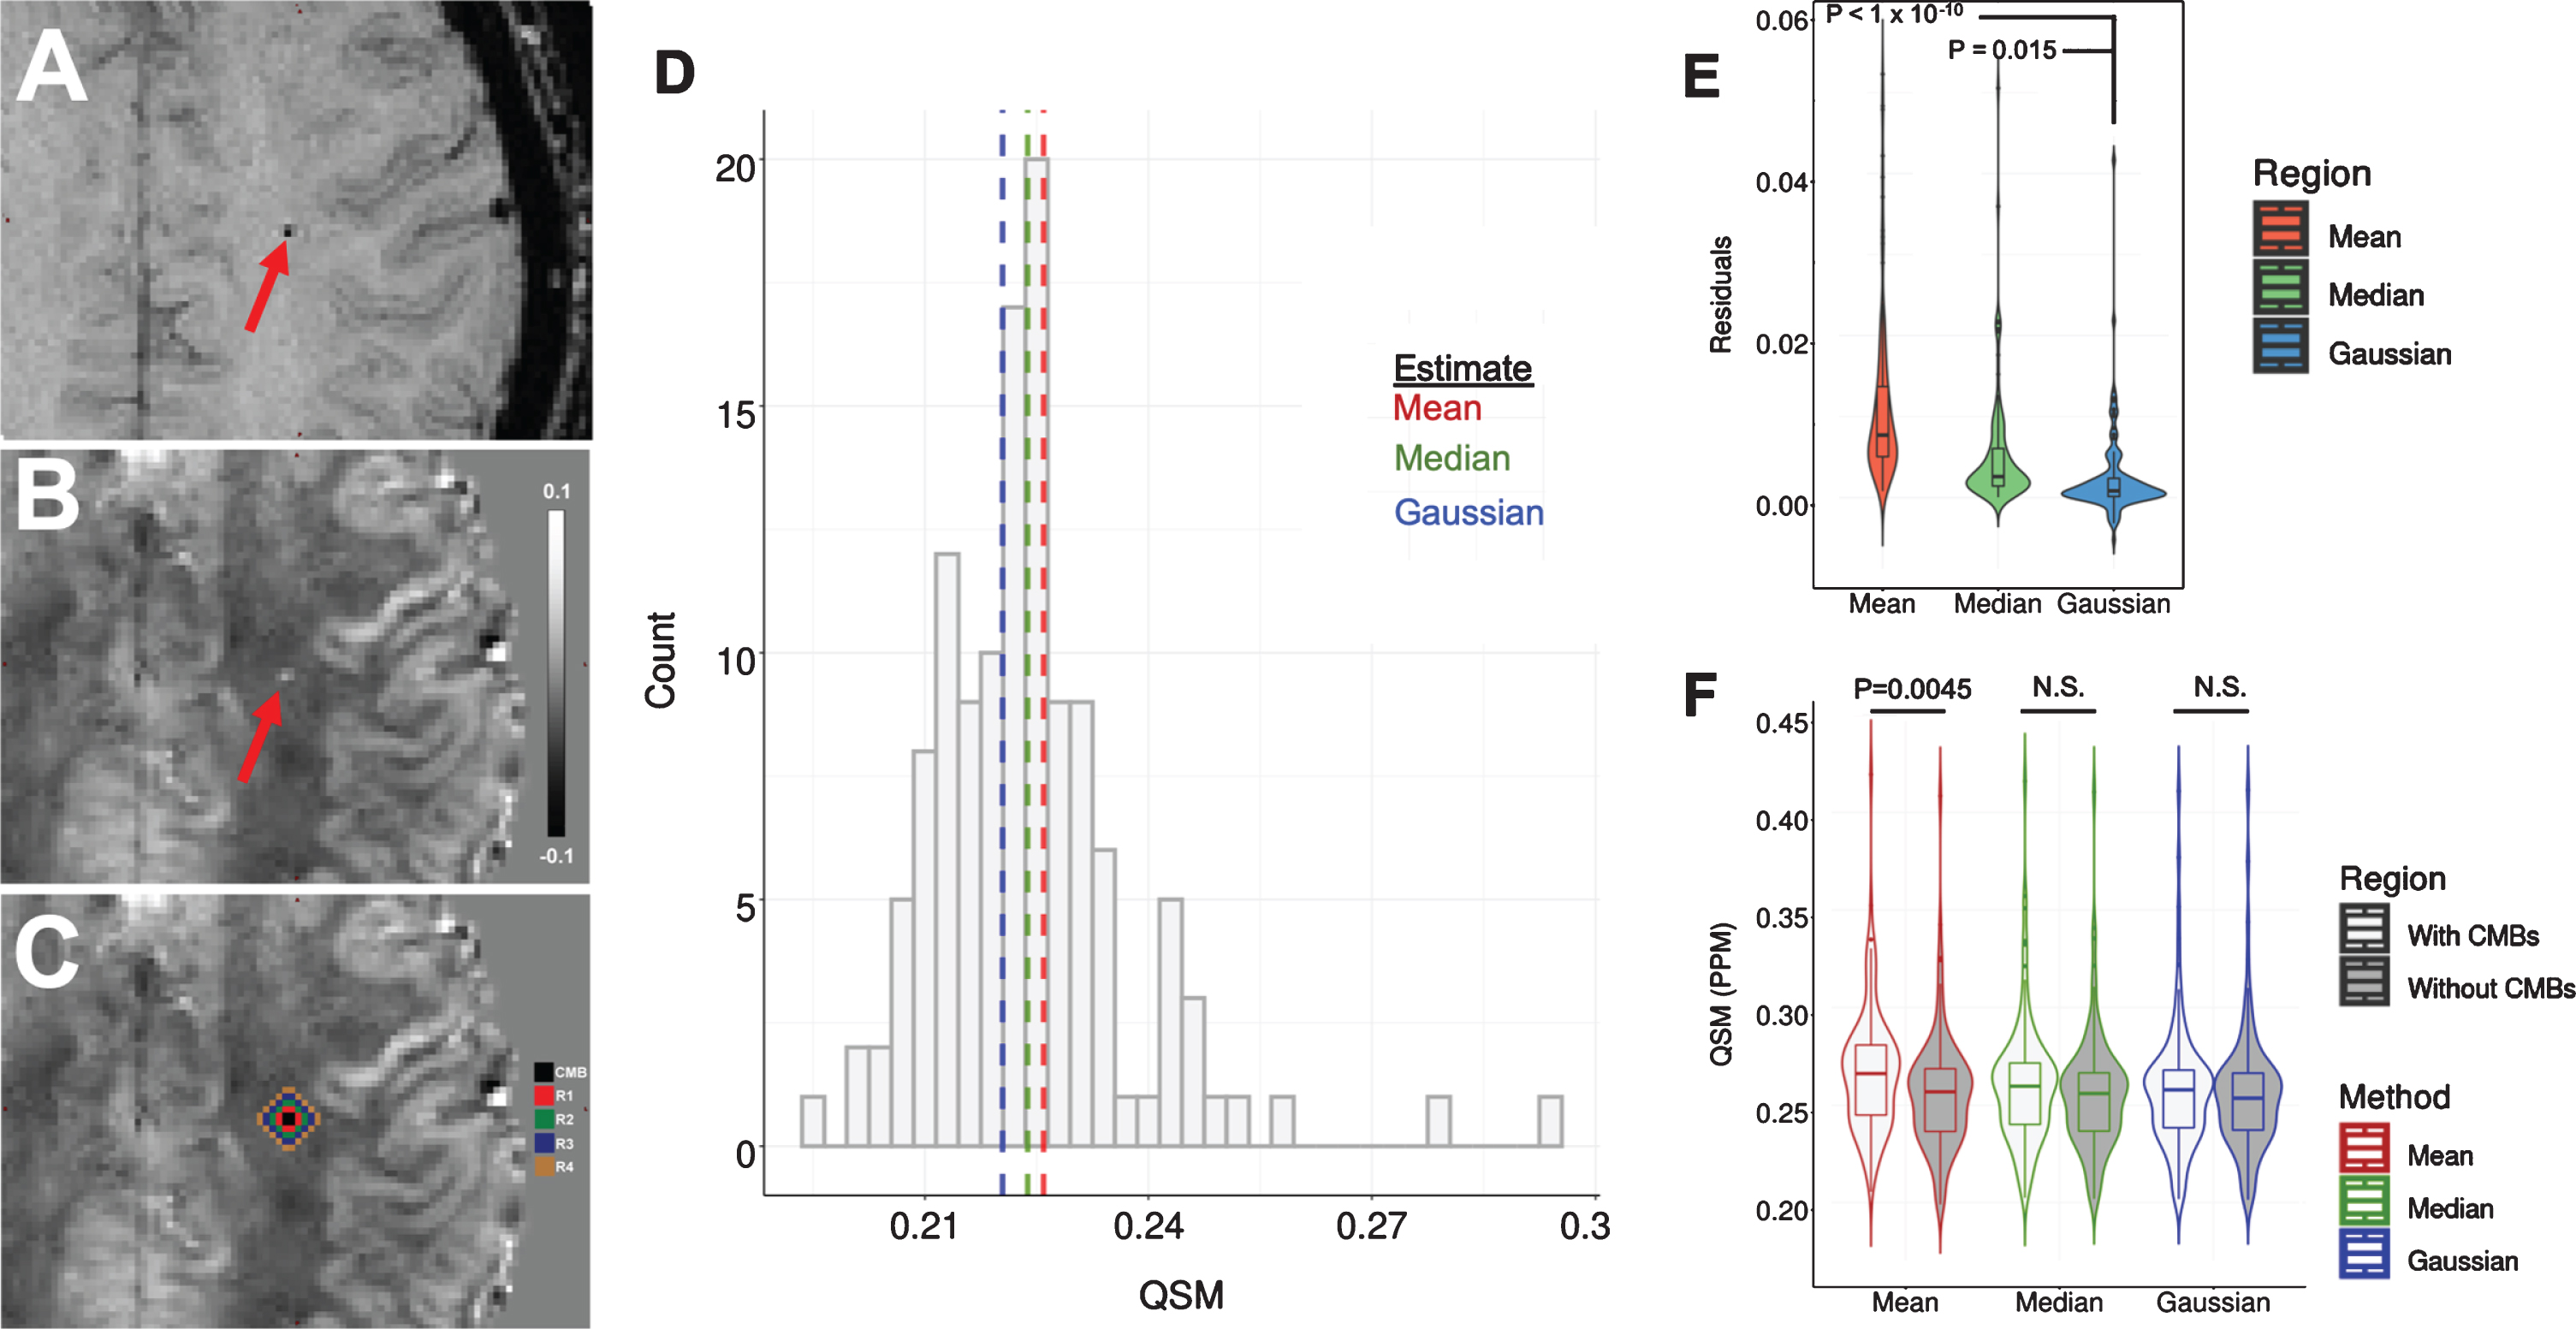
Effect of CMBs on regional QSM using different quantification methods. A–C) Example of CMB (Red arrow) when imaged using (A) SWI and (B) QSM acquisitions, and (C) QSM with emanating radii R1–4. The scale is QSM ppm. D) Example QSM histogram of an area containing CMB, with mean median and Gaussian estimates. E) The residual between the quantification of regional QSM with and without prior removal of CMBs using mean, median, and Gaussian estimates. F) The difference in the quantification of regional QSM with and without CMBs using mean, median, and Gaussian estimates.
RESULTS
Since CMBs (e.g., Fig. 1A–C) are not routinely identified during image processing, their high susceptibility could conceivably impact the average QSM calculation of each anatomical brain region. To investigate this possibility, we selected 5×5×5 ROIs containing CMBs and calculated their QSM values with and without the voxels containing the CMBs. We used three approaches to calculate the regional QSM values within these 3D ROIs: mean, median, and Gaussian distribution fitting (example histogram shown in Fig. 1D). The residual difference between the ROIs with and without microbleeds was greater when mean (p < 1×10⁻¹⁰) or median (p = 0.015) computation was used compared to Gaussian calculation (ANOVA; Fig. 1E). This is likely because the high QSM values in the CMB voxels disproportionately affected the mean (and to a lesser extent, median) QSM of the entire region, and this distortion was minimized when using Gaussian estimates. Since the aim of regional QSM values is to determine the susceptibly of the entire tissue, and not small focal changes due to CMBs, these data support Gaussian estimates as a more representative approach.
While the QSM signals in microbleeds are very high, they are small structures, and the impact of the microbleed on the calculation of QSM in each ROI may be minimal. So, to determine whether the CMBs had any material effect on the calculated regional QSM, we compared calculations (mean, median, Gaussian) of QSM values in regions with and without CMBs. When we removed the voxels containing CMBs, we observed that the mean value of the regional QSM decreased (t-test: p = 0.0045; Fig. 1F), indicating that the CMBs indeed distorted the mean. This was not the case when median (p = 0.194) or Gaussian (p = 0.571) were computed. Therefore, mean value of regional QSM is affected by the presence of microbleeds, while Gaussian and median approaches are not susceptible to distortion by high focal QSM values from CMBs.
It is possible that blood leakage into the local area would cause iron elevation detectable by QSM, so we investigated whether CMBs affect the QSM value of the tissue surrounding the lesion. We measured QSM in 4 concentric spheres of an increasing radius of 1 voxel ([1×1×1 mm3]; designated regions R1–4) emanating from the boundary of each microbleed and compared these values to QSM measured in mirror regions of the opposing hemisphere using mean, median and Gaussian computations (analyzed using separate ANOVAs). As expected, the ipsilateral side had significant elevation of QSM in the microbleed compared to the same region on the contralateral side (mean: p < 1×10⁻¹⁰; median: p < 1×10⁻¹⁰; Gaussian: p < 1×10⁻¹⁰; Fig. 2A–C).
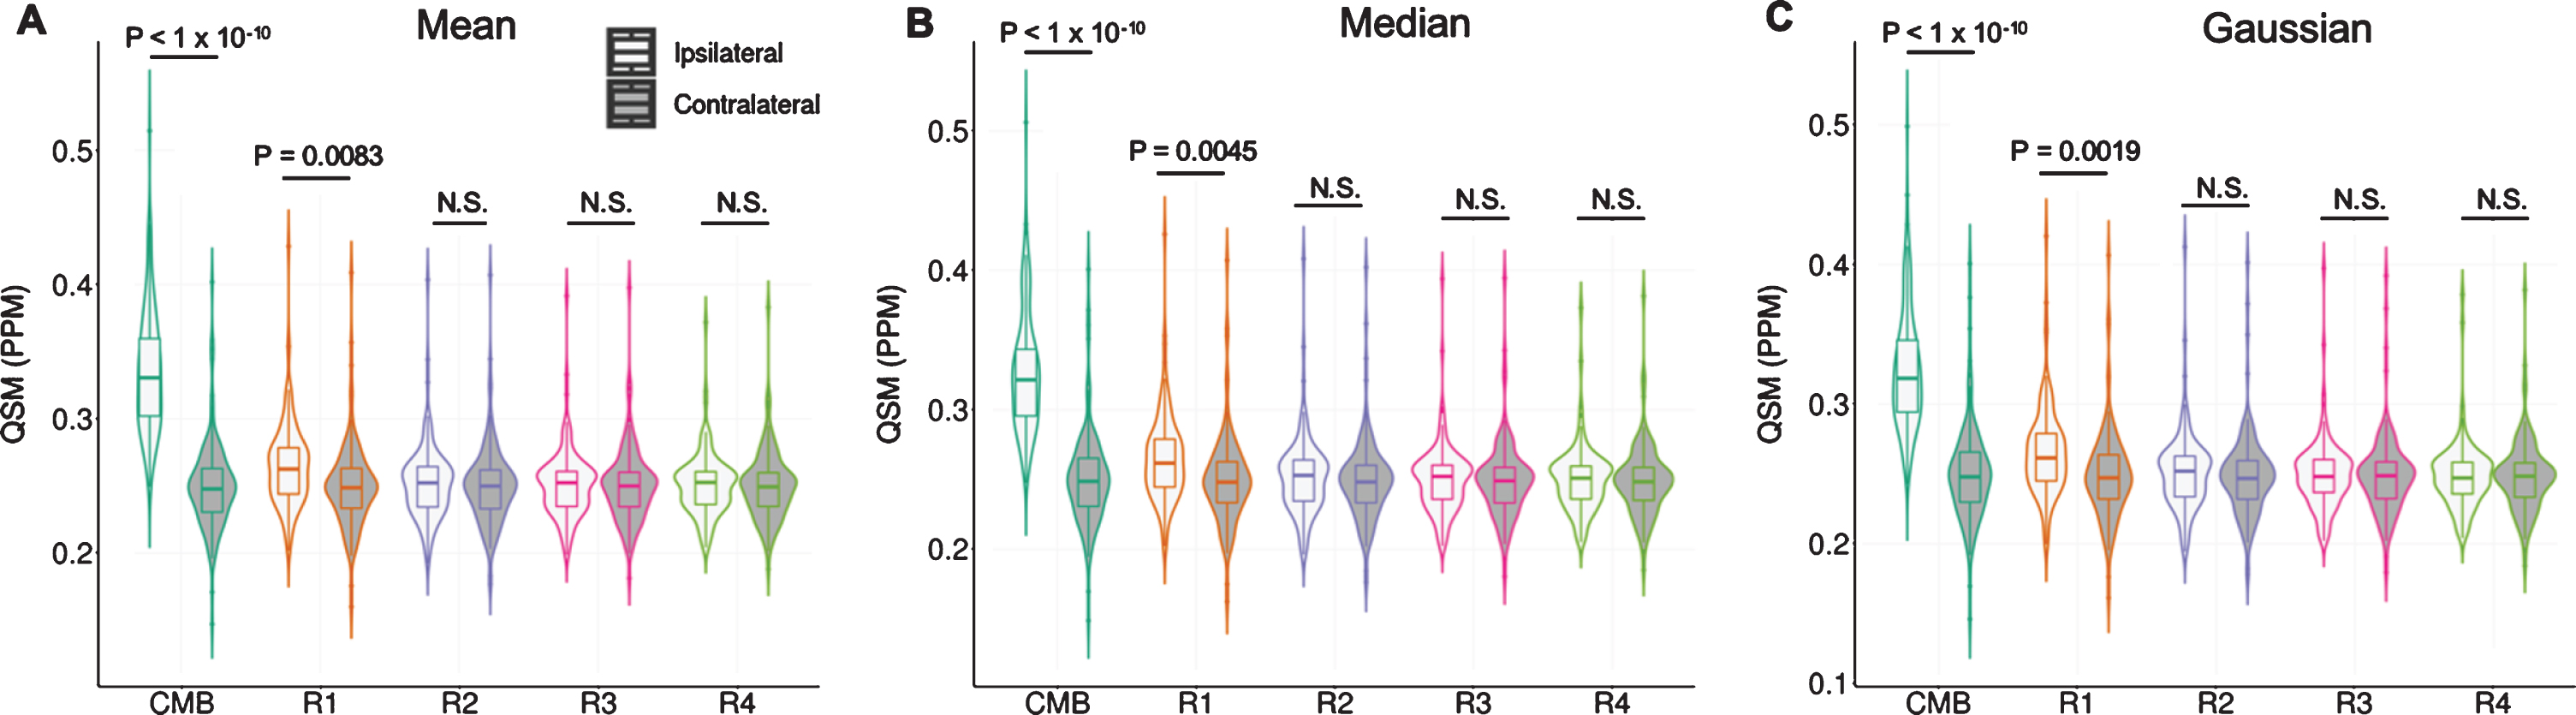
Calculations of QSM in concentric radii emanating from microbleeds. Comparison between QSM in the CMB and concentric radii (R1–4) in the ipsilateral and contralateral brain hemispheres using (A) mean (B) median, and (C) Gaussian calculations.
The immediate region surrounding the microbleed, R1, also had elevated QSM signal in the ipsilateral side compared to the contralateral side (mean: p = 0.0083; median: p = 0.0045; Gaussian: p = 0.0019). However, there was no difference between ipsilateral and contralateral QSM values in regions R2–4 regardless of the calculation method. These data indicate the QSM is elevated in the brain tissue in the immediate vicinity of the microbleed, but this does not extend beyond 1 voxel.
The increase in QSM in R1 may be due to the extrusion of iron from the microbleed, or a partial voluming effect. To explore this potential of a non-local effect due to imaging resolution limitations, we conducted a simulation study where QSM was measured (mean) in the center (χ= 23) and surrounding radii of CMBs with various sizes. The simulation results also showed that the immediate region surrounding the CMBs, R1, had elevated QSM signal (χ= –14) compared to the homogeneous WM background (χ= –23), suggesting a partial voluming effect in R1. In accord with our in vivo findings, regions R2 to R4 had a similar value to the WM background. Furthermore, R2 to R4 regions showed no variability in QSM signal with respect to the size of CMBs (Fig. 3C).
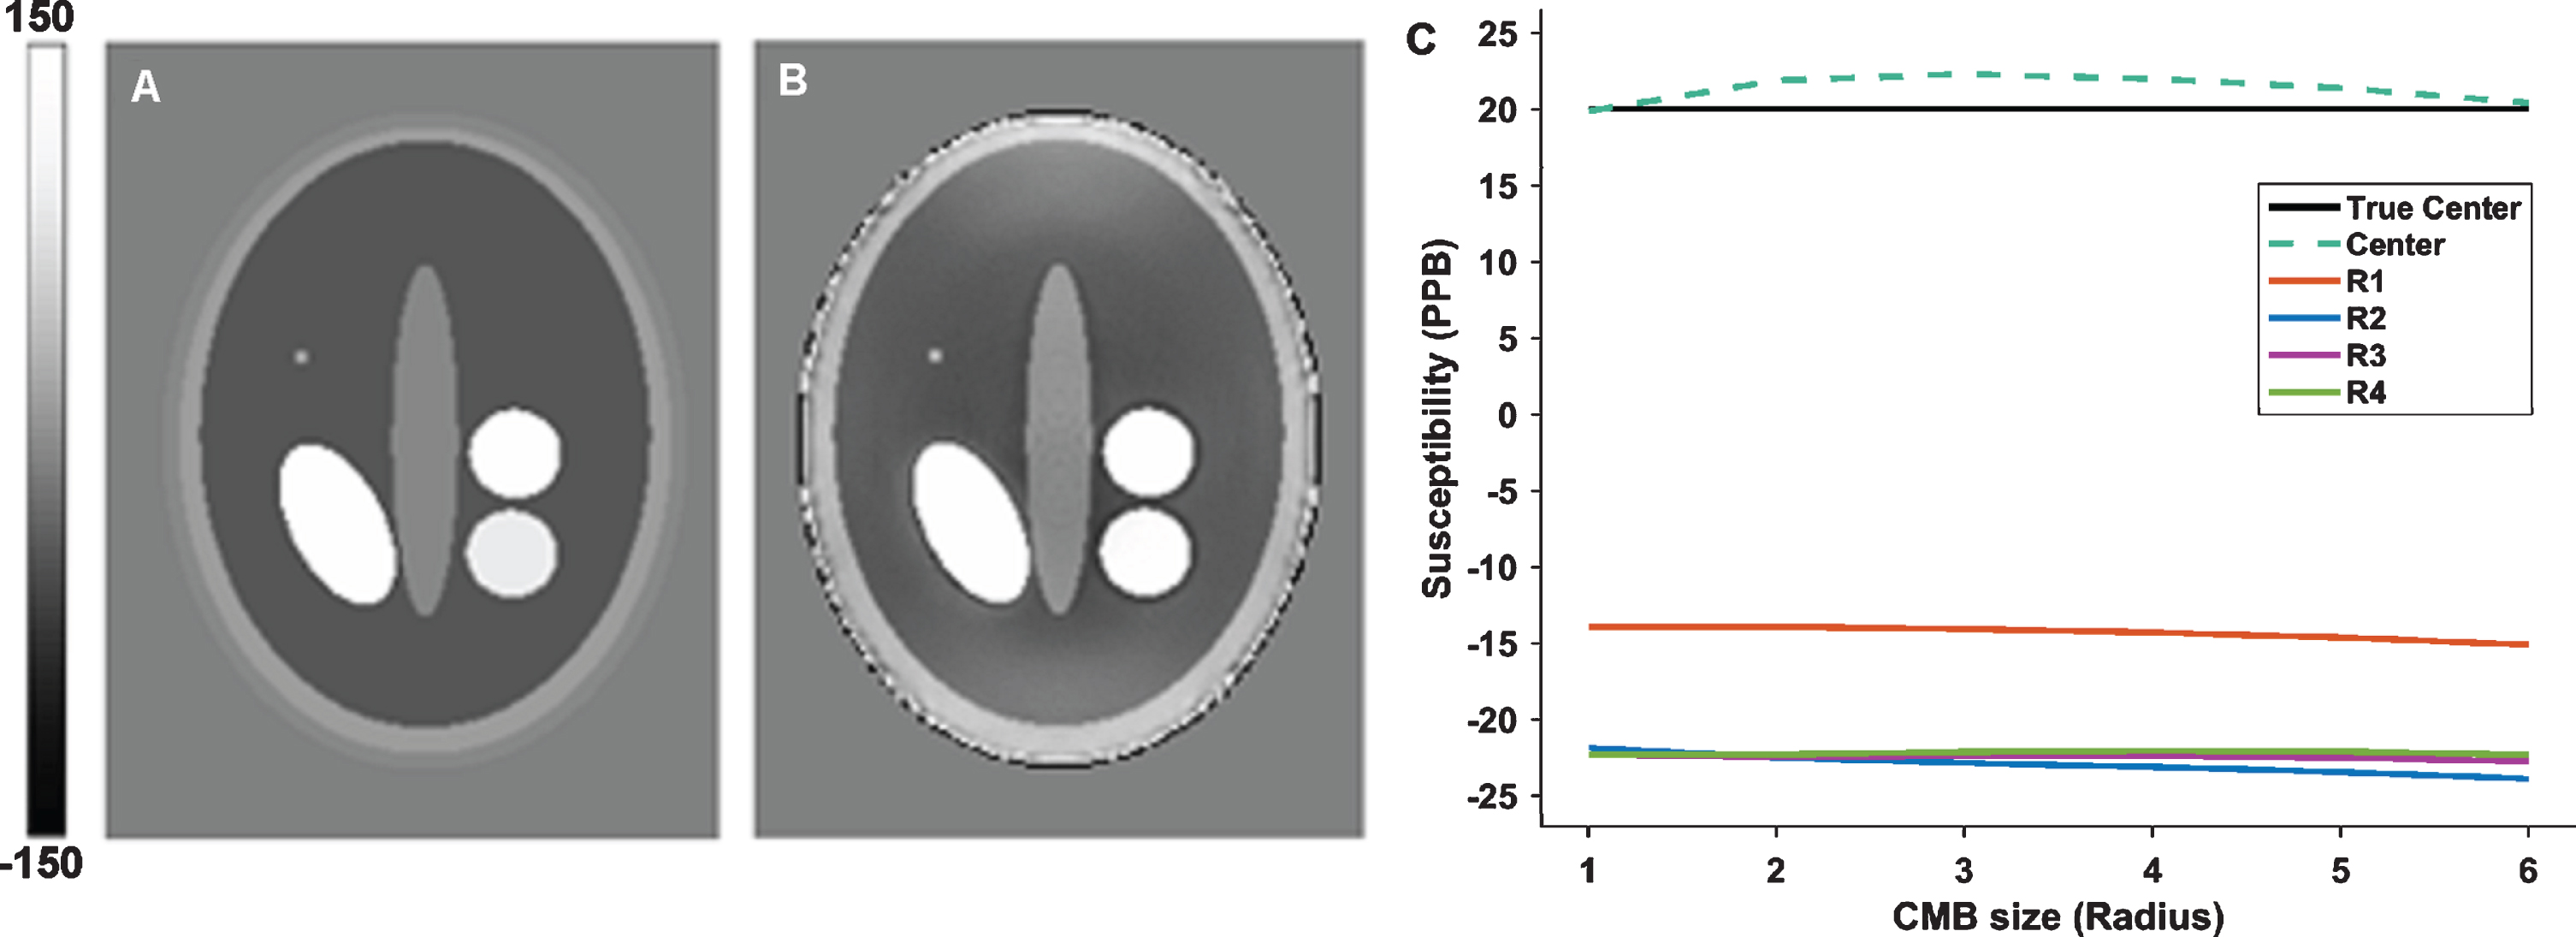
Simulation experiment of CMBs with varying sizes. An example axial slice showing a susceptibility phantom (A) with a CMB (20 ppb) of radius 1 where ellipses and circles in the middle represent the ventricles (5 ppb), Caudate (60 ppb), Putamen (90 ppb), Pallidum (160 ppb) placed on white-matter (–23 ppb) surrounded by gray-matter (20 ppb), CSF (5 ppb) and skull (–2100 ppb). B) The reconstructed QSM map from dipole convolution with the susceptibility phantom. C) The result from concentric radii (R1–4, of an increasing radius of 1 voxel [1×1×1 mm3]) emanating from the outer boundary of the CMBs with radius-sizes from 1 to 6.
DISCUSSION
Cortical iron elevation in AD risks accelerated disease progression [11, 13–17], but the source of this iron remains unknown. Vascular lesions are one potential source of iron since hemosiderin is rich in iron. We found that CMBs do cause a local elevation in regional tissue susceptibility; however, this is restricted to within 1 voxel surrounding the microbleed. This could be explained by iron leaking from the CMB into the immediate region, or it could be due to partial voluming effects resulting from limitations in imaging resolution. Our simulation experiment demonstrated profile on R1–4 (elevated in R1, and not in R2–4) similar to our in vivo result, revealing the partial voluming artefact as a source of QSM changes in R1. Regardless, these small regional changes (in the center and R1 structures) are unlikely to account for iron elevation within larger brain regions since we also found that microbleeds do not impact on median and Gaussian calculations of QSM regional values, and the difference with the mean calculation was modest.
Unlike SWI, CMB size and the associated blooming effect on QSM are not influenced by imaging parameters such as echo time, flip angle, and field strength [24]. Rather, the QSM acquisition voxel size has substantial effects on the amount of signal breach to the neighboring tissue due to higher partial voluming [24], therefore voxel size will affect the degree of CMB influence on regional QSM estimates. Furthermore, the current voxel size limits the ability of the QSM-MRI technique to capture small microbleeds which can be observed histopathologically. Microbleeds the size of 0.3±1.2 mm3 do not give rise to QSM signal [25], and so we have not measured their impact on regional proximal tissues. But given larger CMBs detectable by QSM had only small effects in the immediate vicinity of the lesion, it is unlikely that QSM-undetectable CMBs would materially affect regional QSM estimates. Unlike SWI, which is influenced by the non-local effect of CMBs on phase imaging, we have shown through our simulation modelling, the susceptibility of the surrounding tissue is not impacted by the size of the CMBs in QSM (Fig. 3C).
It is expected that the larger the region of interest, the lesser the impact of CMBs on the regional quantification of QSM. Our findings relate to regional areas the size of 125 voxels (5×5×5), and we found even with this relatively small ROI, the impact of CMBs on regional QSM estimates was immaterial when median and Gaussian estimates were used. It is therefore likely that mean estimates may also not be as confounded when larger ROIs are explored.
Since CMBs are currently identified manually (and preferably by consensus of 2–3 experts), they may not be considered in routine QSM measurements. So, it is important to know whether these hyperintense lesions distort the quantification of regional QSM. While mean calculation is a computationally efficient method, we have shown that this approach to quantify regional QSM is distorted by the presence of microbleeds, while median and Gaussian calculations are not, and should be the preferred quantification modality for regional QSM calculation.
In conclusion, CMBs are a common co-pathology in the aged brain and especially in AD, yet it is unclear whether they are damaging to brain function. The iron deposition is a likely mechanism for CMB-mediated damage, but we found that impact of CMB on local QSM changes to be restricted to mostly just those voxels containing the microlesion. Our results, therefore, do not support a role for CMBs in contributing to regional iron changes and neurodegeneration in AD extending beyond the focal lesion.
Availability of data and materials
The datasets used and/or analyzed during the current study are available from the corresponding author on reasonable request.
Footnotes
ACKNOWLEDGMENTS
This study was funded by the Cooperative Research Centre for Mental Health, Commonwealth Science and Industry Research Organization (CSIRO), National Health and Medical Research Council (NHMRC) Fellowships: GNT1103703 (A.I.B.) and GNT1100458 (S.A.), and NHMRC project grant: GNT1101533. The Florey Institute of Neuroscience and Mental Health acknowledges support from the Victorian Government, in particular, funding from the Operational Infrastructure Support Grant.