
Abstract
Background:
PET imaging is an established technique to detect cerebral amyloid-β (Aβ) plaques in vivo. Some preclinical and postmortem data report an accumulation of redox-active iron near Aβ plaques. Quantitative susceptibility mapping (QSM) at high-field MRI enables iron deposits to be depicted with high spatial resolution.
Objective:
Aim of this study was to examine whether iron and Aβ plaque accumulation is related and thus, whether 7T MRI might be an additive diagnostic tool to Aβ PET imaging.
Methods:
Postmortem human Alzheimer’s disease (AD) and healthy control (HC) frontal gray matter (GM) was imaged with 7T MRI which resulted in T1 maps and QSM. Aβ plaque load was determined by histopathology. In vivo, 10 Aβ PET-positive AD patients (74.1±6.0a) and 10 Aβ PET-negative HCs (67.1±4.4a) underwent 7T MR examination and QSM maps were analyzed. Severity of cognitive deficits was determined by MMSE.
Results:
Postmortem, the susceptibility of Aβ plaque-containing GM were higher than those of Aβ plaque-free GM (0.011±0.002 versus – 0.008±0.003 ppm, p < 0.001). In vivo, only the bilateral globus pallidus showed significantly higher susceptibility in AD patients compared to HCs (right: 0.277±0.018 versus – 0.009±0.009 ppm; left: 0.293±0.014 versus – 0.007±0.012 ppm, p < 0.0001). The pallidal QSM values were negatively correlated with those of the MMSE (r = – 0.69, p = 0.001).
Conclusion:
The postmortem study revealed significant susceptibility differences between the Aβ plaque-containing and Aβ plaque-free GM, whereas in vivo only the QSM values of the globus pallidus differed significantly between AD and HC group. The pallidal QSM values correlated with the severity of cognitive deficits. These findings encourage efforts to optimize the 7T-QSM methodology.
INTRODUCTION
Together with the presence of phosphorylated tau-containing neurofibrillary tangles and neurodegeneration, the accumulation of amyloid-β (Aβ) plaques is a histopathological hallmark of Alzheimer’s disease (AD) [1]. Positron emission tomography (PET), using Aβ plaque-targeting radiotracers, enables in vivo investigation of this early, if not decisive event in AD pathogenesis [2].
Preclinical [3] and postmortem [4, 5] data indicate that excess iron accumulates near Aβ plaques and neurofibrillary tangles, possibly in reaction to free radicals and oxidative stress. De Reuck et al. [6] who investigated postmortem brains of patients with neurodegenerative diseases at a 7T MR scanner demonstrated increased echo-gradient T2* signal in the caudate nucleus in AD but were methodologically not able to study the iron accumulation in the cortical GM. Langkammer et al. [7] postulated that iron-loaded ferritin is a component of neuritic Aβ plaques. Controversially, Exley et al. [8] found no correlation between iron accumulation and Aβ plaques in their postmortem study. A more recently published work suggested that activated microglia as inflammatory component of AD contains iron [9]. Overall, the current literature is divergent regarding this matter. In the chemical state (ferritin) in which iron is usually found in brain tissue, it has a high paramagnetic susceptibility, and consequently can be visualized by a range of magnetic resonance imaging (MRI) methods, e.g., quantitative susceptibility mapping (QSM) derived from susceptibility-weighted imaging (SWI), transverse relaxivity (R2 and R2*) and the R2-enhanced method field-dependent relaxation rate increase (FDRI). Of the more advanced QSM and FDRI methods, the latter is a more specific indicator for iron content, whereas QSM has a better spatial resolution as well as shorter scanning times and is more sensitive in brain stem regions [10]. Regarding magnetic susceptibility measurements in AD, the available literature is heterogeneous in methods and results. Only a few groups have used the advanced MR methods (QSM, FDRI), and one group has yet utilized QSM in vivo at a 7T MR scanner in patients with mild cognitive impairment [11]. The higher field strength of 7T MR provides a higher sensitivity, and thus better signal-to-noise ratio and MR contrast than 3T or 1.5T MR. In our present 7T MR study we hypothesized that magnetic susceptibility, as characterized by QSM, is increased in the Aβ plaque-containing grey matter (GM) of AD tissue, compared with brains of healthy controls (HCs). The hypothesis was investigated both postmortem and in vivo. By that, this project provides information on whether iron accumulation is related to Aβ plaque accumulation and/or cognitive performance and thus whether 7T MRI might be an additive diagnostic tool to Aβ PET imaging.
MATERIAL AND METHODS
The study was conducted in accordance with the Helsinki Declaration, and approval from the local ethics committee was obtained. All patients provided informed consent. The postmortem brain tissues were obtained from the Netherlands Brain Bank (NBB), Netherlands Institute for Neuroscience, Amsterdam. All material was collected from donors for or from whom a written informed consent had been obtained by the NBB, both for brain autopsy and the use of the material and clinical information for research purposes.
Postmortem study part
Tissue of the frontal lobe from an AD patient (2.8×2.2×1.0 cm) and that of a HC subject (3.1×2.9×1.0 cm) were scanned at a 7 T whole body MR scanner (Siemens Magnetom, Erlangen, Germany). The postmortem delay was 6:50 h for the HCs and 8:15 h for the AD patient. At the time of autopsy, the female AD patient was 66 years old and was diagnosed with probable AD 3 years earlier. The female HC was 60 years old and had no history of any neurological/neurodegenerative disease.
For MR imaging, the formalin-fixed tissue samples were washed in a phosphate buffered solution to increase the transverse relaxation times, and then placed in a spherical plastic container (diameter 10 cm) filled with a 0.5% Agar gel to keep the sample in place in the center of the container. The container was placed in the 24 Channel head coil (Nova Medical). The MP2RAGE sequence was used to generate a T1 map. For QSM, a 3D spoiled gradient echo sequence was used. To apply the COSMOS [12] approach, it was necessary to rotate the brain sample by +60 and – 60 degree around the left-right-axis in addition to the 0 degree orientation. To measure the field perturbation due to the magnetic susceptibility distribution a 3D high-resolution spoiled gradient echo sequence was used (170μm isotropic voxels; TR/TE = 500/23 ms, no averaging). The phase data were unwrapped using a Linear Image Registration (FMRIB’s Software Library, Oxford, UK). To remove the unwanted field due to B0 inhomogeneities, the unwrapped phase images of the spherical container were fitted to a third order polynomial. The magnitude data of the – 60 and +60 degree orientation were co-registered to the 0 degree orientation magnitude data. The co-registration matrices were then applied to the high-pass-filtered phase data. QSMs were calculated using the filtered phase images at three different orientations to the main magnetic field (– 60, 0, +60 degree) and applying the COSMOS approach to these data [12]. We used the susceptibility values of the agar gel as reference for the quantitative analysis of QSM values, i.e., the mean magnetic susceptibility value of the agar gel was subtracted from the susceptibility values of the tissue.
When preparing the tissue for iron staining, the tissue was so fragile that the cutting failed. This might be due to the prior performed experiments. Thus, the brain tissues were only histopathologically investigated for the presence of Aβ plaques using Methenamine-silver staining, however not for the presence of iron accumulations. This investigation was performed at the NBB, Netherlands Institute for Neuroscience.
Clinical study part
Participants
We examined 10 patients with AD (male/female: 5/5) and 10 HCs (male/female: 4/6). All HCs and three of the 10 AD patients participated in the multi-center, open-label, non-randomized clinical phase 2 trial of the Aβ radiotracer Florbetaben [13]. The remaining seven patients with AD were recruited from our clinical patient pool. These patients were referred for Aβ PET imaging by a dementia expert. Brain MRI was carried out in all study participants with the same 7T whole body MR scanner as used in the postmortem study.
In all subjects, brief neuropsychological re-testing, including Mini-Mental State Examination (MMSE) and Shulman Clock Drawing Test, was done on the day of the 7T MR scan.
Amyloid PET data acquisition and processing
The amyloid PET scans of the 13 subjects investigated during the multi-center, open-label, non-randomized clinical phase 2 trial of the Aβ radiotracer Florbetaben (FBB) were performed according to the study protocol on an standalone PET scanner (ECAT, Exact HR+, Siemens, Erlangen, Germany) as described in detail elsewhere [13]. The HCs received 321±8 MBq [18F]FBB. Three of the 10 AD patients also participated in the clinical phase II trial of [18F]FBB and were therefore examined at the standalone PET scanner. Of the remaining 7 AD patients, 3 underwent an amyloid PET examination using [18F]FBB and 4 AD patients using [11C]Pittsburgh Compound B (PiB) (382±32 MBq). The six AD patients examined using [18F]Florbetaben received 302±8MBq. Standard amyloid PET images were acquired 40–70 and 90–110 min p.i. for [11C]PiB [14] and [18F]BB [15–17], respectively. All PET data underwent scanner-specific standard corrections and reconstructions. Standardized uptake value ratios (SUVRs) taking the cerebellar cortex as reference region [13] were calculated for each VOI. To achieve comparability with the [18F]FBB data, the [11C]PiB SUVRs were transformed applying the established equation FBB = (PiB+0.32)/1.32 [18].
MR data acquisition and processing
For in vivo measurements, a 24-Channel headcoil was used (Nova Medical). The receiver channels were combined using the vendor-provided adaptive coil combine method. To acquire T1-weighted images as well as to obtain the T1 maps, a MP2RAGE sequence was used (resolution 0.7 mm isotropic, TR = 5 s, TI1/TI2 = 900/2750 ms, alpha1/alpha2 = 5/3 degree, bw = 250 Hz/px, FOV = 224 mm*224 mm) [19]. To measure the field perturbation due to the magnetic susceptibility distribution, a 3D high-resolution spoiled gradient echo (GRE) sequence was used (0.7 mm isotropic voxels; TR/TE = 31/10 ms, alpha = 11° bw = 160 Hz/px, FOV = 224 mm*168 mm, acquisition time 13 min). A brain mask was created by using the BET tool of FMRIB’s Software Library. The phase data of the GRE sequence were used to calculate the QSM via Superfast Dipole Inversion (SDI). SDI includes both high-pass-filtering (convolution kernel radius 2 voxels) as well as inversion performed with a threshold of δ= 2/3 as recommended by Schweser et al. [20]. To co-register the QSM to the T1-weighted anatomy, the magnitude image of the GRE sequence was co-registered to the MP2RAGE image of the second inversion time. The resulting co-registration matrix was applied to the susceptibility maps. As reference the QSM value of the cerebrospinal fluid (CSF) was used by subtracting the QSMCSF value from the QSM value of the brain ROI. The CSF volume of interest (VOI) used as QSM reference was drawn in three adjacent slices in the middle of the lateral ventricle (central part). For quantitative analysis, a VOI approach was employed, using the automated anatomical labeling (AAL) template [21]. The subjects’ T1-weighted images were non-linearly deformed to the MNI152 brain template with SyN [22] and the AAL labels were warped onto each subject’s anatomy. The labeling was further refined by tissue segmentation with Fantasm [23] to take into account only GM regions (Fig. 1). All processing was performed with the CBS Tools software package (Max-Planck-Institute, Leipzig, Germany) [24]. Eighteen AAL VOIs were excluded because they were not covered by the field of view in all subjects. The remaining 98 VOIs were used for the analyses in each subject. The evaluator was blinded to the diagnosis of the subject.

Exemplary 7T MRI images demonstrating the co-registration and masking as preparation for the ROI-based analysis. T1-weighted morphological MRI (left), quantitative susceptibility maps (QSM) (middle), QSM mask overlaying the T1/ QSM fusion (right).
Statistics
Statistical analysis was carried out using SPSS for Windows (version 20.0, IBM, Armonk, NY, USA) and Microsoft Excel 2010 (Redmond, WA, USA). Normal distribution was tested using the Kolmogorov-Smirnoff test. For group comparisons, two-tailed Student’s t-tests (normal distributed data) or Mann-Whitney-U test were used. Univariate ANCOVA was performed to test whether the significant age difference between AD and HC group had any influence on the QSM values. A receiver operated characteristic (ROC) analysis combined with the calculation of Youden’s index was performed to determine QSM cut-off values. Two-tailed Pearson’s correlations and linear regressions were calculated between QSM values of the globus pallidus and MMSE scores as well as pallidal SUVR. Significance levels were set at p < 0.05. We used the Bonferroni approach to correct for multiple comparisons.
RESULTS
Postmortem study
The susceptibility values were higher in the GM of the AD patient as compared to that of the HC (0.011±0.002 versus – 0.008±0.003 ppm, p < 0.001). This was in accordance with the histopathological investigation of the HC tissue, which showed very slight senile involutional cortical changes (Braak stage for tangles = 1, for amyloid = 0), and of the AD tissue, which revealed many senile plaques, including moderate amounts of “classic” types as well as moderate numbers of neurofibrillary tangles (Fig. 2).

T1-weighted morphological MRI (upper row), quantitative susceptibility maps (QSM) MRI (middle row), and Methene-amid silver stained histopathology (lower row, 10× magnification) of frontal cortex postmortem brain tissue of a patient with Alzheimer’s disease (AD) and a healthy control. Higher susceptibility values for the AD tissue (red arrows) are accompanied by higher Aβ plaque burden.
Clinical study
In the PET scan, none of the HCs included showed evidence of cerebral Aβ plaques. In all AD patients, the clinical diagnosis of probable AD, according to the criteria recommended by the National Institute of Neurological and Communicative Disorders and Stroke, and the Alzheimer’s Disease and Related Disorders Association (NINCDS-ADRDA) [1], was supported by a positive Aβ PET scan.
The mean interval between Aβ PET scanning and 7T MR imaging was 38±8 months in the HCs and 14±16 months in the AD patients (p < 0.001). In all HCs, the cognition test results were normal (MMSE: 29.8±0.4), while in all AD patients, cognitive deficits were confirmed (MMSE: 23.6±7.3). The mean age of the AD patients was higher than that of the HCs (74±6 versus 67±4 years, p = 0.008).
Susceptibility values were significantly higher in the AD patients (as compared to the HCs) in bilateral globus pallidus (Fig. 3) and right mesial orbitofrontal cortex (Table 1). They were lower in the left superior orbitofrontal cortex, left insula, left anterior cingulate cortex, left lingual gyrus, and in the left superior temporal cortex (mesial and inferior). The only susceptibility differences that survived correction for multiple comparisons were found in the left globus pallidus (0.293±0.014 versus – 0.007±0.012 ppm, p < 0.0001) and in the right globus pallidus (0.277±0.019 versus – 0.009±0.009 ppm, p < 0.0001) (Supplementary Table 2, Fig. 5).
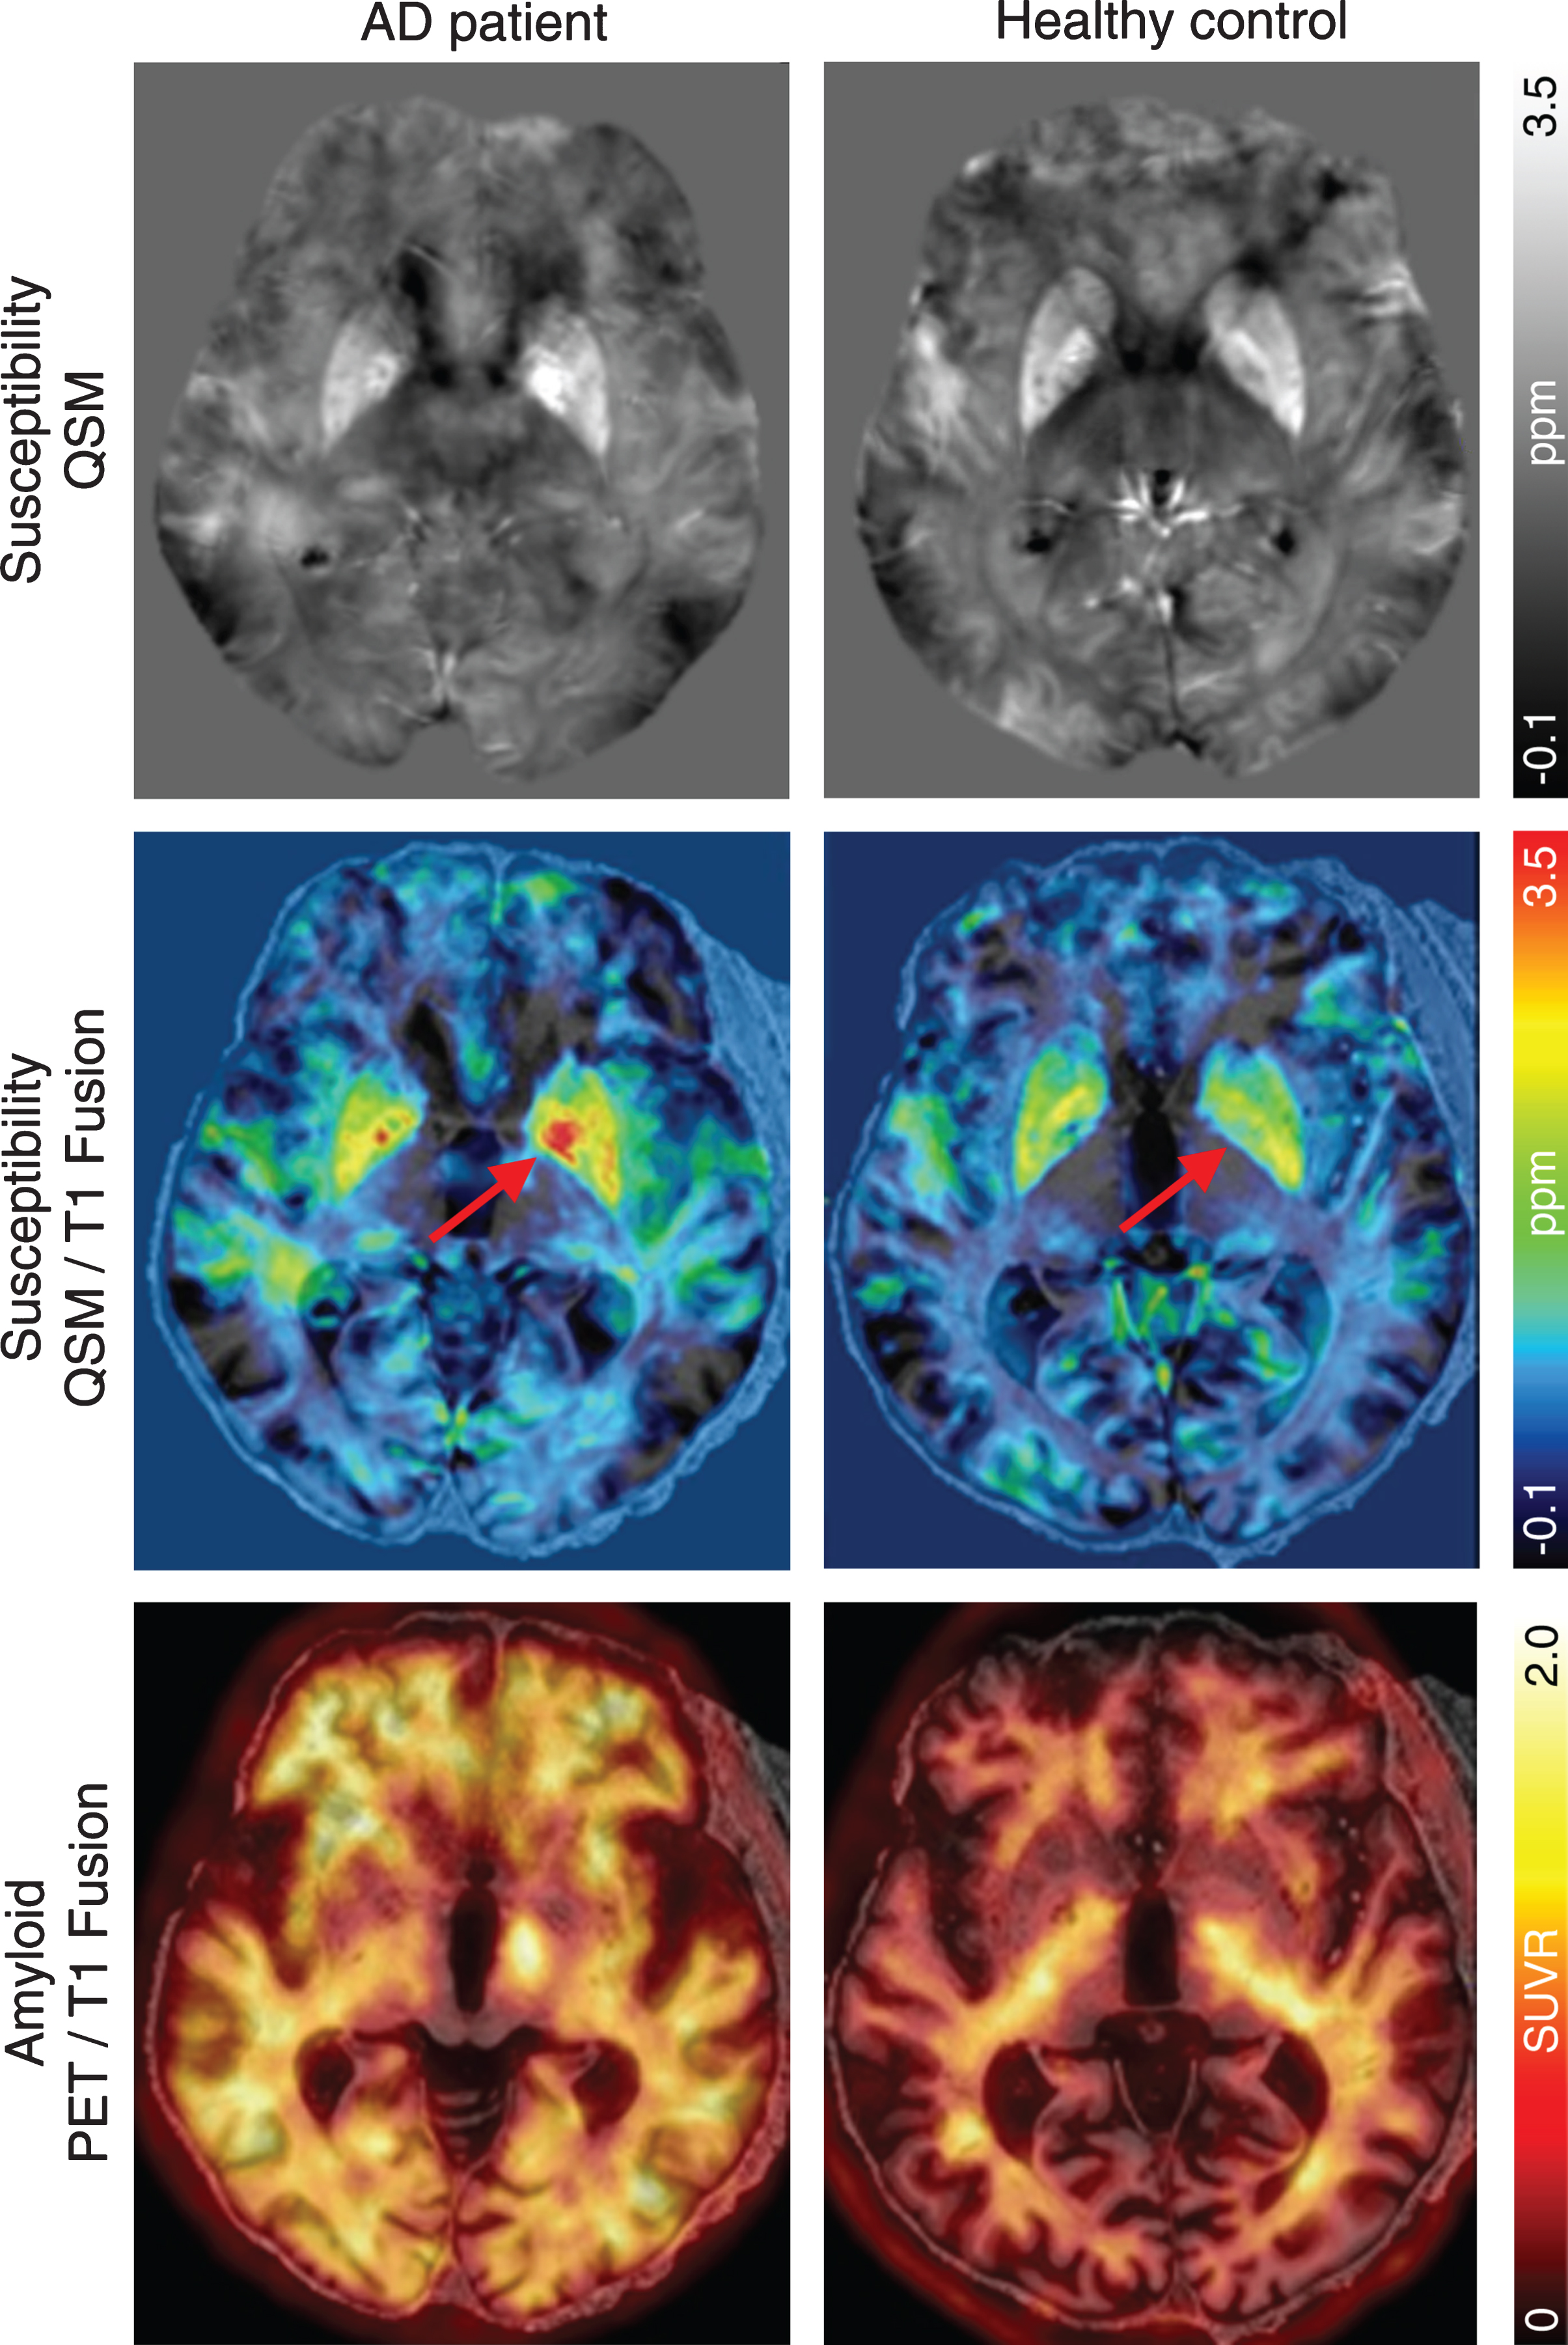
Gray-scaled quantitative susceptibility maps (QSM) and color-coded QSM and Aβ PET images in fusion with the T1-weighted MR images of an Alzheimer’s disease (AD) patient and a healthy control showing higher susceptibility values for the AD patient only in the globus pallidus region (red arrows), but not in the cortical areas despite a higher PET signal in global neocortex depicted using standardized uptake value ratios (SUVR, reference region: cerebellar cortex).
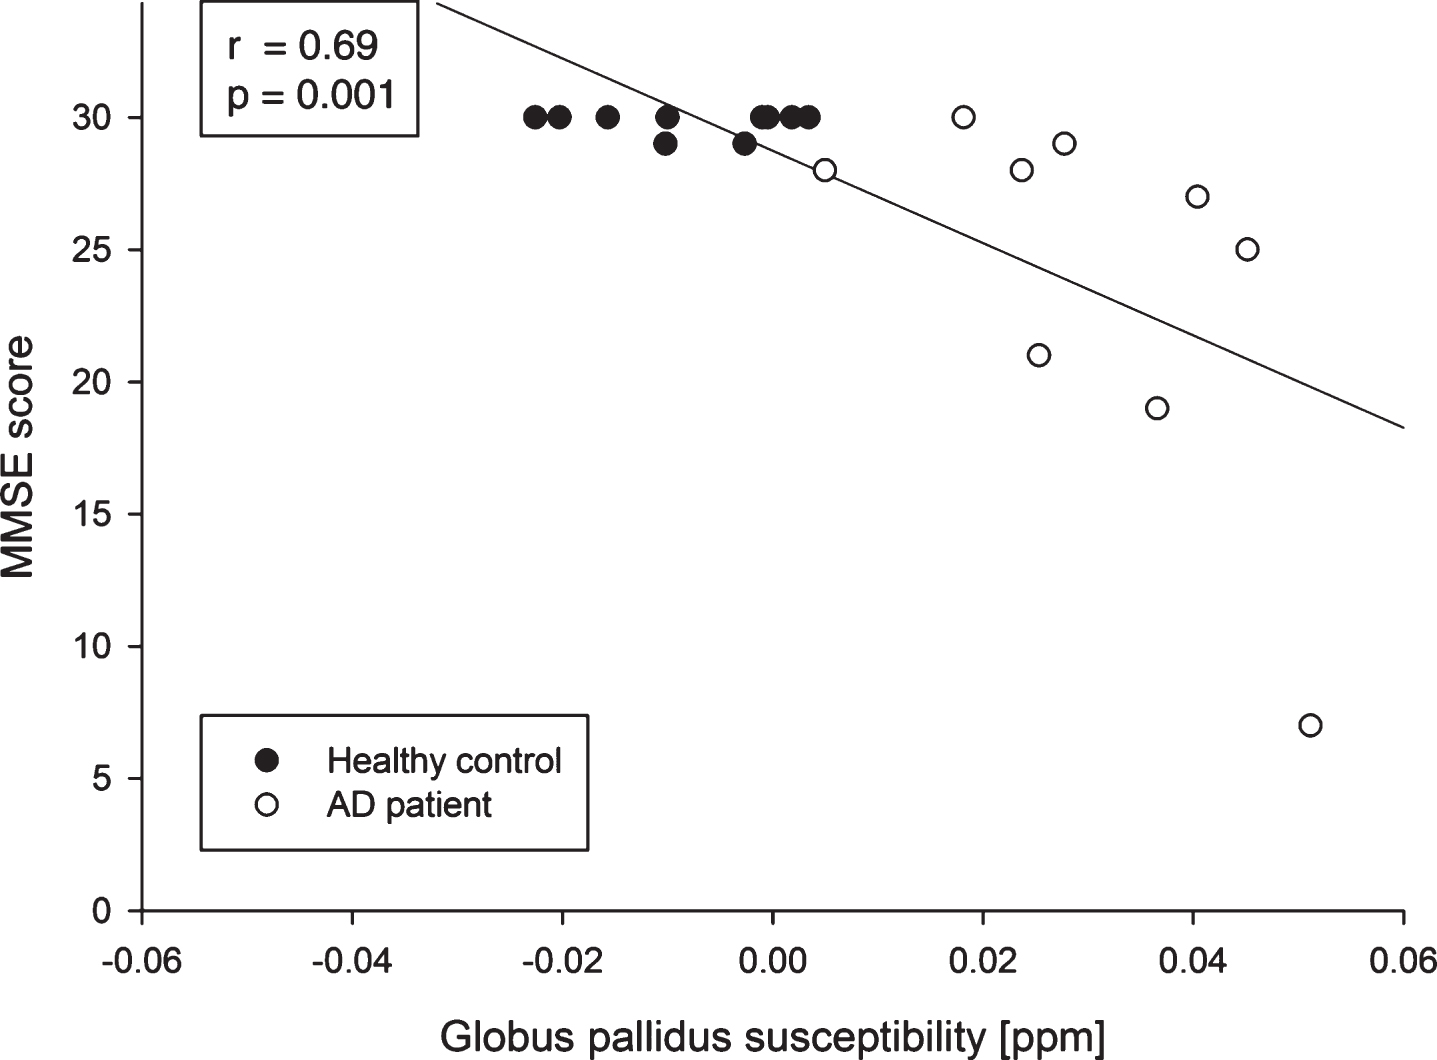
Scatter plots showing the association between the Mini-Mental State Examination (MMSE) scores and the globus pallidus (mean of both hemispheres) susceptibility values for all subjects investigated in this study.
Regional QSM values and [18F]FBB PET SUV ratios of patients with Alzheimer’s disease and healthy controls. The upper row of the AD and HC column lists selected QSM values expressed by ×10–2 ppm and the lower row lists the referring SUV ratios. Selection based on significant differences of QSM values in the group comparison and lists further values of Nucleus caudate and Putamen regions that showed different QSM values in literature [26, 33–37].
AAL, Automated Anatomical Labeling Atlas; AD, Alzheimer’s disease; HC, healthy controls; VOI, volume of interest; FBB, Florbetaben; PET, positron emission tomography; SUV ratios, standardized uptake value ratios; reference region: cerebellar cortex. Values are mean±standard deviation. Brain regions as determined by the automated anatomical labeling atlas that revealed significant group differences as indicated in this table. *Statistically significant after Bonferroni correction for multiple testing.
A univariate ANCOVA using age as covariate was performed to consider the significant age difference between AD patients and HCs. Here, the susceptibility values of the globus pallidus remained significantly different between the study groups (p < 0.001 for each left/right globus pallidus). Figure 5 depicts the bilateral QSM values of the AD patients and HCs. ROC analysis revealed the following threshold susceptibility values, indicating AD: left globus pallidus: 0.0126 ppm (sensitivity: 0.9, specificity: 1.0, Youden’s index: 0.9), right globus pallidus: 0.0063 ppm (sensitivity: 0.9, specificity: 1.0, Youden’s index: 0.9), combined globus pallidus 0.0042 ppm (sensitivity: 0.9, specificity: 1.0, Youden’s index: 0.9).
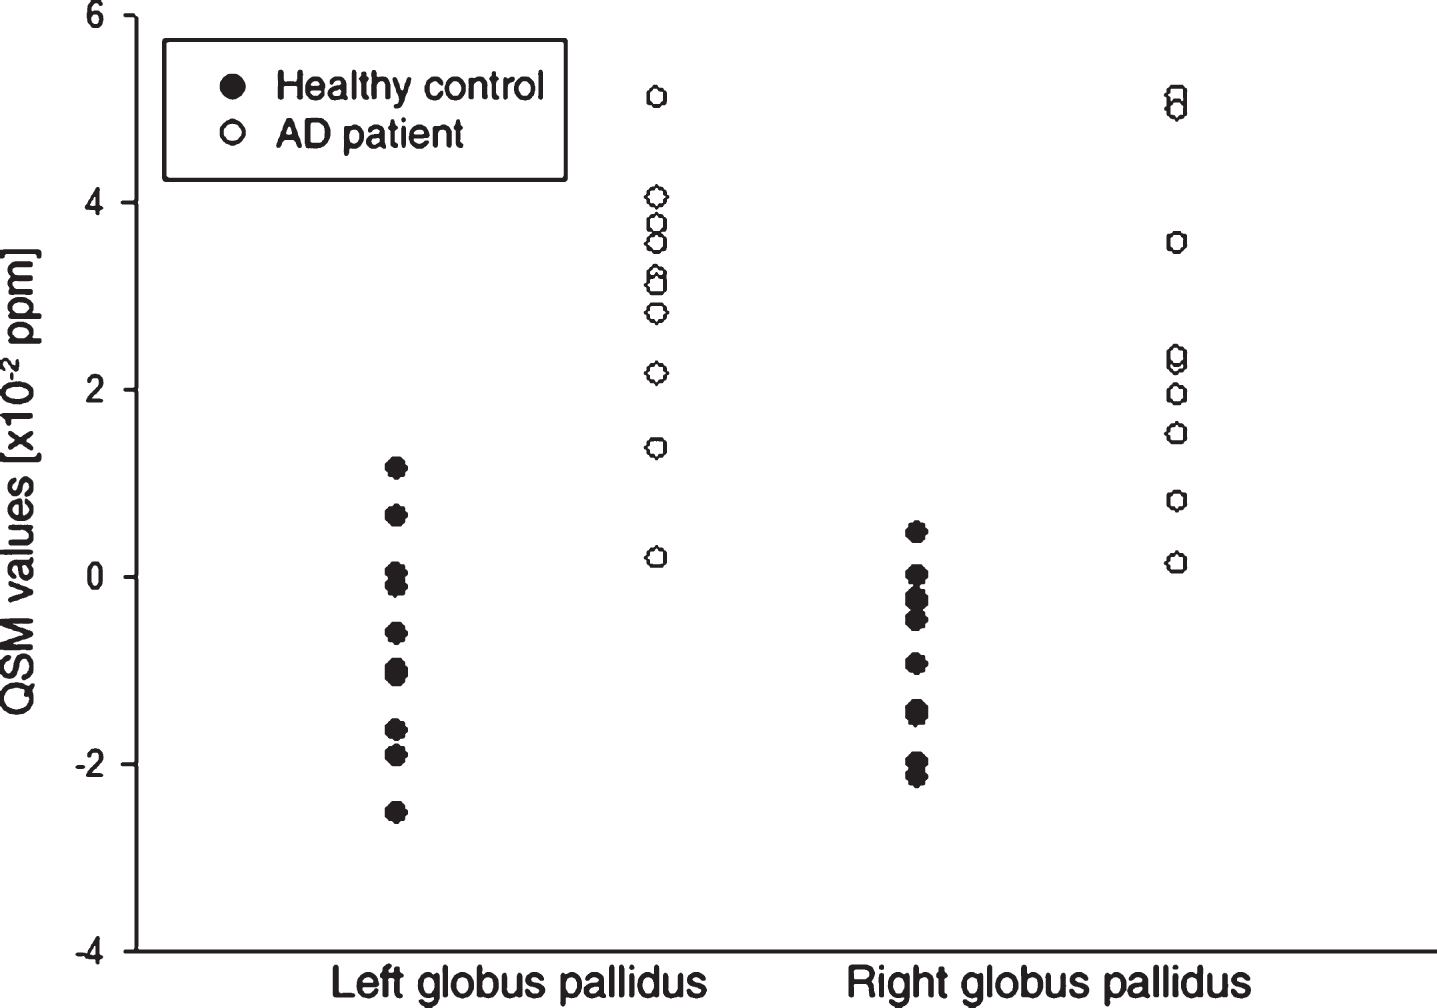
Scatter plot depicting the bilateral pallidal quantitative susceptibility mapping (QSM) values of the healthy controls and the Alzheimer’s disease (AD) patients.
SUVR were higher in the AD patients versus HCs in 60 of the 98 brain regions, with 11 regions surviving correction for multiple comparisons (Supplementary Table 1).
Pallidal QSM values and SUVRs were not significantly correlated (left globus pallidus. r = 0.425, p = 0.062; right globus pallidus: r = 0.380, p = 0.098)
For all subjects, the globus pallidus susceptibility values were strongly negatively correlated with the MMSE scores (left hemisphere: r = – 0.70, p = 0.001, right hemisphere: r = – 0.65, p = 0.003; Fig. 4). Evaluating the AD group alone right-sided pallidal susceptibility values were significantly correlated to MMSE (r = – 0.713, p = 0.031), left-sided pallidal susceptibility values showed only a trend (r = – 0.490, p = 0.181).
DISCUSSION
To our knowledge, this is the first study using 7T quantitative susceptibility mapping to be performed both in postmortem AD human cortical GM and in living AD patients, in a comparison with appropriate HCs. The main aim of the study was to investigate whether susceptibility values measured using QSM differ between Aβ plaque-containing and Aβ plaque-free GM, and thus to assess whether 7T-QSM is an alternative approach to Aβ PET in the diagnosis and understanding of AD dementia. To address this question, we used a two-step scenario, with postmortem brains and in vivo patients and controls. Our main finding are 1) that although the postmortem part showed significantly higher (i.e., more paramagnetic) susceptibility values for frontal GM in the AD than in the HC sample, this frontal difference was not confirmed in vivo; 2) in living subjects, the bilateral globus pallidus specifically showed a magnetic susceptibility that was clearly higher in the AD than in the HC group. It has also be considered, that the AD patient of the postmortem part suffered from an early-onset AD whereas the patients of the in vivo part had late-onset AD. Bulk et al. [25] published different MR contrast changes in early-onset and late-onset AD which were best explained by cortical iron accumulation and changes in myelin organization. Further QSM MRI research in AD should, thus, also focus on potential influences of dementia onset on the imaging results.
The higher susceptibility values in the Aβ plaque-containing postmortem GM sample are probably due to a higher metal (e.g., iron) burden in the frontal lobe of the AD patient than in the HC subject supporting the assumption of iron accumulation near Aβ plaques [4], as a component of neuritic Aβ plaques [7], or in activated microglia [9]. However, other studies failed to prove such a correlation [8] or raised some doubt on the validity of the data [26]. In principle, the higher paramagnetism in the AD tissue could also be due to deoxyhemoglobin, methemoglobin, hemosiderin, free radicals or oxygen [27]. As a limitation of the postmortem part, the small sample size with tissue of only two subjects has to been mentioned. Thus, results of this study part should be seen as initial work.
In vivo, after Bonferroni correction, we found only in the left- and right-sided globus pallidus a significantly higher magnetic susceptibility in the AD than in the HC group. It is important to note that Aβ plaque accumulation is known to be less pronounced for these regions in comparison to cortical GM regions. In keeping with that, the measured Aβ tracer uptake difference observed in this region between the AD patients and HCs did not survive correction for multiple comparisons. Also, pallidal QSM values did not correlate with pallidal amyloid tracer uptake. These data support the assumption that the cause of the observed susceptibility differences is unlikely an Aβ plaque-induced iron accumulation. The real cause for the accumulation of high susceptibility substances (e.g., iron, free radicals, etc.) in the AD patients thus remains unclear.
A number of previous studies reported an age-related accumulation of iron [28] or increased susceptibility phase values [29, 30] in the basal ganglia. In contrast, Exley et al. [8] found no relationship between age and whole-brain burden of iron in a postmortem study cohort aged between 70 and 103 years at death. Using ANCOVA univariate analysis, we found no significant influence of age on the magnetic susceptibility of the globus pallidus, for both AD and HC subjects. Thus age is unlikely to be responsible for the accumulation of iron or any other high susceptibility substance in the globus pallidus of our AD patients. As already mentioned, our study appears to be the first to perform in vivo quantitative susceptibility mapping in AD patients at a 7T MR scanner. Further, and most importantly, the presence or absence of Aβ plaques was confirmed in a head-to-head comparison with separate PET imaging for all study participants. There is one published postmortem study that investigated iron deposits using T2*-weighted gradient echo 7T MRI in the brains of patients with neurodegenerative and cerebrovascular diseases [6]. However, Reuck and colleagues [6] analyzed 12 brain regions solely on a visual basis. Subjectively, they saw no signs of iron accumulation except for a mild signal increase in the caudate nucleus in AD brains.
Published studies at 1.5T and 3T MR systems have mostly used different methods (SWI, T2*, R2*, FDRI) [29, 31–36] other regions sets [29, 31–37] together with unconfirmed clinical diagnoses of AD [29, 33–37]. It is thus difficult to compare these results with ours. While three iron-sensitive MRI studies found no significant difference between AD patients and HCs [33, 37], two studies reported an increased MRI signal in the bilateral globus pallidus in AD patients compared to HCs consistent with our findings [29, 31]. In the majority of the above literature, the putamen was the only brain region consistently revealing susceptibility increases in AD [26, 33–37]. It also needs to be mentioned that increased iron levels are not specific to AD [26].
Interestingly, we observed a strong correlation between the susceptibility of the globus pallidus and the MMSE in our study cohort. Evaluating the AD subgroup alone, a significant correlation between MMSE and right-sided pallidal susceptibility values was still detectable, while the left-sided pallidal susceptibility values showed only a trend. Overall, an inverse relationship between accumulations of magnetic substrates/iron and cognitive impairment could be assumed. This assumption is supported by data of other study groups which also found significant negative correlation between pallidal and putamenal iron-sensitive MRI signals and cognitive function [31, 32]. Thus, this observation clearly deserves further investigations in larger cohorts. This is especially the case as the globus pallidus is not considered a region that produces most of the symptoms associated with AD and furthermore the globus pallidus contains often calcium which might interfere the susceptibility imaging.
Before Bonferroni correction, we found eight cortical regions with QSM values that were significantly different between the AD and HC group. Seven of these regions were in the left hemisphere, and the magnetic susceptibility of six of them was lower (i.e., more diamagnetic) in the AD than in the HC group, ruling out an increased accumulation of iron in these regions in AD patients. Brain atrophy in the AD group could be partly responsible for these differences. The only two cortical regions that revealed higher QSM values in the AD group were the right orbitofrontal cortex and the left lingual gyrus. However, the Aβ PET radiotracer uptake in these regions was not different from the uptake in other cortical regions, in either of the AD and the HC group. Thus, it seems unlikely that this QSM finding can be exclusively related to local Aβ plaque burden. A recently published study examining patients with mild cognitive impairment versus HCs on 7T MRI found no significant differences in average brain susceptibility between the groups [11]. Another limitation of our study is the limited in vivo sample size, which renders our trial underpowered to demonstrate subtle QSM increases in AD. More work in larger cohorts, potentially also in comparison with the ApoE genotype, and CSF amyloid levels, is thus required to draw ultimate conclusions. There are some technical aspects affecting the QSM values. The quality of QSM is based on the quality of the filtered phase data. In a perfect scenario the filtering process removes the long-range bias field, e.g., due to global field-inhomogeneities, while small non-local effects due to differences in magnetic susceptibility remain. Any remaining long-range field-inhomogeneities due to the BIAS field affect the quantification of magnetic susceptibility in QSM. Moreover, our analysis included segmentation and co-registration. Although these intermediate results were visually proofed, small discrepancies might affect ROI analysis especially in smaller brain regions.
Overall, we could not demonstrate a valid susceptibility increase in vivo in the GM of AD patients compared to HCs. This is surprising, considering the preclinical [3] and postmortem [5] data that indicates iron accumulation near Aβ plaques and neurofibrillary tangles and led to our study aim and design. Otherwise, our results are in line with a more recently published review that found only a small and not significant effect of Aβ deposits on iron in neocortical brain regions [26] and another study that found no statistically significant correlation between whole-brain burden of iron and either the brain burden of congophilic amyloid angiopathy or senile (neuritic) Aβ plaques [8].
Conclusion
Although our postmortem study revealed significant higher magnetic susceptibility in frontal cortex containing Aβ plaque from an AD patient than in frontal, Aβ plaque-free cortex from a HC, the clinical in vivo study failed to confirm this result. The magnetic susceptibility of AD patients and HCs differed significantly only in the globus pallidus, which showed a clearly higher susceptibility in the AD patients than in the HCs. Furthermore, the QSM values of the globus pallidus correlated with the severity of the cognitive impairment. These data encourage efforts to optimize the 7T QSM methodology as a potential alternative to Aβ PET imaging, and to further investigate the role of the globus pallidus in AD.
Footnotes
ACKNOWLEDGMENTS
The excellent support of the 7T MRI team of the Max-Planck-Institute for Human Cognitive and Brain Sciences, as well as of the cyclotron, radiochemistry and PET imaging teams of the Leipzig University Hospital Department of Nuclear Medicine is greatly acknowledged. Special thanks to Martin Wehner who cared for the study participants and supported the data analyses.