
Abstract
Background:
Studies on mice models of Alzheimer’s disease (AD) have suggested potential therapeutic benefits of intermittent photic stimulation at 40 Hz.
Objective:
We examined the physiological response of 40 Hz intermittent photic stimulation (IPS) on routine EEG in a large retrospective cohort to investigate the effects of age on induced gamma oscillations by intermittent photic stimulation. Since most AD patients are elderly, it is important for future research to know if age affects photic stimulation.
Methods:
Retrospective data from 1,464 subjects aged 0– 91. We performed frequency analysis and automatic peak detection and used regression analysis to investigate the effects of age and sex on peak frequencies and amplitude changes. To investigate the spread of the induced gamma oscillations, we assessed averaged topographies of 40 Hz band power.
Results:
There was a statistically significant but very minor effect of age on amplitude change (– 0.002 normalized power per year, p < 0.0001) but not for sex (p = 0.728). Detection probability of induced peaks was significantly predicted by both age (OR = 0.988, CI 95 % [0.984, 0.993], p < 0.00001) and sex (OR = 0.625, CI 95 % [0.496, 0.787>], p < 0.0001). The induced 40 Hz gamma entrainment is spatially confined to the occipital area.
Conclusion:
There is a significant effect of age on induced gamma activity, but advanced age does not fundamentally change the behavior of the response in either magnitude or spatial distribution. This fact is important regarding future research into the possible therapeutic effects of photic stimulation in patients with AD.
Keywords
INTRODUCTION
Recent studies in transgenic mice models of Alzheimer’s disease (AD) have proven that induction of 40 Hz neural oscillation by exposure to ambient intermittent photic stimulation (IPS) has the ability to reduce the amount of amyloid-β (Aβ) [3, 4], a protein aggregate strongly related to AD [5]. It is proposed that activation and/or recruitment of microglial cells are responsible for the reduction in Aβ [3 , 7]. These studies have led to experiments using 40 Hz IPS to treat humans with AD [8]. A pilot study in humans testing exposure to IPS at 40 Hz for 1 hour twice a day no reduction in amyloid measured by PiB PET was found [9]. In a small sample, the effect may have been masked by inter-individual differences in responsiveness to IPS [10]. Currently two active studies are aiming to treat patients with AD by inducing 40 Hz oscillation through visual and auditory stimulus [11, 12]. Gamma oscillations have been suggested as an intrinsic pacemaker rhythm in interneurons and associated with activation of microglial clean-up [7]. As AD affects the whole brain [5], it is important to establish whether IPS entrainment is restricted to the visual cortex or if it is more spatially distributed. Entrainment of 40 Hz oscillations extends topographically to the parietal and to a lesser extent the frontal lobe [10].
It has been shown that exposure to IPS at all frequencies from 1 Hz to 100 Hz can induce steady-state visual evoked potential (SSVEP) oscillations at the same frequency in the brain [13].
IPS is routinely administered during diagnostic EEG recordings to provoke and characterize potential photosensitive seizures [14]. Routine IPS testing has undergone standardization with respect to stimulation frequencies and timing and the upper range of commonly tested frequencies in most laboratories today is typically 60 Hz [15]. Consequently, it is now possible to investigate the effects of IPS in the gamma-band range including 40 Hz in historical EEG data. Research into the potential therapeutic effects of 40 Hz IPS on AD sometimes have to rely on assumptions about the stability of entrainment with advancing age [10]. We will test the hypotheses that there are age- and sex-related effects on IPS in a large sample of retrospective EEG exams. Previous studies on slower frequencies did not find sex differences in amplitude [16].
METHODS
Data
We used EEG data from region Zealand in Denmark between 2008 to 2019. The archive contained all EEG recordings (n = 17.275) for the region (population of approximately 820,000). We could obtain information about age and sex but not specific diagnoses of the subjects. Data was imported into MatLab 2018b (MathWorks, Inc., Natick, MA, USA). We only included EEGs with a duration between 15– 60 min to keep routine EEGs and excluded exams pre-maturely aborted for technical reasons and long duration continuous EEGs or polysomnography studies. EEGs had between 15– 25 scalp electrodes positioned according to the international 10– 20 system with a sampling rate between 256– 1000 Hz. IPS is administered as part of the standard EEG exam. IPS is performed with curtains closed and lights off. The exposure time of each IPS block is 10 s and the patient is instructed to look in the direction of the lamp with open eyes. The neurophysiology assistant gives instructions to close the eyes approximately midways through each stimulation interval. There is a 10 s pause with closed eyes between IPS intervals. In 2016, the IPS protocol was changed to comply with the International League Against Epilepsy’s recommendation for photic stimulation to include higher stimulation frequencies [14] and since we intended to examine 40 Hz IPS, most of the usable EEGs were from recent years.
The EEG files contained a labelled photic channel. The information in the photic channel is binary; except during photic pulses all values are zero. All files that did not fulfill this requirement were discarded because in that case IPS had not been administered. Stimulation frequencies were calculated as the number of stimulation pulses in the photic channel divided by time. Pauses longer than 2 s between photic pulses were used to delineate IPS blocks.
EEG files with no 40 Hz stimulation were excluded leaving 1,474 with 40 Hz IPS. For these 1,474 EEG files, we kept stimulation intervals with IPS between 22– 60 Hz. Non-40 Hz intervals were used to test for differences within-patients. For 10 patients, we saw an excessive amount of noise in the 40 Hz spectra through manual evaluation and these were excluded. Figure 1 summarizes the EEG selection process.
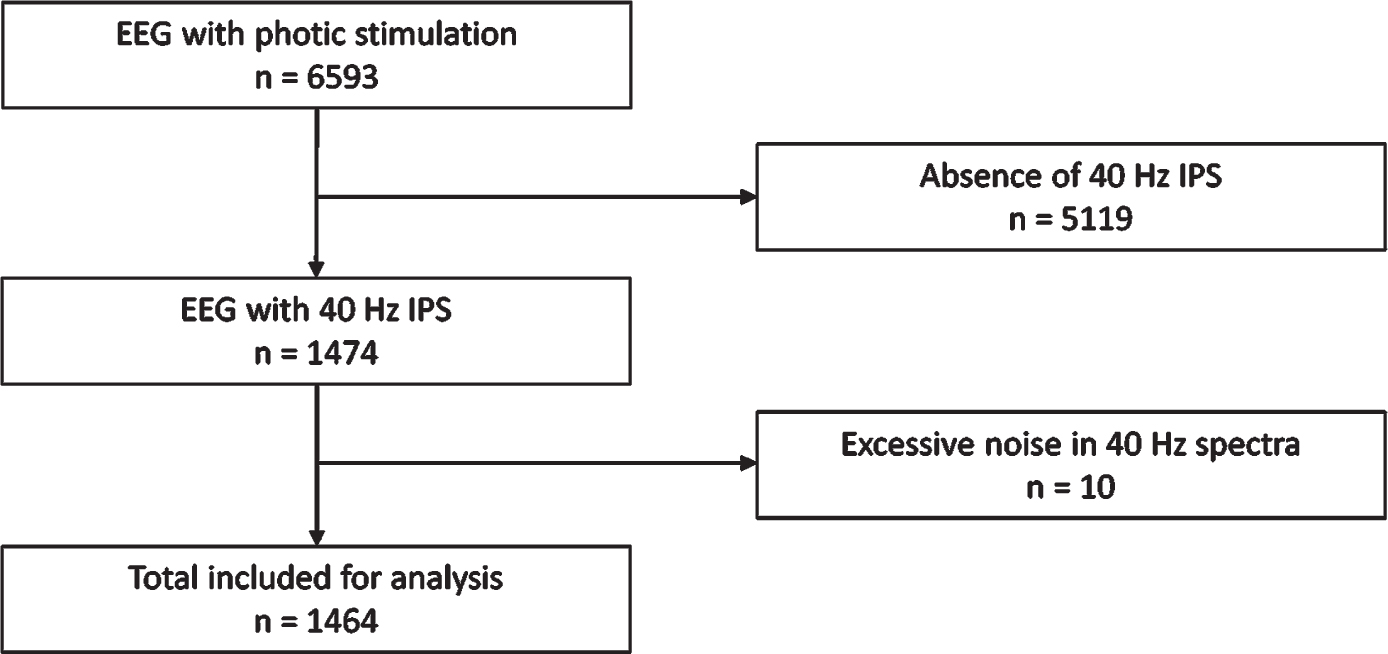
Flow chart of inclusion process.
EEG analysis
A 4th order high pass filter at 1 Hz with a passband ripple of 0.1 Hz was applied and a 2nd order Butterworth stop-band 49– 51 Hz filter was used to remove line noise artifacts. Data was re-referenced to common average montage.
A complex Morlet wavelet transform was used to extract power from the IPS intervals from O1 and O2. Wavelets were linearly spaced between 20 and 70 Hz in 0.25 Hz increments with varying wavelet cycles between 3 and 12. The mean power spectral density was used to represent each IPS interval and the function findpeaks was used to detect peak frequencies within each IPS interval. Random fluctuation in power spectra might take on a peak-like appearance, so decision criteria to separate random noise from very small physiological increases is needed. From visual inspection of a few power spectra, we decided that only peaks within 38– 42 Hz with power above 0.05μV2 during 40 Hz IPS should count as induced 40 Hz responses. Patients with a detected peak at either O1 or O2 in this range were classified as responders. Patients are their own controls using the average amplitude of all non-IPS intervals as a comparison with the amplitude in the 40 Hz interval. If no peak was detected, there is no possible comparison of amplitude change. The direction and magnitude of amplitude change will sometimes be spurious because of random spectral fluctuations. To avoid this contamination, some analyses were therefore only performed on the responder group. All spectra were visually inspected and excluded if they contained excessive noise. If the 40 Hz spectrum was excluded then the EEG was excluded. If one of the non-40 Hz intervals was excluded, then the EEG was only dropped from the within-patient comparison of amplitude change analysis.
If more than three peaks were detected within a spectrum, a detection within 38– 42 Hz interval was only kept if the peak within this range had the highest prominence relative to the rest to the detected peaks in the same spectrum.
The spectra varied significantly from each other and were normalized by division by the standard deviation of the power spectrum. The effect of age and sex on change in normalized power from non-40 Hz IPS to 40 Hz was tested using multiple linear regression. A logistic regression was used on the responder outcome with age and sex as predictors. Only peak amplitudes were used to define the responder and non-responder group, and under the null hypothesis, there is no effect of age or sex. Statistics were computed in R v.3.6.0 using the ggplot2 package for visualization. When comparing groups, we used parametric tests regardless of the distribution of the data because of the large sample size.
Topographical representations of power ratios between the AUC in the 38– 42 Hz band above the AUC in the 33– 47 Hz band of the power spectra for all channels during 40 Hz IPS were made using EEGLAB [17]. For this part of the analysis, power spectra was calculated using the pwelch function with a 1 s Hamming window. AUC was calculated using the trapz function. Only EEGs with 25 channels were used in the topographical analysis. Topographies were average by responder status and age groups separately.
Illumination measurements
We measured the luminosity of the IPS light sources that had been used in three different EEG exam rooms. We tested with a handheld lux-meter (MK350 LED Meter, URPtek, Taiwan) during 40 Hz IPS. The ambient illumination was consistently below 3 Lux, and the illuminations during 40 Hz IPS was measured at distanced from 10 cm to 100 cm. Our clinical IPS protocol specifies the distance between the patient and the light source must be between 20 cm and 30 cm; the intensities in this range were 190– 449 lux. In one of our examination rooms, we found a much higher light intensity compared to the two other tested rooms (Supplementary Figure 1); however, even the low intensity have been described to be sufficient to induce response [10, 18].
Ethics
According to Danish law, this registry study did not mandate approval from the regional ethics committee since it did not involve research on human biological tissue (19-000067).
RESULTS
Patient demographics
Table 1 summarizes the demographic information. There were 1,464 patients. Mean EEG recording was 31.1 min (±3.4). Mean age was 33.0 years, lower for females, 31.8 (n = 733) than males, 34.2 (n = 731). Figure 2 shows the age distribution. There is a slight preponderance of females at ages 12– 25 and slightly more males than females above age 50, explaining the difference in mean age. This reflects differences underlying etiologies prompting EEG referral.

Kernel density plots of age distribution grouped by sex.
Spectral analysis
Responder spectra differ from non-responders by having a distinct peak at 40 Hz (Fig. 3). The peak frequency matches the stimulation frequency for the respective interval, but subharmonics is seen, such as the 44 Hz peak for the 22 Hz stimulation interval. For the non-responder, there are peak-like random spectral fluctuations. Without an amplitude threshold, some of these fluctuations would have been counted as spurious peak detections. For the 22 Hz interval, there is a low amplitude peak and a 44 Hz subharmonic, but since it falls below the amplitude threshold, it is ignored by the algorithm. A total of 848 peaks were detected within the 40 Hz IPS interval at O1 (57.9%) and 832 at O2 (56.8 %) for 1,464 patients. In total, there were 672 (45.9%) patients with bilateral peaks. There were 1,008 (69%) with a detectable peak at either O1 or O2.

Example of power spectra form different stimulus frequencies each color represents a different stimulus frequency in Hz. Automatically detected peaks are indicated by a colored point at the local maximum with grey dashed lines that indicates the amplitude differences from the average of the other stimulation intervals. a) O1-avg and b) O2-avg with distinct peaks at the corresponding stimulus frequencies. c) O1-avg and d) O2-avg both from the same patient with no distinct peak corresponding to the 40 Hz stimulus. Note a subharmonic is seen at 44 Hz during the 22 Hz stimulation; however, it is below the amplitude threshold for peak detection. Note also the difference in y-axis scaling between a and b compared to c and d. 50 Hz stop-band filter applied.
All normalized 40 Hz spectra are shown superimposed in Fig. 4. Averaging within the responder- and non-responder group removes the effects of random spectral fluctuation on the group level and we can clearly observe a distinct peak in the responder group. However, there is also a smaller peak in the non-responder group indicating that the peak-amplitude detection criterion ignores some proportion of induced 40 Hz activity. The mean age in the responder group is 30.5 and 38.4 in the non-responder group. The difference is – 7.9 (CI 95% [– 10.7, – 5.1], t = – 5.55, p < 0.00001). Amplitudes are continuously distributed with no clear boundary between undetectably small peaks compared to well-defined peaks.

Responders (red) and non-responders (blue) for all 40 Hz stimulation intervals. Responder status based on peak detection within 38– 42 Hz band. Note that there is no difference in average power in the surroundings, but a significant normalized power difference is seen in the 38– 42 Hz interval. 50 Hz stop-band filter applied.
Power and amplitude changes
For the responders, we compared amplitude for the detected 38– 42 Hz peak with the average amplitude of the non-40 Hz intervals at the same frequency within-subjects. A paired t-test showed a significant increase in normalized power D = 0.25 (CI 95% [0.22, 0.28], p < 0.00001) (Fig. 5).
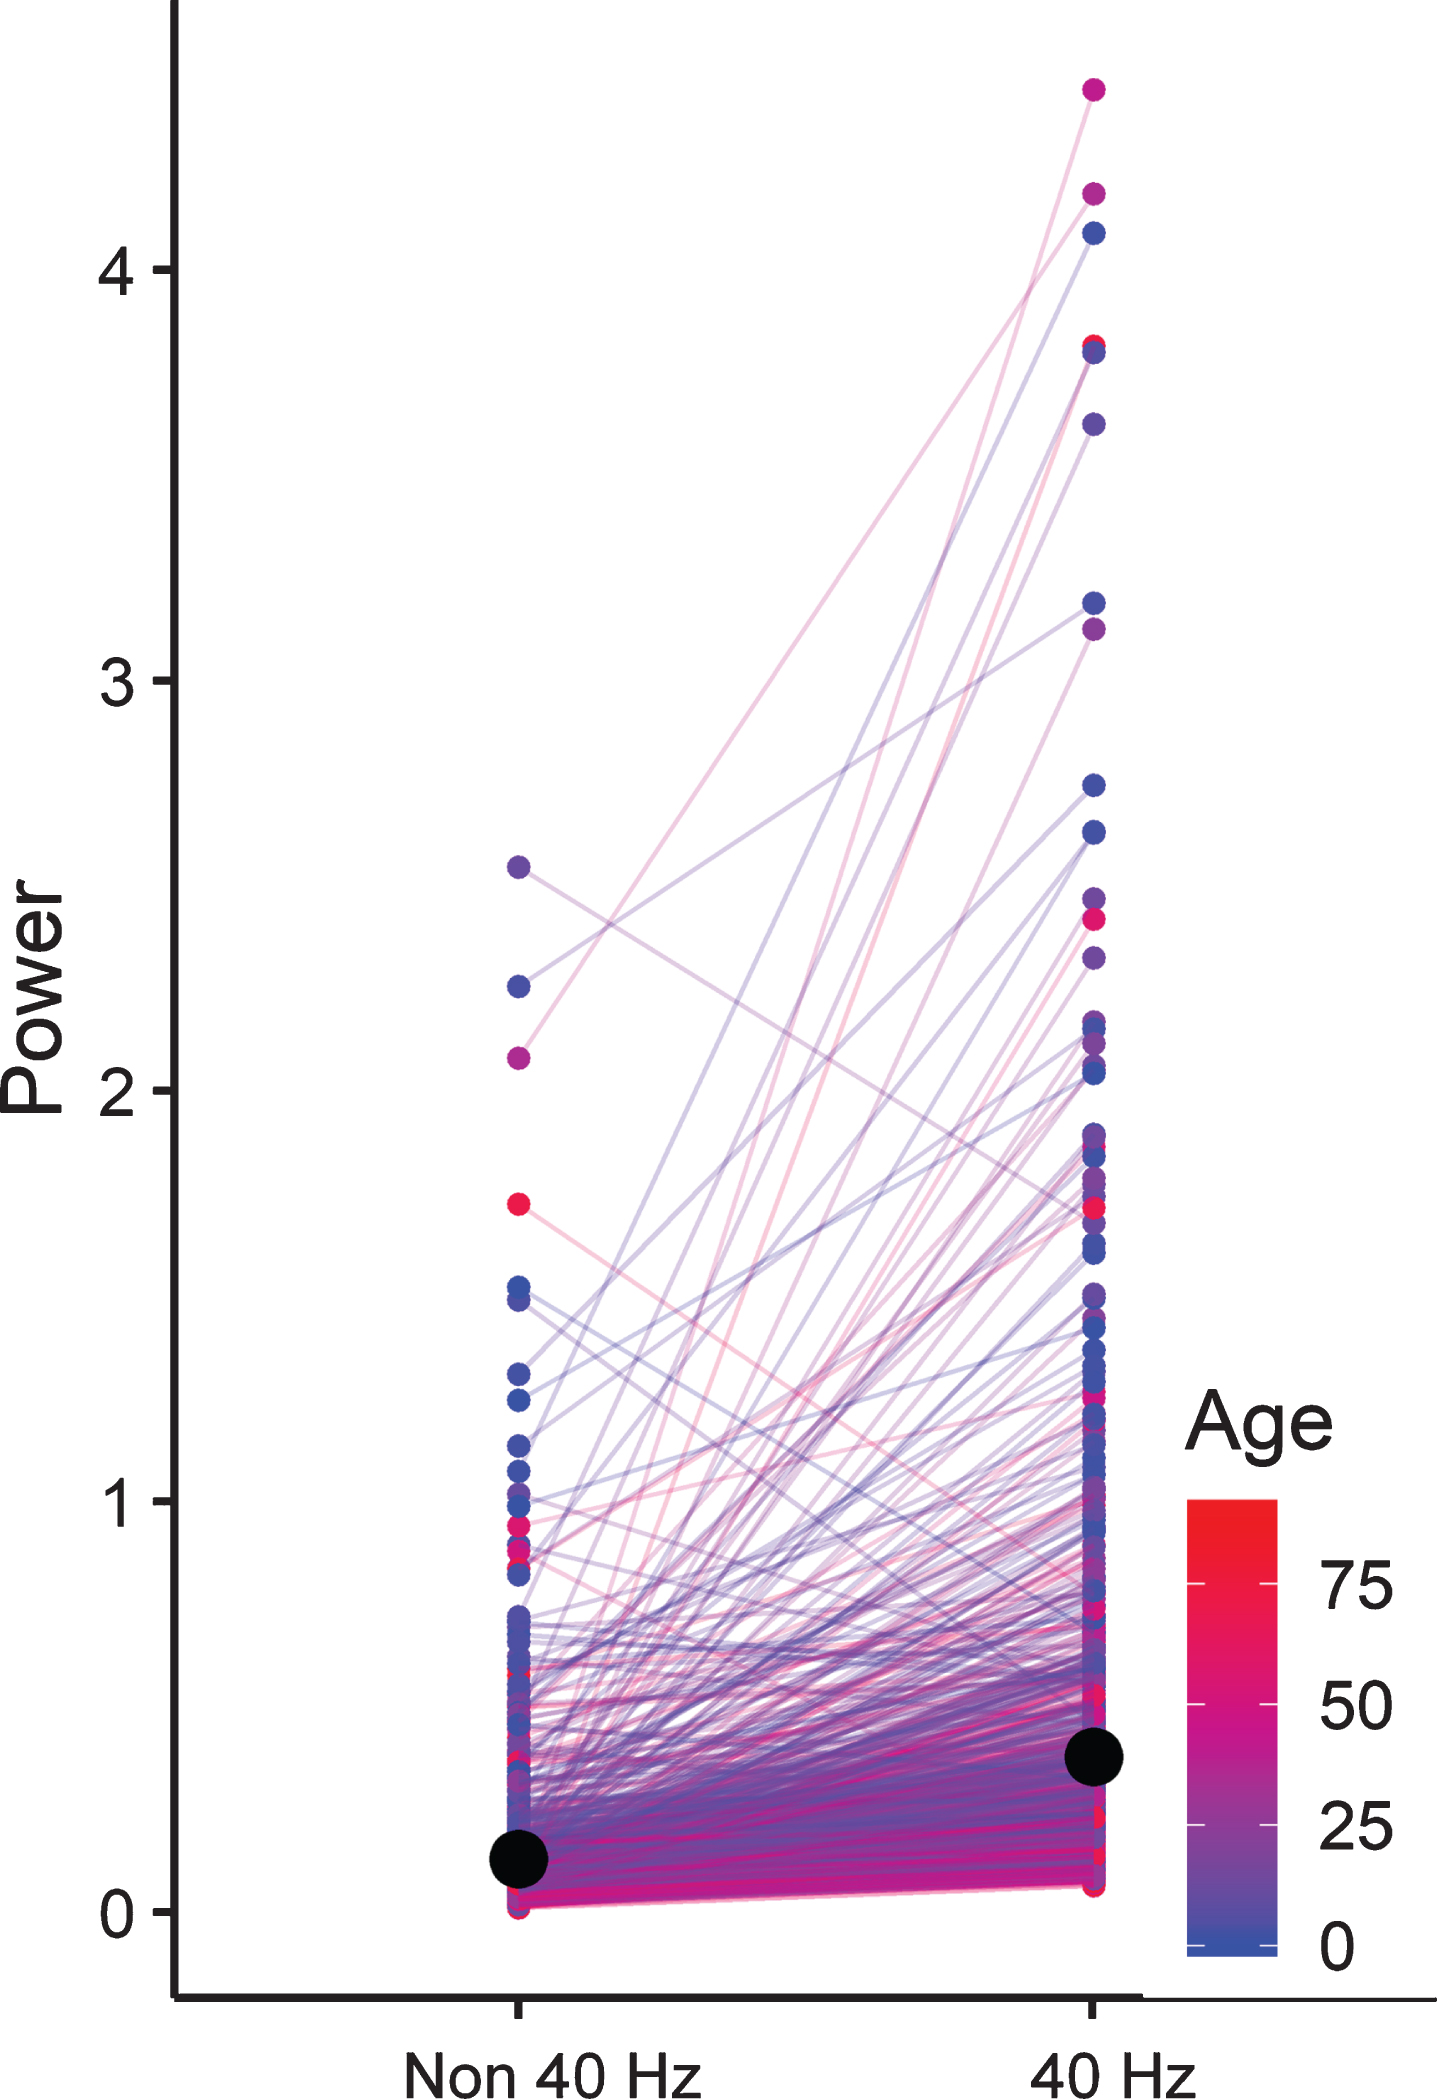
Spaghetti plot showing the change in 40 Hz normalized power between the average of the non 40 Hz intervals and the 40 Hz interval. Each line is color coded by the age of the patients. The black dot marks the average in each group.
Effects of age and sex
From Fig. 5, we see a tendency for higher age (in red) to cluster in the lower power range compared to the younger patients. To examine the effect of age on the power change we used a multiple linear regression model (Fig. 6) to predict the change in normalized power based on the age and sex of the patients. We found a significant effect of age (β= – 0.002, CI 95 % [– 0.003, – 0.001], t = – 3.934, p < 0.0001), and a non-significant effect of sex (β= – 0.009, CI 95 % [– 0.06, 0.04], t = – 0.348, p = 0.728).
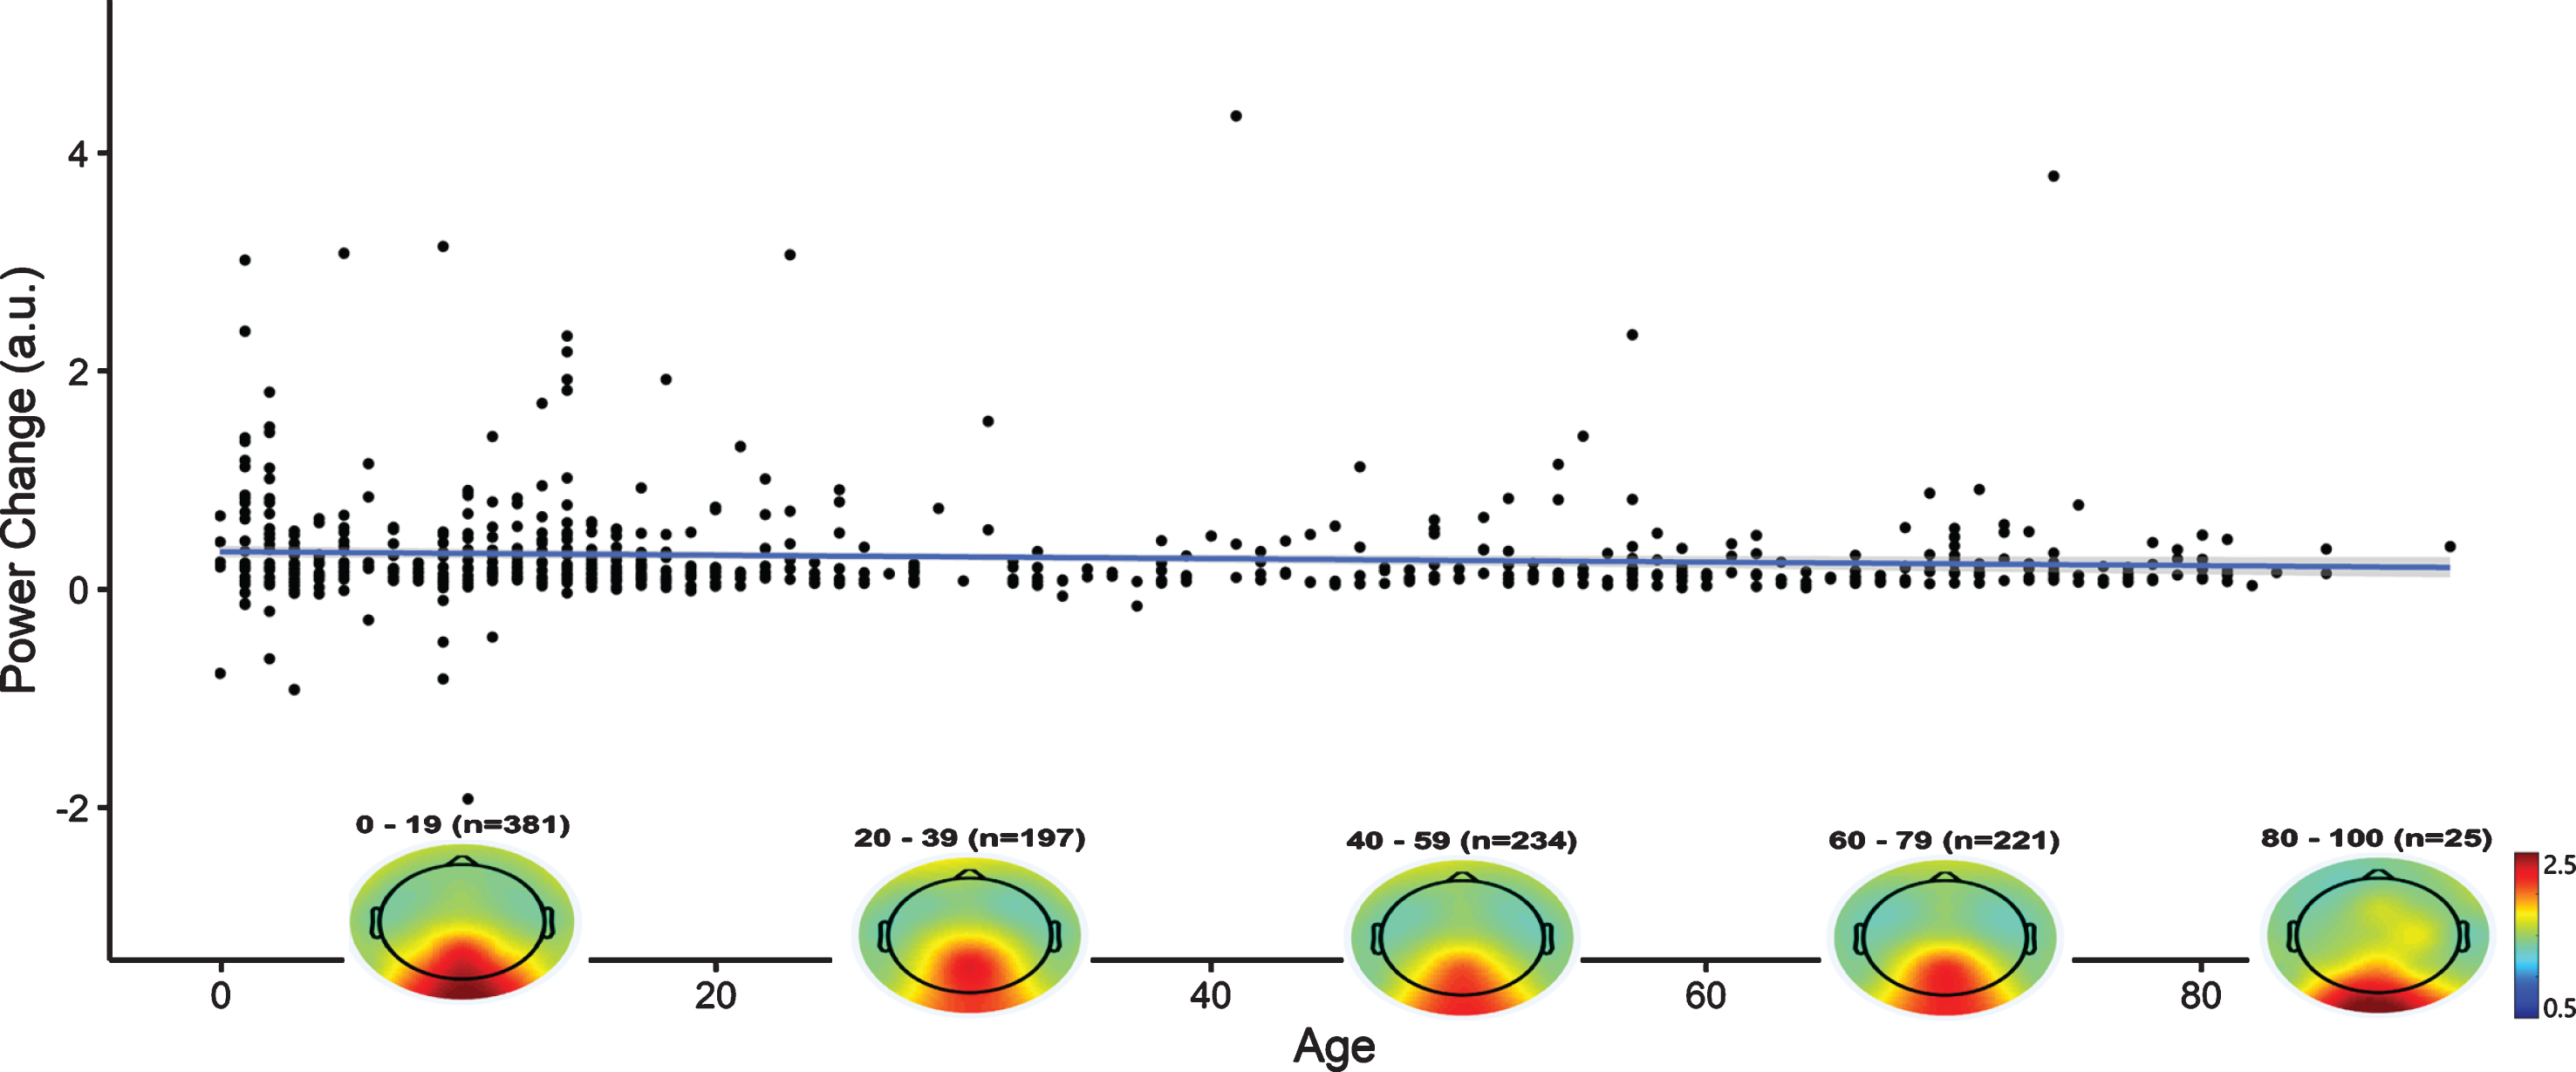
Scatter plot showing the normalized power change, in arbitrary units, as a function of age for the responder group. The blue line is the linear fit. The grey area surrounding the blue line is its CI 95 % band. Overlapping the x-axis is the average topographic power ratio for each age group indicated by the text above. The topographic distribution of 40 Hz power is stabile across all age groups.
This model ignores the non-responders, so we also tested the effect of age on the responder classification in a logistic regression model with sex a covariate (Fig. 7). We see a significant effect of age on the predicted responder rate (OR = 0.988, CI 95% [0.984, 0.993], p < 0.00001), the predicted responder status for males compared to females were significantly lower (OR = 0.625, CI 95 % [0.496, 0.787], p < 0.0001). For example, in the case of a 45-year-old man, this model predicts a probability of 61% chance of for an above threshold peak compared to a 71% probability for a 45-year-old woman.
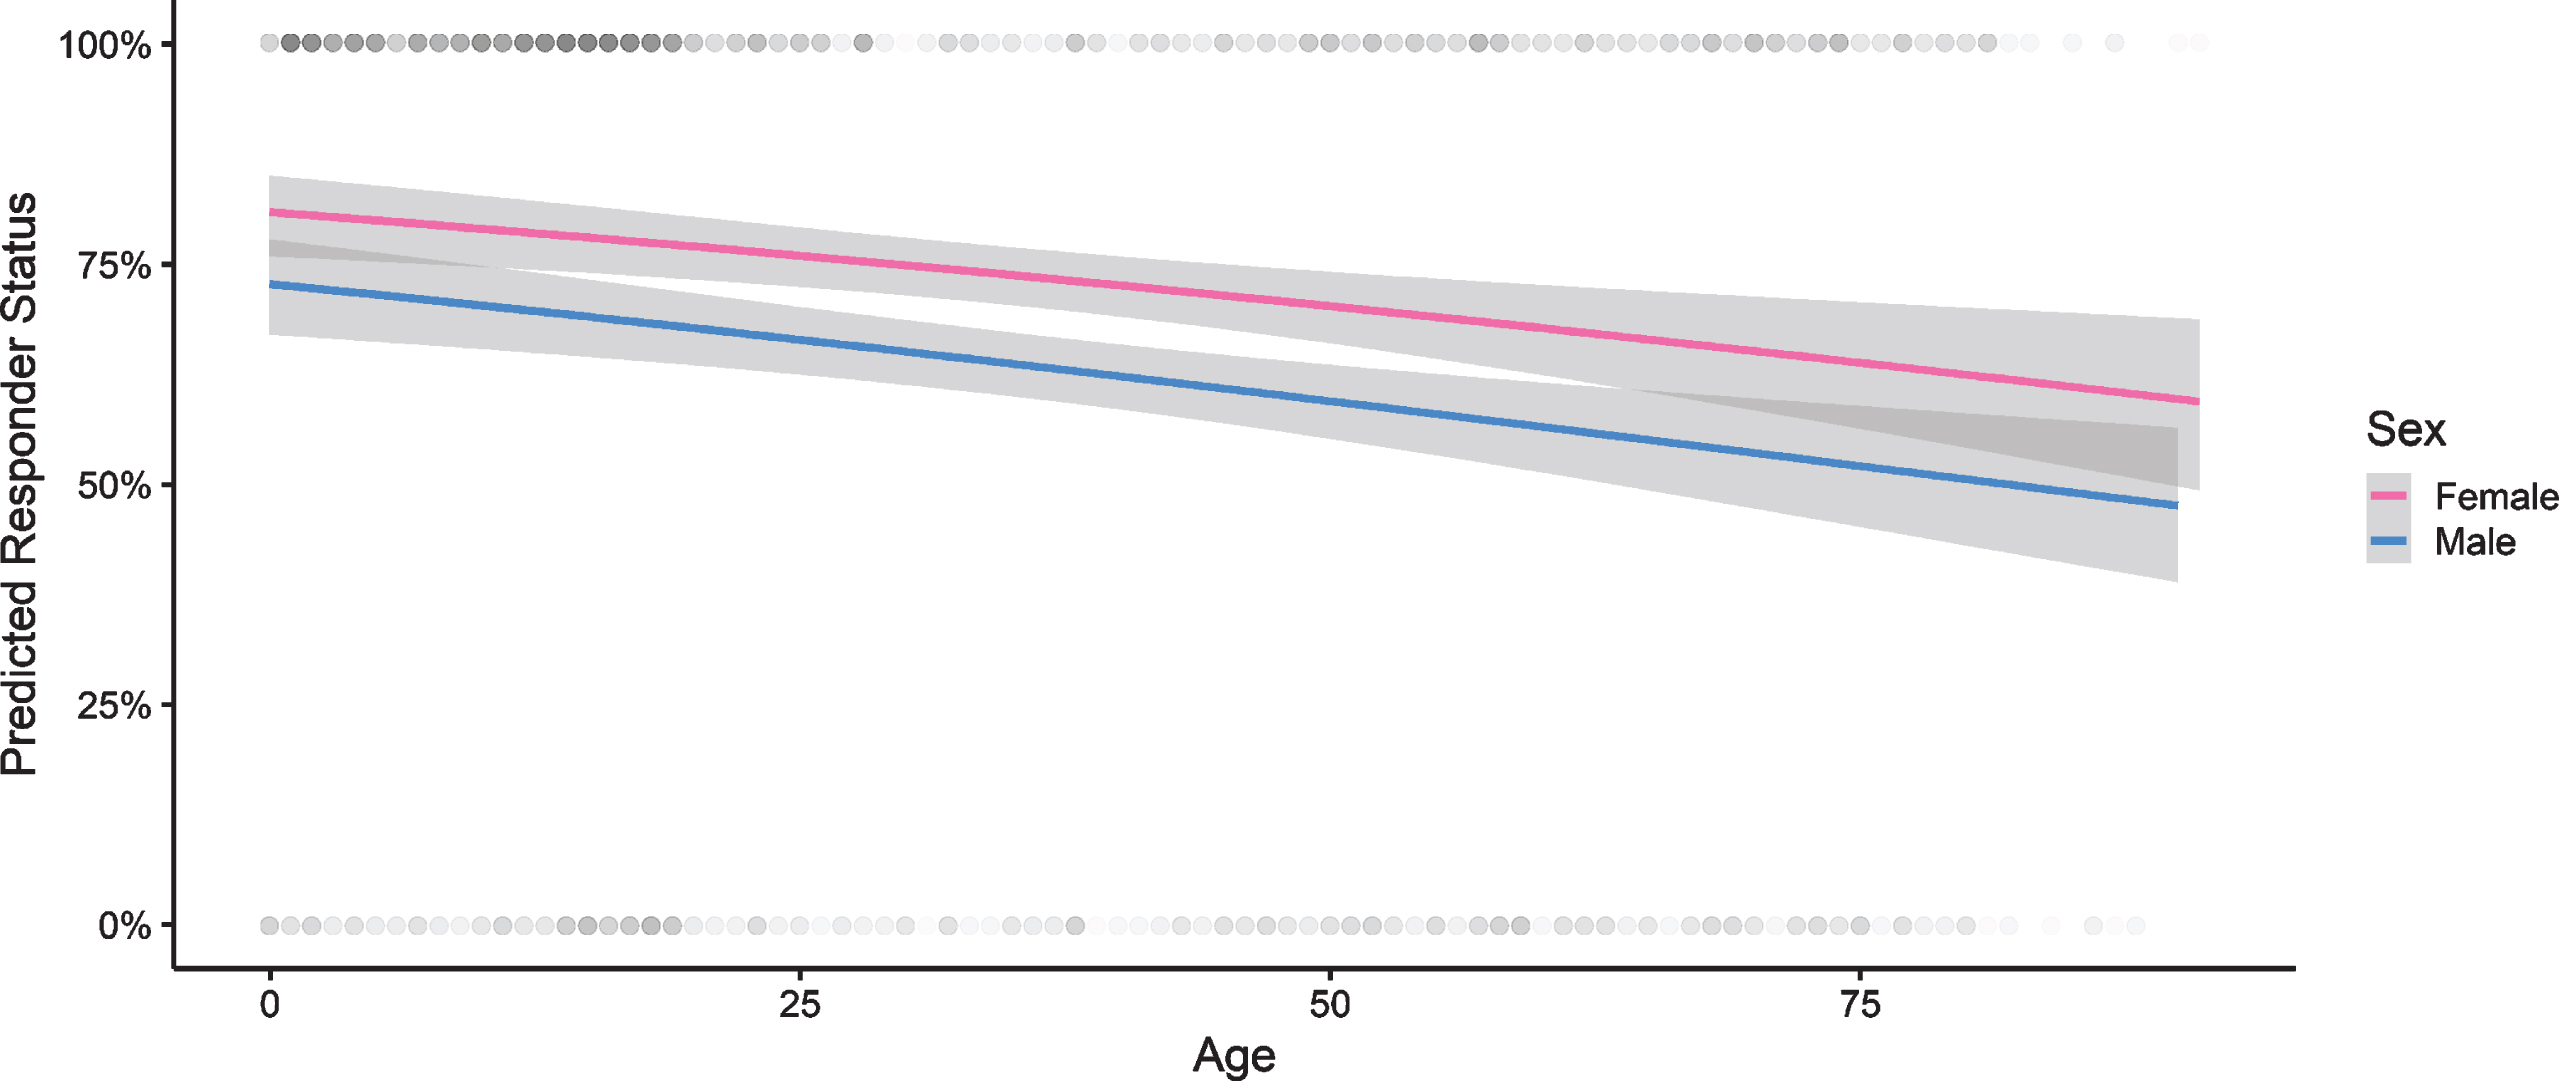
Predicted responder status based on peak detections as function of age in a logistic regression model. Red regression line is for females and blue for males. The grey area surrounding the lines indicates the 95 % CI. Individual observations are indicated by transparent grey dots at either 0% or 100%. Note the higher density of observations in the younger patients as responders.
Topographical analysis
Topographical mapping of power ratios for the responders and non-responders show a marked average difference (Fig. 8). There is an increase in normalized power of approximately 3 in the responder group in the posterior region. There is also a trace of this increase in the non-responder group, but at least 1.5 lower than in the responders.
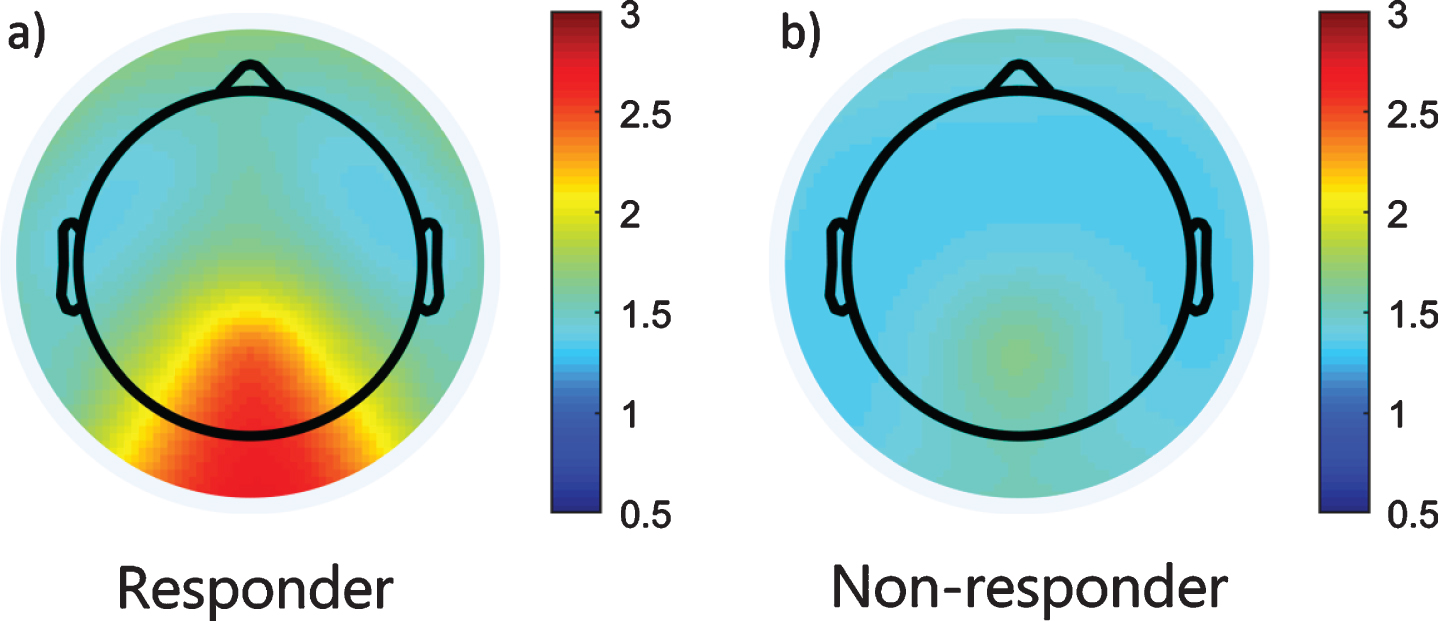
Topographic visualization of the normalized power ratio for the 779 responders with 25 channels EEG recording (a) and the 378 non-responders with 25 channel EEG recording (b). Note the marked occipital normalized power increase in the responders (a) compared to the non-responders that only have a trace of an increase.
Importantly, the response is spatially confined to the posterior region with no indication of equivalent fronto-centro-temporal co-activation. The responders have a slightly higher power ratio in the frontal area compared to the non-responders. This may be a result of grimacing during IPS.
Peak frequency estimation accuracy
To analyze the robustness of the automatic peak characterization method, we used Bland-Altman plots for the peak frequencies and signal-to-noise ratios (SNR) for the bilateral responders. The frequency estimates for O1 and O2 peaks are within±0.8 Hz of each other with no evidence of systematic bias (p = 0.98) (Supplementary Figure 2). SNR estimates of the peaks are within±1.2 of each other with no evidence of bias (p = 0.59) (Supplementary Figure 3). The funnel shaped pattern where most of the observations outside the limits of agreement are found farther right on the x-axis suggests a magnification effect where detection inaccuracy scales with spectral power, but the global power between spectra is not uniformly distributed and this can exaggerate the limits of agreement. Still, these are relatively narrow limits and in the absence of bias, we that makes us confident about the reliability of the automatic peak characterization.
DISCUSSION
Our results show a significant but small age-related reduction in 40 Hz IPS gamma entrainment. Reaching statistical significance is mostly a question of sample size and does not inform us about the importance of the age-related change. The shape of the relationship does not radically change over time; older patients do not exhibit a drastically sharper rate of decline.
SSVEP amplitudes from broad-band stimulation have been found to decrease with age [19, 20]. Age effects on the response to a neurophysiological test is in line with the observation that visual P3 event related potential (ERP) amplitude falls with increasing age and its latency increases [21]. Another study found that age also affected the relative alpha/gamma power and showed a functional effect of relatively lower gamma power in steady-state visual evoked potentials [22].
The variability of the amplitude change exists on a continuum until it is indistinguishable from random spectral fluctuations of varying noise levels. Our approach to gamma entrainment quantification involved a dichotomization of responder-status. A peak in the non-responder group spectral average further indicates that the response is continuous and overlapping. Several factors could have contributed to inability to characterize peaks on the individual level in some patients. IPS intervals included a variable mix of open and closed eyes, where the closed eyes condition attenuates amplitude leading to underestimation of the response. Without video, we have no way of determining how well patients have been able to adhere to instructions, nor how well they maintained gaze in the direction of the light source. Patients should generally be assumed to have good adherence on average, since they are motivated by diagnostic utility of the exam that they are undergoing, and they have been supervised and encouraged during the entire recording including IPS testing. Attention also modulates the SSVEP power [23]. Source separation analysis of SSVEP in high-density EEG has demonstrated that attention can have opposite effects on gamma-alpha couplings, positively modulating gamma but decreasing alpha, and that SSVEP responses are stronger when stimulation frequencies match alpha and gamma rhythms that are endogenous to the visual cortex [24].
Entrainment response becomes saturated reaching a maximal amplitude after just 5– 10 s at approximately 600 lux [10]. In our study, the light intensity was 190– 450 Lux, so 10 s of exposure in our study may have been at too low light intensity to reach saturation. Consequently, our peak amplitudes may be underestimated. This could potentially be a problem if age affects the maximum peak amplitude and we may not have saturated to maximum and will therefore overlook any such effect.
Additionally, the population contains a heterogeneous mix of etiologies that also varies with age. Genetic generalized epilepsies are more frequent among the younger, while acquired epilepsy and structural brain damage is more common in the older patients [1]. It is possible that some types of brain lesions impair the gamma entrainment response and if these are differentially expressed in higher age [21], they could contribute to the age-related effects we found. Despite having a heterogeneous group, we do not see a distinct cut-off age above which the response decreases at a much higher rate. This is an important finding establishing that there is little reason to believe that elderly patients are unreceptive to 40 Hz IPS. Age alone therefore cannot explain the failure to detect a change in amyloid in experimental IPS reported in a previous study [9].
The suggested mechanism of action by which induced 40 Hz oscillations is thought to have therapeutic potential for patients with AD is through activation and/or recruitment of microglial cells for clean-up of protein aggregates [3, 6]. As AD differentially affects regions in the brain, e.g., the hippocampus, during its time course [25], some have suggested a targeted approach by inducing 40 Hz gamma oscillations in specific areas of the brain [7]. The distribution of induced 40 Hz oscillations is therefore of interest. A potential therapeutic effect will likely depend on whether entrainment-effects on amyloid clearance is only locally effective, and that targeted therapy can be directed to the temporal regions. Alternatively, if the entrainment response can induce remote effects a targeted therapy may not be needed. Indeed it has been suggested to combine visual and auditory stimuli to target a larger volume of the brain [4]. This is also what is being reported in ongoing clinical trials [11, 12]. Studies have also demonstrated diminished 40 Hz activity in AD but that gamma band activity can be modulated through vibrotactile sensory stimulation [26]. A pilot study of rhythmic sensory stimulation at 40 Hz has also suggested that 40 Hz effects can be mediated through the somatosensory system [27]. In our study, we saw a significant entrainment restricted to the posterior part of the brain. It is possible that remote effects are present but either not detectable as a gamma power increase or that functional coupling to another frequency band exist. Theta-gamma couplings have been implicated in working memory, and studies using different recording techniques have demonstrated significant functional couplings in different brain structures, including occipito-temporal regions and the hippocampus [28].
Source separation may provide additional insights on the origin of the signal. If the source of the gamma signal is a deep structure the topographic distribution may be a result of volume conduction [29]. Another option is that the signal is generated by a larger number of more superficial sources. Spatial filters such as the surface Laplacian on at least 64 scalp electrodes prior to coherence and connectivity analyses could help clarify this and the question if gamma entrainment activates deep or superficial structures. In this study, we had a maximum of 25 electrodes, and thus we did not attempt this. Some studies suggests that gamma band oscillations are most prominent in superficial cortical areas [30]. Intracranial EEG recordings suggests that theta-gamma power coupling in the hippocampus scales with working memory load [31]. It is conceivable that cross-frequency couplings are bi-directional and power dependent. In that case, occipital gamma entrainment may affect other areas through cross-frequency coupling and future studies need to take this into consideration. Additionally, the magnitude of the entrainment may exhibit a dose-related response. Considering light therapy for patients with AD, reduced receptiveness to IPS as indicated in one study of alpha band power must also be considered [32].
In conclusion, we have determined that despite increasing age having a negative effect on the amplitudes and predicted responder status, the responsiveness was not abolished even in advanced age. To our knowledge, this is the first study with a large sample size (n = 1,464) used to evaluate the effect of age using objective and automated peak detection methods. Additionally, we have been able to use the patients as their own controls, avoiding inter-individual variation. This is important for future studies on the therapeutic potential of 40 Hz IPS for treatment of AD.
Footnotes
ACKNOWLEDGMENTS
This project has not received any specific funding. IZ is funded from the Innovation Fund Denmark. TK is a full-time employee of Region Zealand.
The salary of MA is provided from a grant made by the company Optoceutics who is working on technologies for AD. Optoceutics have not been involved in the preparation of this manuscript.