
Abstract
Background:
White matter energy supply to oligodendrocytes and the axonal compartment is crucial for normal axonal function. Although gray matter glucose hypometabolism is extensively reported in Alzheimer’s disease (AD), glucose and ketones, the brain’s two main fuels, are rarely quantified in white matter in AD.
Objective:
Using a dual-tracer PET method combined with a fascicle-specific diffusion MRI approach, robust to white matter hyper intensities and crossing fibers, we aimed to quantify both glucose and ketone metabolism in specific white matter fascicles associated with mild cognitive impairment (MCI; n = 51) and AD (n = 13) compared to cognitively healthy age-matched controls (Controls; n = 14).
Methods:
Eight white matter fascicles of the limbic lobe and corpus callosum were extracted and analyzed into fascicle profiles of five sections. Glucose (18F-fluorodeoxyglucose) and ketone (11C-acetoacetate) uptake rates, corrected for partial volume effect, were calculated along each fascicle.
Results:
The only fascicle with significantly lower glucose uptake in AD compared to Controls was the left posterior cingulate segment of the cingulum (–22%; p = 0.016). Non-significantly lower glucose uptake in this fascicle was also observed in MCI. In contrast to glucose, ketone uptake was either unchanged or higher in sections of the fornix and parahippocampal segment of the cingulum in AD.
Conclusion:
To our knowledge, this is the first report of brain fuel uptake calculated along white matter fascicles in humans. Energetic deterioration in white matter in AD appears to be specific to glucose and occurs first in the posterior cingulum.
INTRODUCTION
White matter degeneration has long been observed in Alzheimer’s disease (AD) [1, 2]. The main changes include atrophy and loss of axons [1, 3], demyelination [4, 5], loss of oligodendrocytes [1, 6], microglial activation [3, 7], and vascular degeneration [3, 8]. Diffusion magnetic resonance imaging (MRI) is currently the only non-invasive imaging technique designed to study white matter fascicles in vivo. Most diffusion MRI studies of AD have used the diffusion tensor imaging (DTI) model. Many cross-sectional DTI studies comparing AD with cognitively normal controls show significantly lower white matter fractional anisotropy and higher mean diffusivity, particularly in the medial temporal region, posterior cingulum, and splenium of the corpus callosum [9, 10], but also in the uncinate fasciculus [11–13], the inferior longitudinal fasciculus [14], and the fornix [15–17]. The ‘retrogenesis model’ of AD postulates that late and poorly-myelinated regions will undergo demyelination first, i.e., limbic fascicles including the cingulum [18–20], since they have a lower oligodendrocyte-to-axon ratio than other fascicles [21].
In mild cognitive impairment (MCI),which corresponds to prodromal AD in about 50% of patients, a meta-analysis of DTI studies revealed that fractional anisotropy in the parahippocampal cingulum best differentiates MCI from cognitively normal controls [22]. The parahippocampal cingulum fascicle has a major role in episodic memory [23, 24], a cognitive domain disrupted early in the course of AD.
Never the less, DTI is not robust to crossing-fiber populations in a voxel, which is the case for most white matter voxels [25], and fascicle-specific changes can thus be hard to identify. High angular resolution diffusion imaging enables the detection of multiple fiber orientations in a voxel [26, 27] and permits subtle local white matter degeneration to be identified along fascicles such as the cingulum, corpus callosum, uncinate fasciculus, and fornix in AD [28, 29].
Standard DTI measures are also not robust to cerebrospinal fluid (CSF) contamination [30–32]. This contamination can be reduced with the free-water model [33], which separates the effect of cellular diffusion from extracellular isotropic water movement, the latter being referred as the ‘free-water fraction’. This method may be relevant to AD characterization and discrimination [32, 34–36], considering white matter atrophy and ventricle enlargement associated with its pathology.
White matter energy supply has direct implications for axonal integrity and hence adequate fascicle function through metabolic coupling between oligodendrocytes and myelinated axons [37]. Energy supply maintains resting axon potential and supports intracellular trafficking of molecules [38, 39]. Oligodendrocytes need energy for synthesis and dynamic remodeling of myelin throughout life [40, 41]. Glucose is the main energy substrate for oligodendrocytes which provide lactate and pyruvate via monocarboxylate transporters to the axonal compartment [40, 42]. During energy deprivation, ketones (acetoacetate and β-hydroxybutyrate) are the main alternative brain fuel to glucose. Like lactate, ketones are transported into brain cells through the monocarboxylate transporters. In prolonged fasting, ketones can supply ≥60% of the brain’s energy requirements [43].
Lower glucose uptake in certain cortical regions is extensively reported to precede the clinical diagnosis of AD [44–50]. On the contrary, gray matter uptake of ketones is unchanged in MCI and mild AD [45, 51]. Nevertheless, to our knowledge, nothing is known about glucose or ketone uptake in white matter fascicles during aging or in AD. In the present cross-sectional study, we aimed to characterize white matter fascicle energetic deterioration in the course of AD. We developed a quantitative dual-tracer positron emission tomography (PET) method combined with fascicle-specific diffusion MRI, to quantify glucose and ketone uptake rates in specific white matter fascicles in three groups: AD, MCI, and cognitively healthy age-matched controls (Controls). We focused the analysis on eight fascicles of the limbic lobe [52] and corpus callosum (Fig. 1). We also evaluated diffusion measures in these fascicles, including the free-water fraction. Here, we use the term ‘fascicle’ synonymously with ‘bundle’ or ‘tract’. ‘Streamlines’ designate white matter fibers generated from tractography, and glucose and ketone uptake rate constants (K; min-1) are referred to as ‘uptake’.
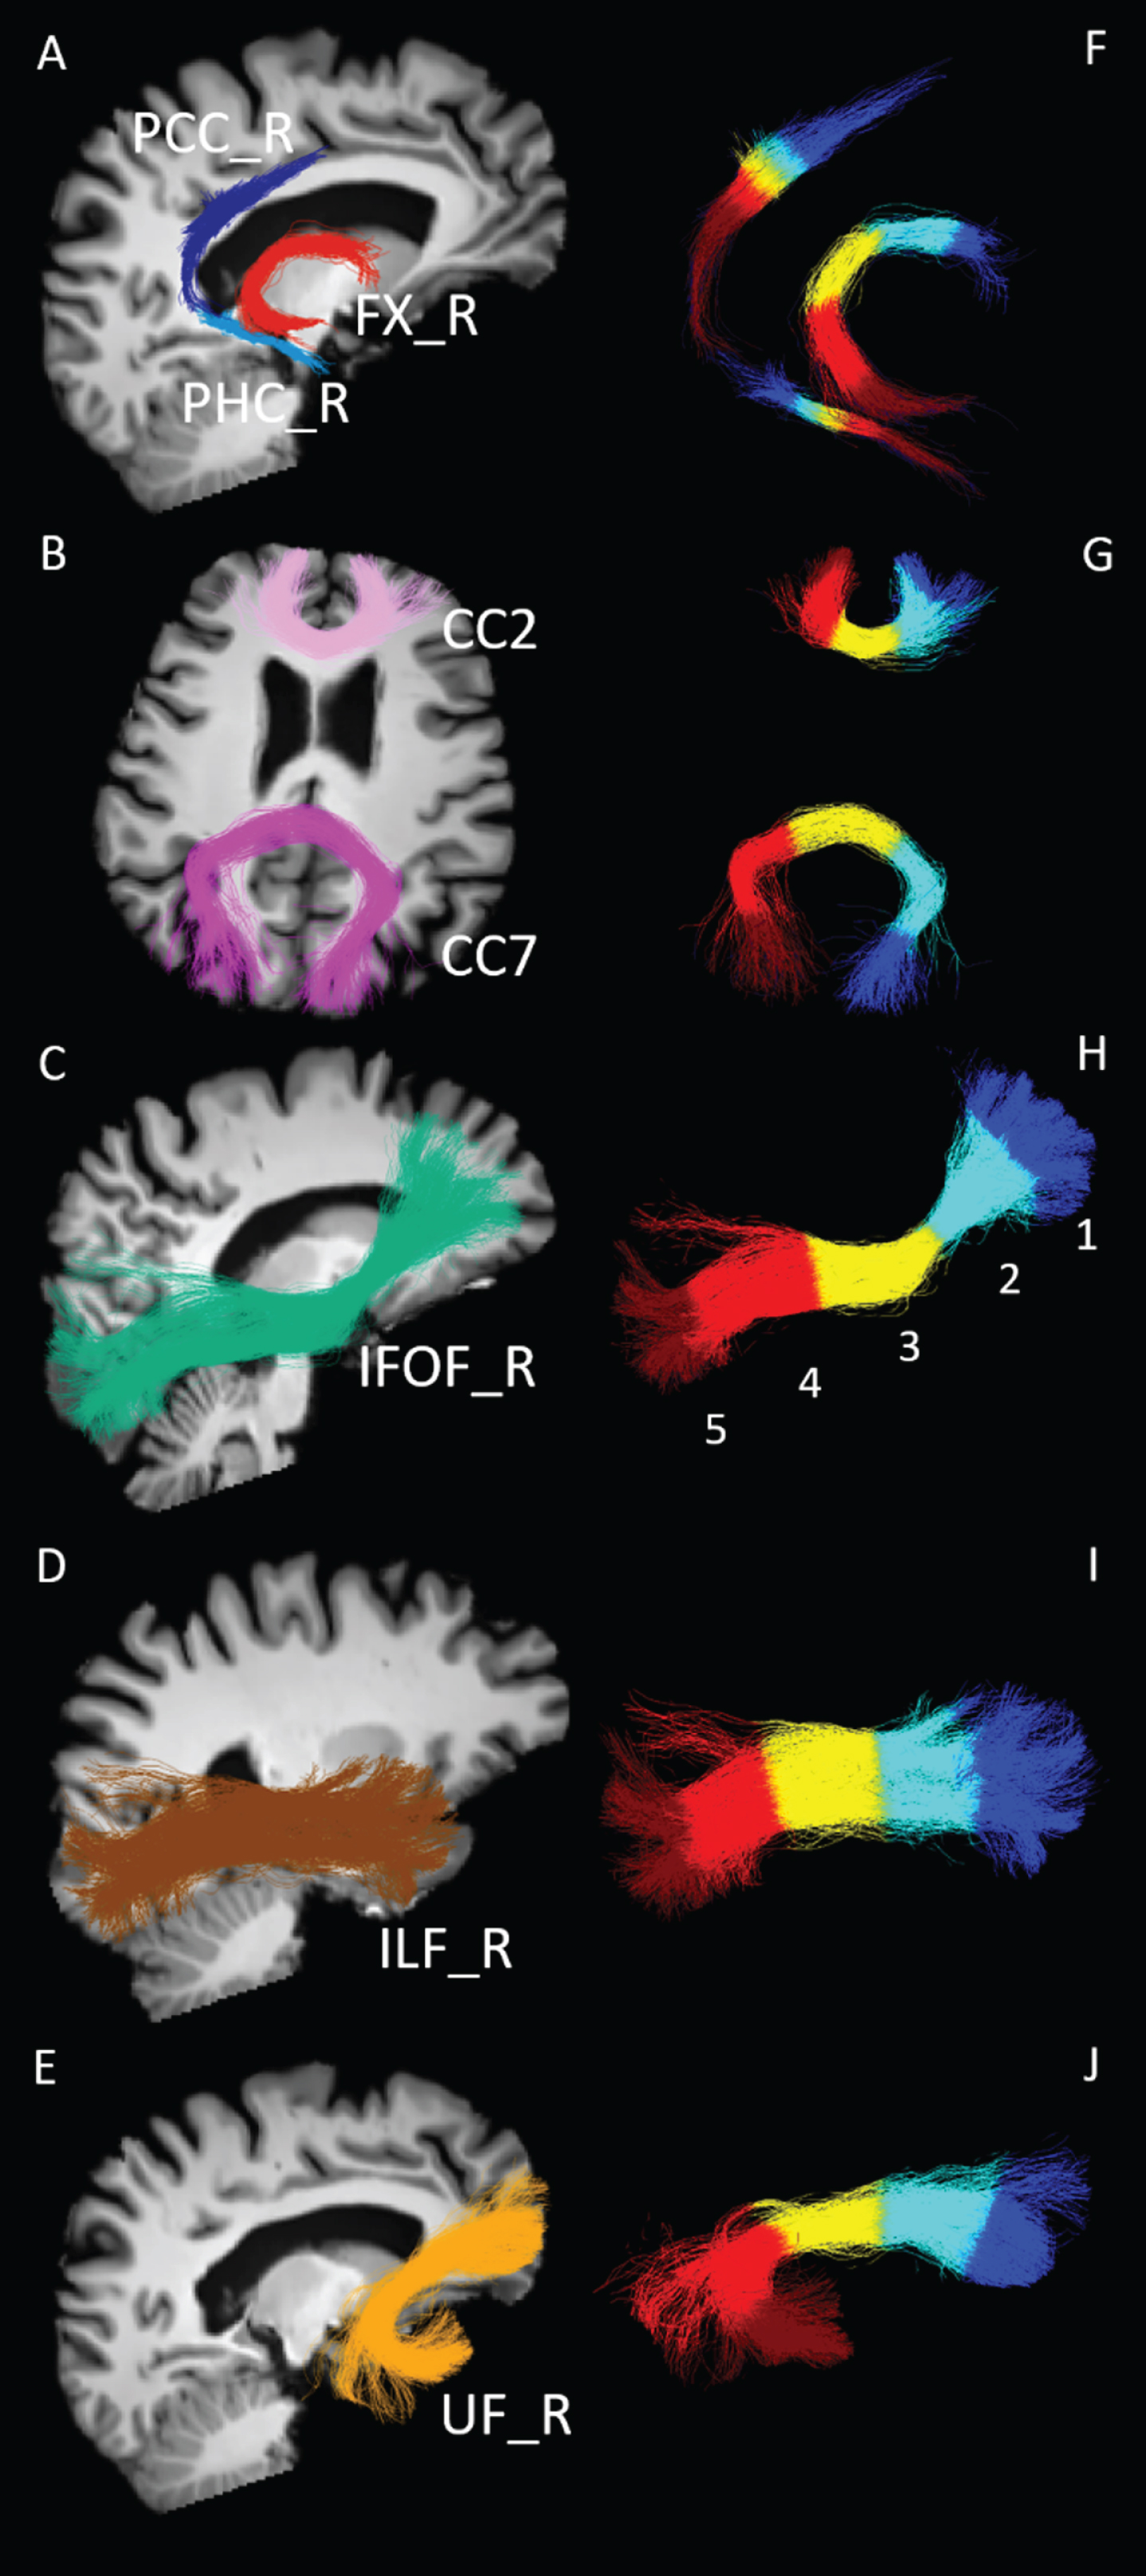
White matter fascicles extracted and analyzed. Representative white matter fascicles extracted from one cognitively healthy age-matched control. A–E) Fascicles are overlaid on the T1-weighted images (registered on diffusion MRI data) for anatomical landmarks. PCC, posterior cingulate segment of the cingulum (dark blue); PHC, parahippocampal segment of the cingulum (light blue); FX, fornix (red); CC2, genu of the corpus callosum (lilac); CC7, splenium of the corpus callosum (purple); IFOF, inferior fronto-occipital fasciculus (green); ILF, inferior longitudinal fasciculus (brown); UF, uncinate fasciculus (orange). Fascicles from the right (R) hemisphere are shown. F–J) Fascicles are subsampled in 5 equidistant parts (colored independently) to generate fascicle profiles: section 1: dark blue; section 2: light blue; section 3: yellow; section 4: light red; section 5: dark red.
MATERIALS AND METHODS
Participants
This study was approved by our institutional ethical committee (CIUSSS de l’Estrie–CHUS, Sherbrooke, Quebec, Canada) and informed written consent was obtained from all participants (Table 1). Controls (n = 14) had a Mini-Mental State Examination (MMSE) score ≥27/30 and Montreal Cognitive Assessment (MoCA) score ≥26/30. Inclusion criteria for MCI (n = 51; [53]) were: subjective memory complaint, cognitive impairment in one or more domains of a neuropsychological tests battery compared with appropriate normative data (≥1.5 standard deviation less than the mean), a MoCA score of 18–26/30 or MMSE score of ≥24/30, no evidence of probable or possible AD or depression (score ≤10 on the Geriatric Depression Scale 30-items) and full autonomy for daily living activities (score ≤15/24 on the IADL subscale of the Functional Autonomy Measuring System) [54]. Probable or possible AD cases (n = 13) met NIA-AA (National Institute of Aging and the Alzheimer’s Association) criteria [55]. Other inclusion criteria were: MMSE score ≥18 to select only mild to moderate AD, absence of depression (score ≤10 on the Geriatric Depression Scale 30-items) and with or without use of prescribed medication for AD. Exclusion criteria included major depression or history of alcohol or substance abuse within the past 2 years, smoking, uncontrolled diabetes (fasting plasma glucose >7 mM or glycated hemoglobin >6.5%), overt evidence of heart, liver or renal disease, uncontrolled hypertension, dyslipidemia, thyroid disease or vitamin B12 deficiency, inability to lie down without moving for 60 min (for the brain imaging session), or the presence of implanted metal objects or devices contraindicated for MRI. Screening tests for all participants were reviewed by a physician before enrollment.
Clinical data of participants
Data are presented as mean±standard deviation. Statistical analysis was made using Brown-Forsythe ANOVA test or the chi-square test for gender proportions. Plasma glucose and ketones were measured prior the imaging protocol, after a 6-hour fast. Controls, cognitively healthy age-matched controls; MCI, mild cognitive impairment; AD, Alzheimer’s disease; MMSE, Mini-Mental State Examination; MoCA, Montreal Cognitive Assessment score.
Image acquisition
MRI
After breakfast, participants fasted for about 6 hours prior the imaging protocol. MRI data were acquired with a 3 Tesla Philips Ingenia system. Participants underwent a 3D T1-weighted scan (scan duration = 6 min, repetition time = 7.9 ms, echo time = 3.5 ms, matrix size = 240 × 240 × 160 mm, flip angle = 8° and 1 mm isotropic voxels), followed by high angular resolution diffusion imaging acquisition with parallel imaging Sense 2 (scan duration = 11 min, repetition time = 11 s, echo time = 100 ms, matrix size = 128 × 128 × 78 mm, 1.8 mm isotropic voxels, 60 directions, b = 1500 s/mm2), and one blip-up/blip-down b = 0 s/mm2 acquisition to correct for distortions.
PET
The MRI protocol was followed on the same day by a dual-tracer PET session described previously [45]. PET images were acquired on a PET/CT Philips Gemini system, in dynamic list mode with an isotropic voxel size of 2 mm3. First, 11C-acetoacetate (AcAc) was injected for a scan duration of 10 min with time frames of 12×10 s, 8×30 s, and 1×4 min. An hour after the AcAc scan, 18F-flurodeoxyglucose (FDG) was injected and acquisition started 30 min post-injection and lasted for 30 min with time frames of 6×5 min. Three (AcAc) and six (FDG) blood samples were taken during acquisitions and used to correct image-derived input functions. Plasma glucose was measured with a glucose assay (Siemens Healthcare Diagnostics) and plasma ketones were measured as previously described [56].
Image analysis
Diffusion MRI
Except where otherwise indicated, all processing steps were performed using TractoFlow pipeline [57] based on the Diffusion Imaging for Python library (DIPY) [58], MRtrix3 [59], the FMRIB software library (FSL) [60], and ANTs [61]. Preprocessing of diffusion-weighted images included brain extraction, denoising, field inhomogeneity correction, distortion artefacts, eddy-current and motion corrections. Diffusion-weighted images were up-sampled to 1 mm isotropic resolution and normalized with the median intensity in b = 0 s/mm2 images [29, 57].
The free-water fraction [33] was computed with a prior for mean diffusivity of 2.5×10⁻³ mm2/s and parallel diffusivity of 12.4×10⁻⁴ mm2/s, calculated from the mean of all participants. DTI measures (fractional anisotropy, mean, radial and axial diffusivities) were computed and free-water-corrected to reduce partial volume effects of the CSF [30–32, 62]. Fiber orientation distribution functions (fODF) were computed using Constrained Spherical Deconvolution [26, 27] with a fixed fiber response (12.4, 3.8, 3.8×10⁻⁴ mm2/s), calculated from the mean of all participants.
Templates of T1-weighted images and fractional anisotropy maps from MCI participants were created using ANTs. White matter, gray matter, and CSF masks were then generated using the T1 template. These templates and masks enabled white matter hyperintensities (WMH) commonly present in aged populations to be eliminated [63]. WMH are found in the deep white matter but also in the periventricular region, i.e., close to some of our fascicles of interest. Although often ignored in tractography studies in elderly populations, WMH represent a bias for tractography [64, 65]. They often qualify as gray matter tissue, when the usual segmentation tools developed for young populations are used, which creates holes in the white matter mask and therefore streamline propagation is stopped in these regions. Templates and masks were then non-linearly registered to the native space of each participant using ANTs. Local probabilistic tractography was used to reconstruct whole brain tractograms, robust to crossing fibers and WMH. Tracking was done with six seeds per voxel and initiated from voxels combining total white matter and white matter-gray matter interface masks, generating about two million streamlines.
Automated fascicle segmentation
A modified version of the RecoBundles algorithm [66] was used to automatically extract the fascicles of interest: uncinate fasciculus, inferior fronto-occipital fasciculus, inferior longitudinal fasciculus, and genu and splenium of the corpus callosum (Fig. 1). The latter can be divided in seven sub-regions [67], and the ones altered in AD (genu and splenium) were extracted in the present study. The extension of the initial RecoBundles algorithm resides in a multi-atlas, multi-parameters approach followed by a labels fusion using a majority vote. In this algorithm, whole brain tractograms are first registered to a tractogram atlas, and fascicles are individually extracted based on centroids and distances to the atlas. The modified version atlas comprises 33 major fascicles, pre-segmented on five different healthy subjects from the Human Connectome Project dataset [68]. These segmentations were validated by two neuroanatomists for consistency to generally accepted anatomical definitions of the white matter fascicles and were used as references for the segmentation process.
The cingulum fascicle consists of multiple sub-connections, among which DTI measures may differ [69, 70]. Whitford and colleagues [71] proposed regrouping these short association fibers into five segments. In the present study, we extracted two of these segments, the parahippocampal and posterior cingulate of the cingulum (Fig. 1A), both of which are crucial for episodic memory and have implications for the progression to MCI [24, 72]. Streamlines connecting the parahippocampal cortex to the isthmus cingulate cortex (also referred as the retrosplenial cortex) and the isthmus cingulate cortex to the posterior cingulate cortex [23] were automatically extracted using the Desikan/Killiany FreeSurfer atlas and white matter query language method [73].
The fornix has a vital role in the memory circuit but is extremely hard-to-track [74] due to its high curvature, narrow shape, and location adjacent to ventricular spaces, contaminating voxels with CSF [30, 62]. Hippocampal atrophy and ventricles enlargement associated with aging make it, often, impossible to track the fornix with current tractography techniques and default masking strategies. Thus, a fascicle-specific approach developed by Rheault and colleagues [75, 76] was used for the fornix reconstruction (Fig. 1A), which is summarized in the Supplementary Material.
PET
Dynamic FDG and AcAc PET images were analyzed as previously described [45, 77] using PMOD 3.807 and its kinetic modeling tool PXMOD. Briefly, voxel-wise maps of uptake rate constants (K; min–1) were generated for FDG and AcAc using the Patlak method [78]. T1-weighted brain masks and blood input functions were required to generate the voxel-wise uptake maps. Arterial input functions were determined by manually defining regions of interest on the internal carotid arteries [77]. Input functions were partial volume-corrected and calibrated against the corrected radioactivity in blood samples obtained during each PET scan. Voxel-wise uptake maps were then corrected for partial volume effect using the modified Muller-Gartner method, implemented in PMOD. Lastly, uptake maps were co-registered to diffusion MRI data using ANTs. First, FDG maps were registered to original T1-weighted images with a rigid transformation. Transformations were then applied to AcAc maps and, finally, the original T1-weighted to diffusion MRI space transformation was applied to uptake maps (Fig. 2). These final maps were used as input measures to generate fascicle profiles of glucose (FDG) and ketone (AcAc) uptake.

Glucose uptake along the fornix and posterior cingulum. Sagittal views of the right (R) and left (L) parahippocampal (PHC) and posterior cingulate (PCC) segments of the cingulum and fornix (FX) from one cognitively healthy age-matched control. These two fascicles are overlaid on the T1-weighted image (registered on diffusion MRI data) for anatomical landmarks and colored according to their glucose uptake rate constant (K; FDG, 18F-flurodeoxyglucose; min–1).
Fascicle profiles
A tractometry pipeline adapted from Cousineau and colleagues [79] was used to generate fascicle profiles of glucose and ketone uptake and free-water fraction of five sections/fascicle (Fig. 1) to better capture where the between group differences occurred along the fascicle [65]. Fascicle profiles enable the comparison of PET tracer uptake in both extremities and middle of fascicles, which is not possible using mean fascicle values. Glucose and ketone uptake is higher in the cortex than in total white matter [45], so these two variables were also calculated in fascicle streamline endpoint voxels, i.e., at the cortical terminations of fascicles (head and tail) (Fig. 3). Voxels at the head of fascicles are connected to section 1 and the ones at the tail are connected to section 5 of fascicle profiles.

Endpoint voxels of a representative fornix. A 3D view of the fornix from one cognitively healthy age-matched control colored according to its level of glucose uptake rate constant (K; FDG, 18F-flurodeoxyglucose; min–1). Fascicle streamline endpoint voxels (the cortical terminations of fascicles) are overlaid and colored in purple.
Quality control
A visual quality assessment procedure was performed for all major steps including preprocessing, tensor vectors, fascicle segmentation, fascicle profiles, and PET maps registration to diffusion data in every participant.
Statistical analysis
Results are presented as the mean±standard error of the mean (SEM). All statistical analyses were performed using SPSS 25.0 software. For clinical data, endpoints glucose and ketone uptake and free-water-corrected DTI measures, comparisons between Controls, MCI, and AD were performed with the Brown-Forsythe ANOVA test, which adjust the F ratio and degrees of freedom for heterogeneity of within-group variances. Each p value was adjusted to account for multiple group comparisons with the Dunnett’s T3 test.
For fascicle profiles, the different measures (free-water fraction, glucose and ketone uptake rate constants (K; min–1)) per section (1 to 5) were considered as repeated measures with a general linear model to assess the effect of groups (Controls, MCI, and AD). The Geisser-Greenhouse correction was used for variability of differences in sections. If the group factor was statistically significant, the repeated measures–general linear model was re-run with only two groups, to assess differences between these two groups. p values were adjusted to account for multiple group comparisons (AD versus MCI, AD versus Controls, and MCI versus Controls; multiplying p-values by three). If the group-section interaction was statistically significant, meaning different fascicle profile trajectories between groups, the repeated measures–general linear model was re-run with one section removed, to identify sections with differences. Supplementary statistical analyses were run with a repeated measures–general linear model including education, age and gender as covariates. Correlations were performed to assess associations between the free-water fraction and glucose uptake, where two-tailed p values were used. p < 0.05 was considered statistically significant in the present study.
Data availability
Original data and processed data will be made available upon request. All processing steps and results can be reproduced using the TractoFlow pipeline [57] and RecoBundles fascicle models are published on Zenodo [80].
RESULTS
Clinical data
Participants did not differ in age, male to female ratio, or plasma glucose and ketone levels (Table 1). MMSE and MoCA scores agreed with the clinical diagnosis of MCI and AD. Two participants in the AD group had a MMSE score <20/30. The AD group was thus classified as ‘mild to moderate’.
Fascicle profiles of glucose uptake
In the fascicle profiles, glucose uptake was significantly different across sections of the fascicles of interest [p < 0.001], except for the parahippocampal segments of the cingulum and right posterior cingulate segment of the cingulum (Fig. 4 and Supplementary Figure 1). A significant difference of glucose uptake between the three groups was found in the left posterior cingulate segment of the cingulum, with lower uptake in AD compared to Controls [F (24) = 9.28, p = 0.016] (Fig. 4F); no other group effects in glucose uptake were observed. Glucose uptake was 22% lower in section 5 of the left posterior cingulate segment of the cingulum in AD compared to Controls. Lower glucose uptake in this fascicle was also observed in MCI, although not significant. When comparing mean fascicle values, the left posterior cingulate segment of the cingulum had 18% lower glucose uptake in AD compared to Controls (data not shown; [F (34) = 3.96, p = 0.028]). There was a significant interaction between glucose uptake across sections and groups (different fascicle profile trajectories between groups) in the genu of the corpus callosum [F (300) = 3.64, p = 0.001] and uncinate fasciculus [right: F (300) = 2.73, p = 0.006; left: F (300) = 2.49, p = 0.013](Supplementary Figure 1).
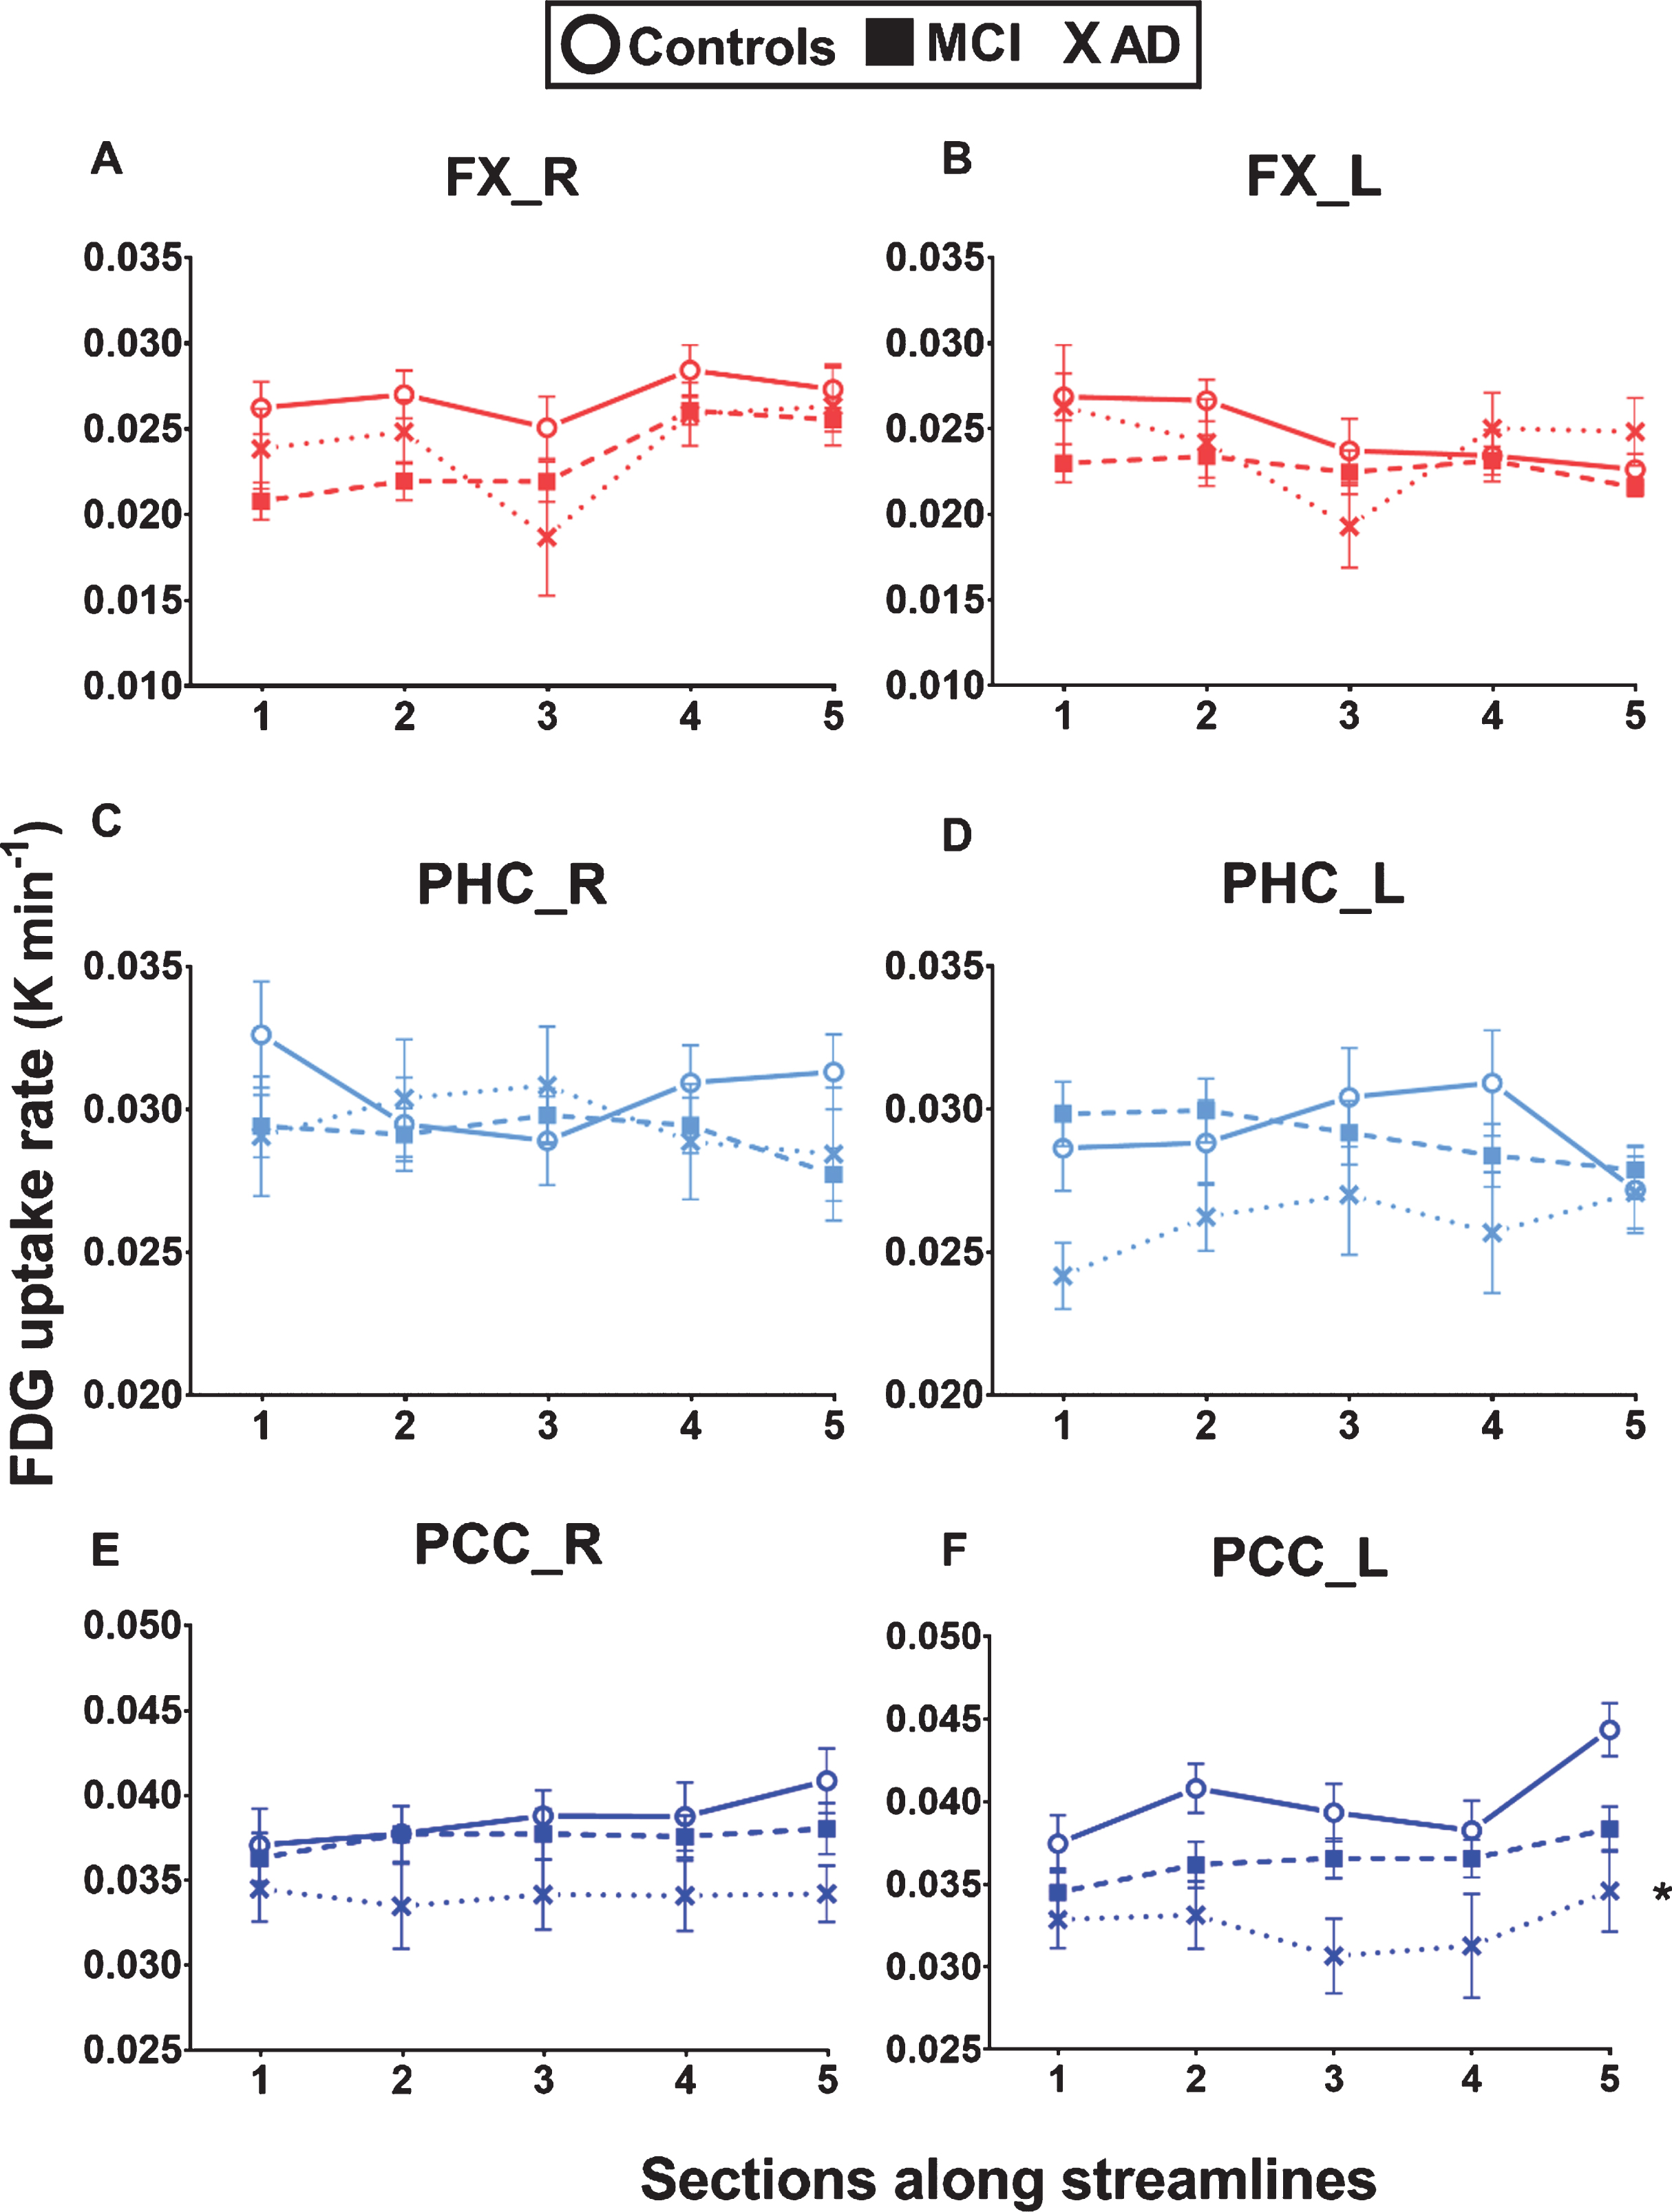
Lower glucose uptake in the left posterior cingulate segment of the cingulum in AD. White matter fascicle profiles (5 sections) of glucose (FDG, 18F-flurodeoxyglucose) uptake rate constant (K; min-1) in the left and right fornix (FX), parahippocampal segment of the cingulum (PHC), and posterior cingulate segment of the cingulum (PCC) in cognitively healthy age-matched controls (Controls; circle), mild cognitive impairment (MCI; square), and Alzheimer’s disease (AD; cross). Lower glucose uptake was observed in the posterior cingulate segments of the cingulum in AD but was significantly lower only in the left segment compared to Controls (*repeated measures – general linear model adjusted for multiple group comparisons = [F (24) = 9.28, p = 0.016]). No significant differences were found between MCI and Controls. Data are presented as mean±SEM.
Fascicle profiles of ketone uptake
In the fascicle profiles, ketone uptake was significantly different across sections for all eight fascicles of interest [p < 0.001 to 0.018] (Fig. 5 and Supplementary Figure 2). There was a significant interaction between ketone uptake across sections and groups for the left fornix [F (296) = 3.28, p = 0.001], right parahippocampal segment of the cingulum [F (300) = 2.41, p = 0.016], and left posterior cingulate segment of the cingulum [F (300) = 2.57, p = 0.010] (Fig. 5). When section 5 of these fascicles was removed from the analyses (section 5 in AD was the most distant from other sections), these significant interactions were lost. Ketone uptake was significantly different between the three groups in section 5 of the left fornix [F (26) = 11.51, p < 0.001] and right parahippocampal segment of the cingulum [F (35) = 4.93, p = 0.013], 26–45% higher in AD compared to Controls, with no significant difference between MCI and Controls. Section 5 streamlines go through the left hippocampus (for the left fornix) and through the right parahippocampal cortex (for the right parahippocampal segment of the cingulum). There was a trend to a significant difference of ketone uptake between the three groups in the right posterior cingulate segment of the cingulum [F (75) = 2.68, p = 0.075].
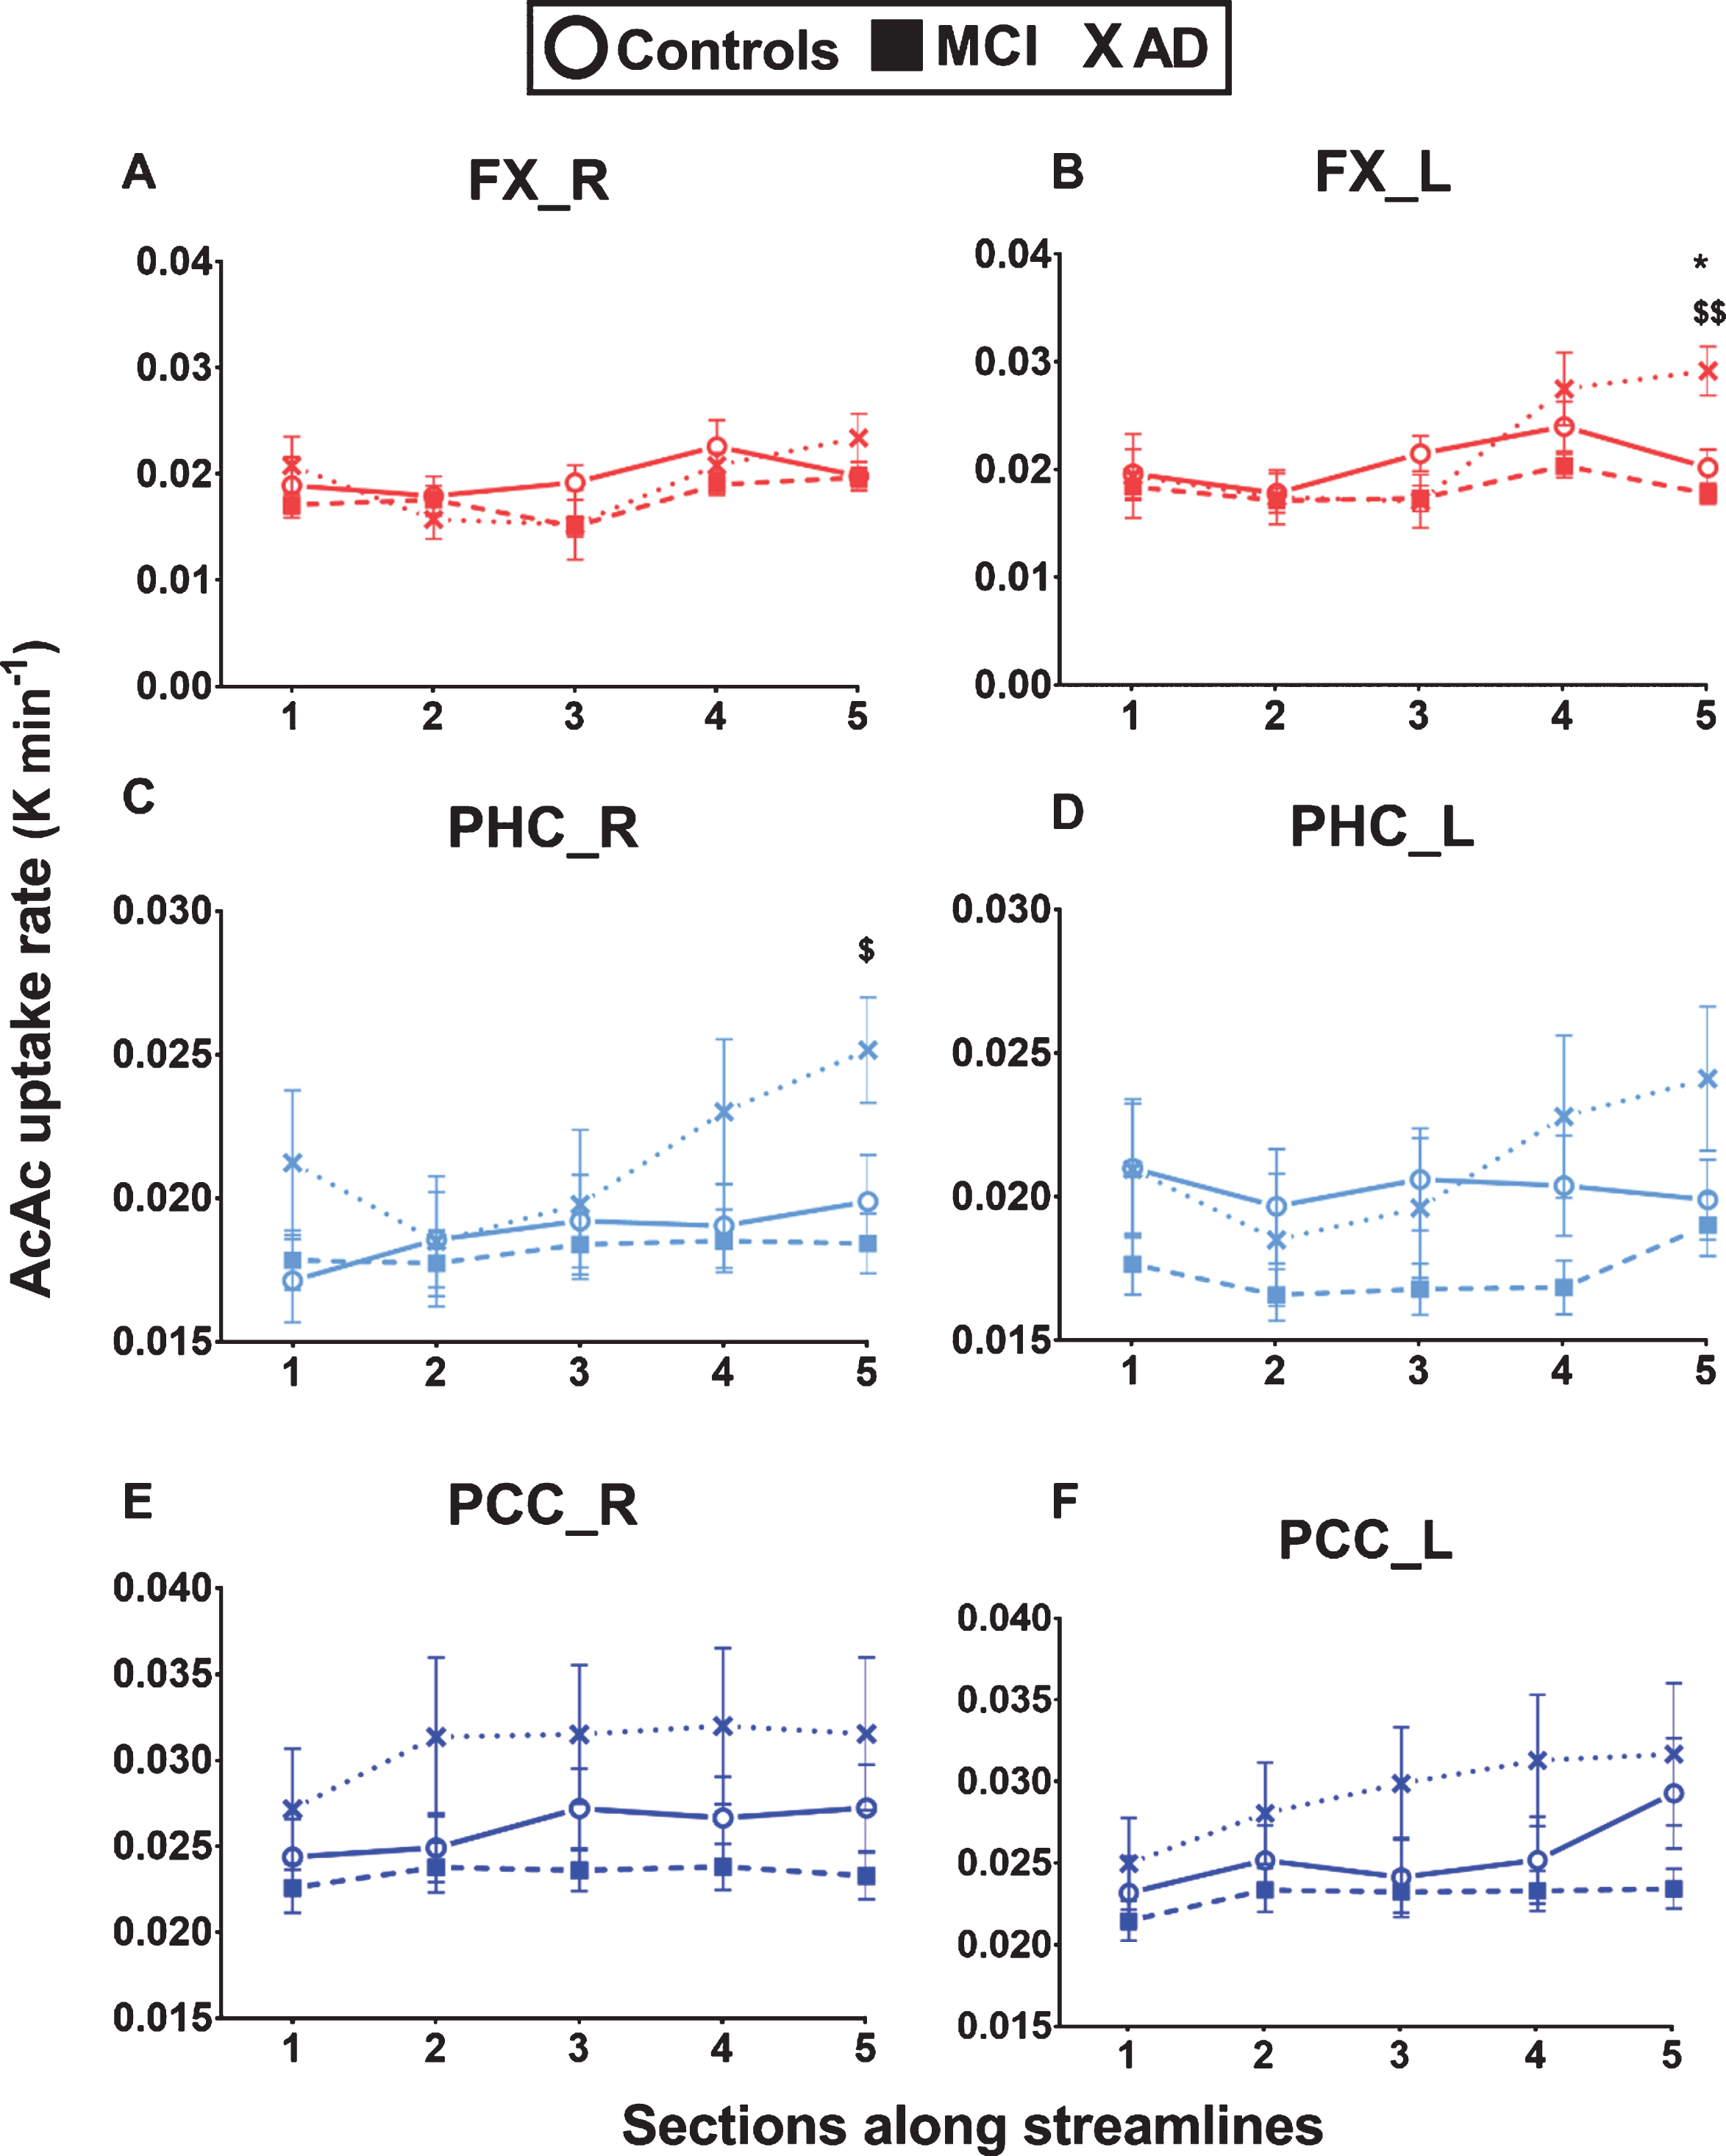
Higher ketone uptake in sections of the fornix and parahippocampal segment of the cingulum in AD. White matter fascicle profiles (5 sections) of ketone (AcAc = 11C-acetoacetate) uptake rate constant (K; min-1) in the left and right fornix (FX), parahippocampal segment of the cingulum (PHC), and posterior cingulate segment of the cingulum (PCC) in cognitively healthy age-matched controls (Controls; circle), mild cognitive impairment (MCI; square), and Alzheimer’s disease (AD; cross). Ketone uptake in section 5 of both the left fornix and right parahippocampal segment of the cingulum was significantly higher in AD compared to MCI and Controls (for section 5: *p < 0.05 between AD and Controls; $p < 0.05; $$p < 0.01 between AD and MCI). A trend to higher ketone uptake in AD in the posterior cingulate segments of the cingulum was not significant. Data are presented as mean±SEM.
Glucose and ketone uptake in endpoints
Glucose uptake in the endpoints was significantly different between the three groups (13–31% lower in AD compared to Controls) for the left posterior cingulate segment of the cingulum [head: F (41) = 3.76, p = 0.031; tail: F (27) = 4.62, p = 0.018], the right fornix [head: F (25) = 5.55, p = 0.010] and the genu of the corpus callosum [head: F (52) = 6.73, p = 0.003] (Fig. 6 and Supplementary Figure 3). Ketone uptake in the endpoints was significantly different between the three groups (32% higher in AD compared to Controls) only in the left fornix [tail: F (26) = 7.20, p = 0.003] (Fig. 6). For most fascicles analyzed, group differences in glucose and ketone uptake in the fascicle endpoint voxels reflected differences along the fascicles. Mean fascicle glucose and ketone uptake in the left posterior cingulate segment of the cingulum was significantly correlated to uptake in its head endpoints [FDG: r = 0.94, p < 0.001; AcAc: r = 0.96, p < 0.001] (data not shown).

Glucose and ketone uptake in fascicle endpoint voxels reflect results along fascicles. Glucose (FDG, 18F-flurodeoxyglucose; A-B) and ketone (AcAc, 11C-acetoacetate; C-D) uptake rate constants (K; min-1) in fascicle streamline endpoint voxels (the cortical terminations of fascicles) of the left and right fornix (FX), parahippocampal segment of the cingulum (PHC), and posterior cingulate segment of the cingulum (PCC) in cognitively healthy age-matched controls (Controls; dark color), mild cognitive impairment (MCI; light color), and Alzheimer’s disease (AD; striped). Colors refer to fascicles in Fig. 1. Data are presented as mean±SEM. Statistical analysis was made using Brown-Forsythe ANOVA test followed by Dunnett’s T3 test for multiple comparisons. *p < 0.05; **p < 0.01 significant difference between AD or MCI and Controls; $p < 0.05 significant difference between AD and MCI.
Fascicle diffusion measures
Free-water-corrected DTI measures are presented as mean fascicle values (Supplementary Figure 4). Only the right hemisphere is presented; similar results were found for the left hemisphere. Fractional anisotropy was significantly lower and mean and radial diffusivities were higher in the fornix and both segments of the cingulum of AD compared to Controls. Fractional anisotropy was also significantly lower and mean and radial diffusivities were higher in the uncinate fasciculus, the genu and splenium of the corpus callosum, inferior fronto-occipital fasciculus, and posterior cingulate segment of the cingulum in MCI compared to Controls.
In the fascicle profiles, the free-water fraction was significantly different across sections for all eight fascicles of interest [p < 0.001 to 0.02] (Fig. 7 and Supplementary Figure 5). There was a significant difference of the free-water fraction between the three groups in the fornix [right: F (75) = 4.42, p = 0.015; left: F (74) = 8.94, p < 0.001], parahippocampal segment of the cingulum [right: F (75) = 4.93, p = 0.009; left: F (75) = 7.02, p = 0.002], and genu of the corpus callosum [F (75) = 4.09, p = 0.021] (Fig. 7 and Supplementary Figure 5). The free-water fraction was 55% higher in the fornix (left section 5) and 135% higher in the parahippocampal segment of the cingulum (left section 5) in AD compared to Controls. For the AD group, when considering the whole fornix, the free-water fraction was significantly negatively correlated with glucose uptake [right: r = –0.65, p = 0.036; left: r = –0.76, p = 0.015] (data not shown).
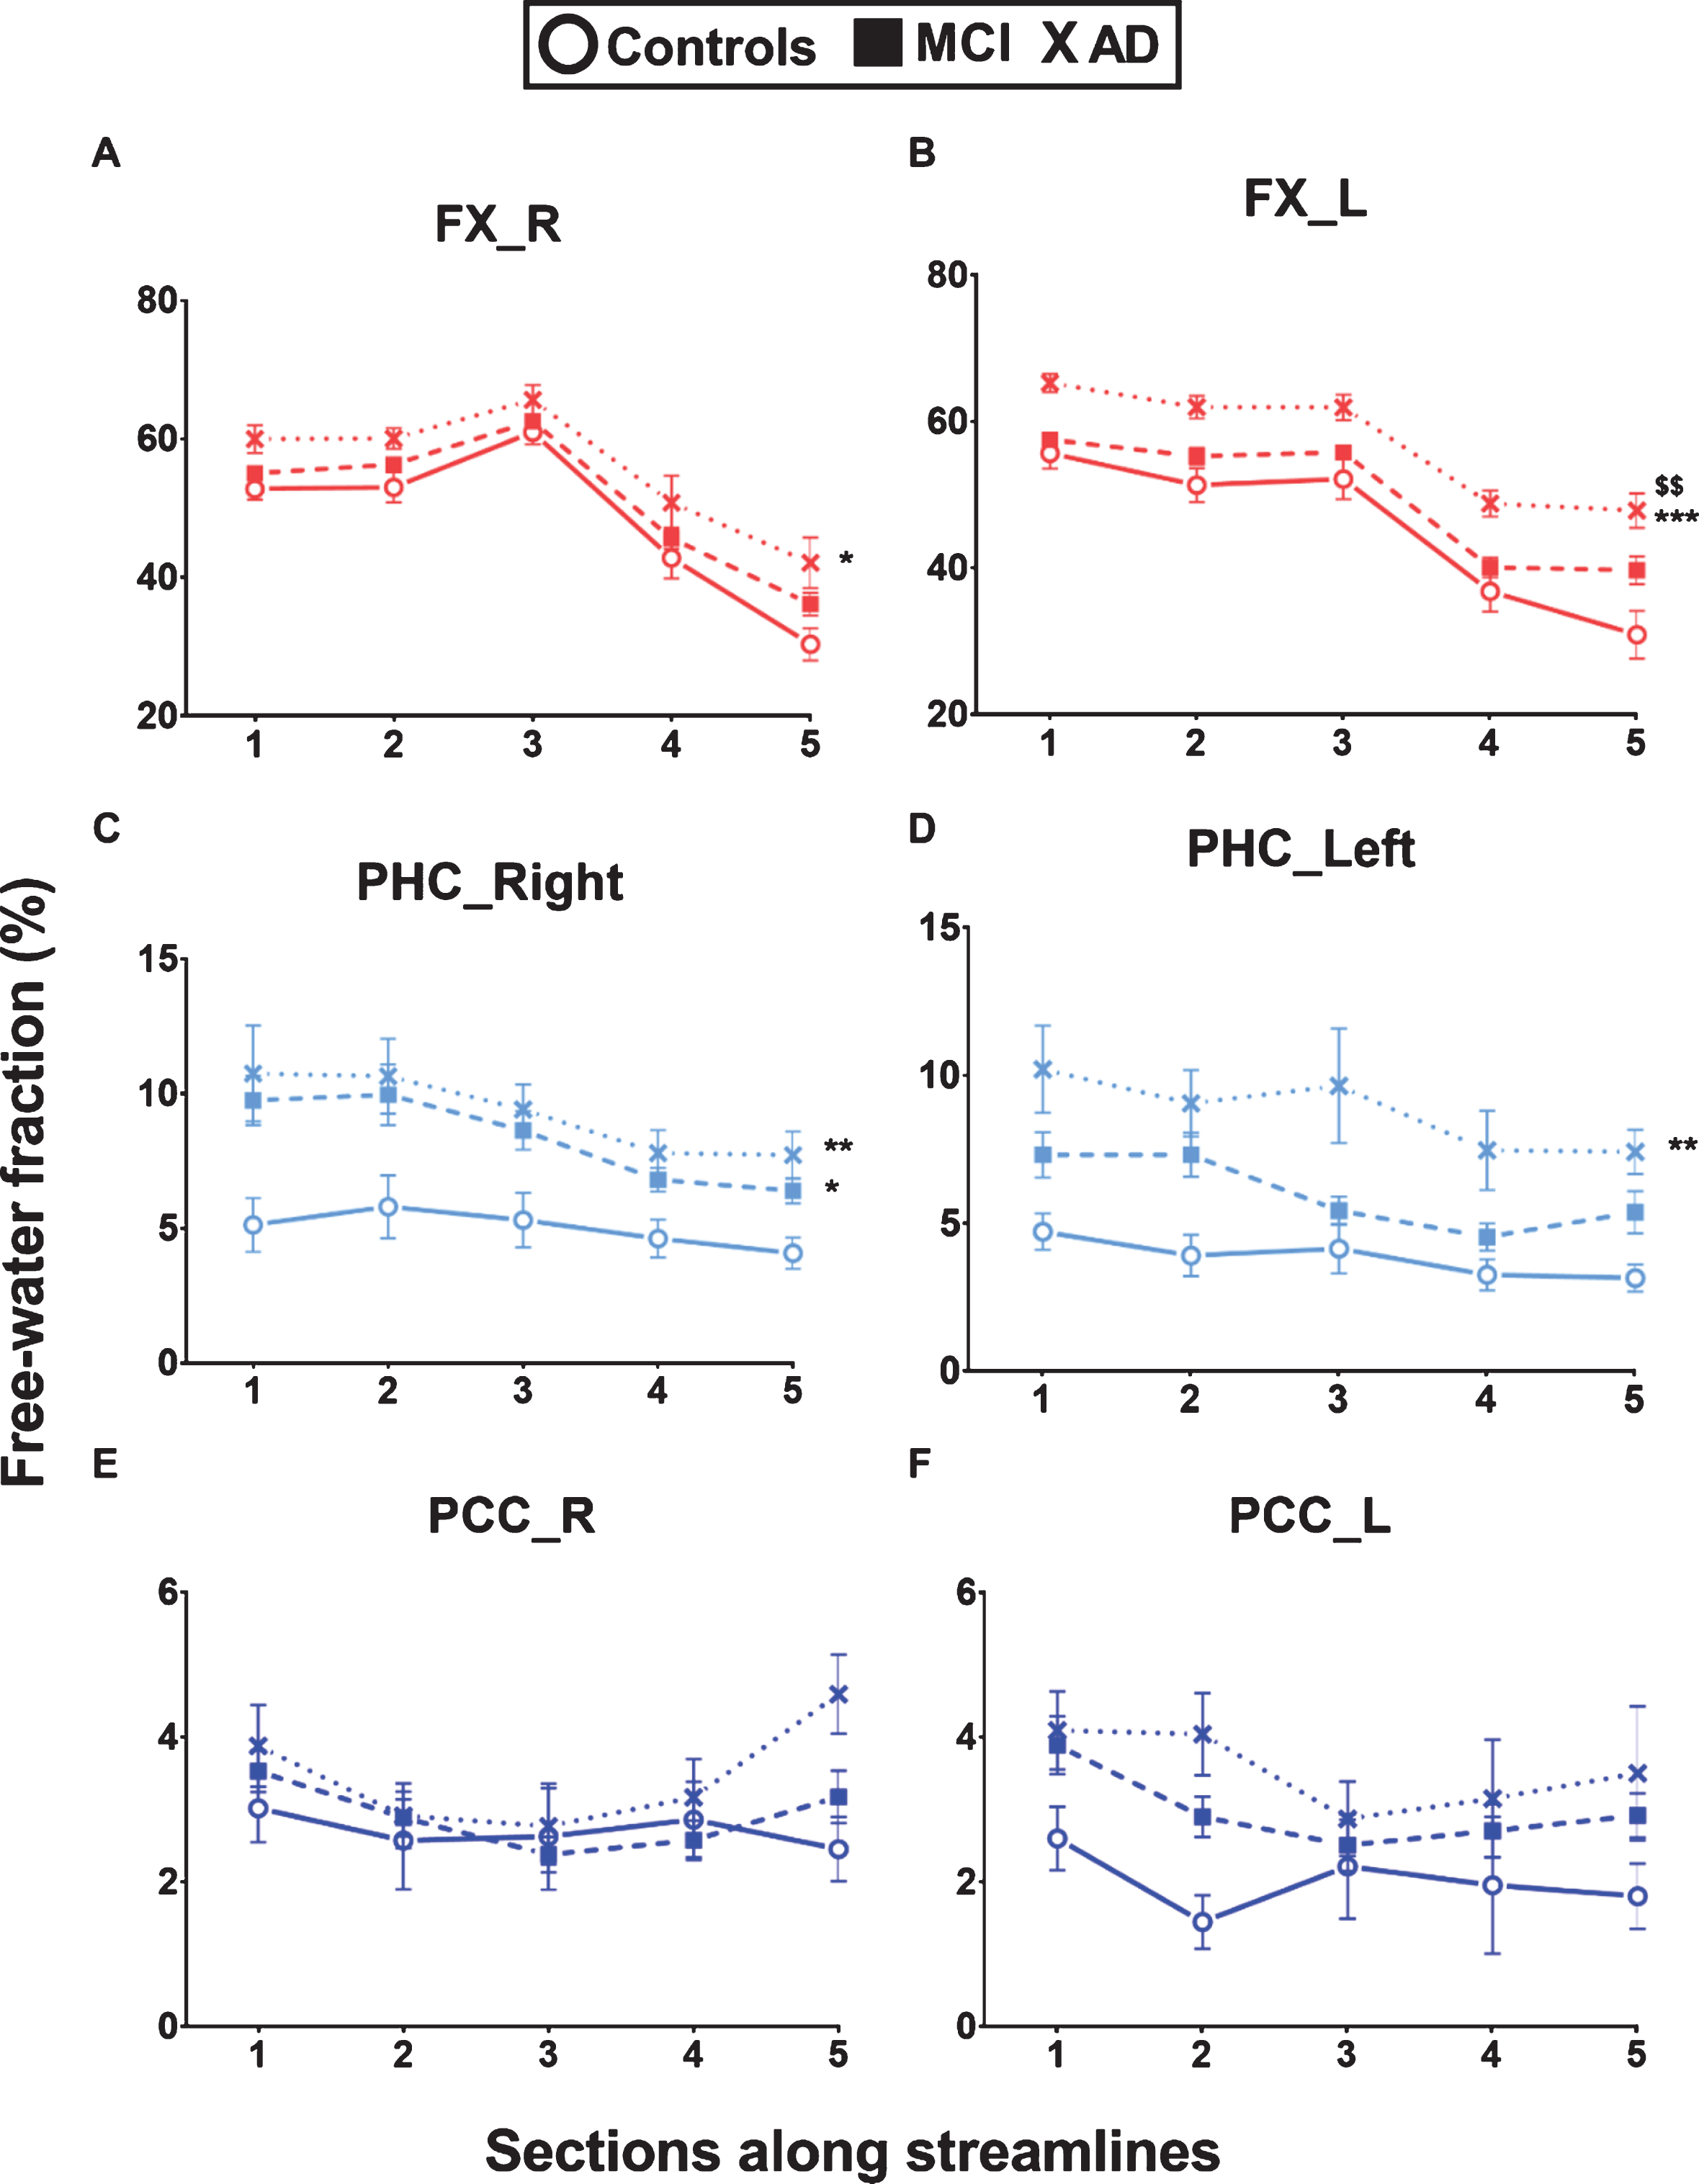
Higher free-water in the fornix and parahippocampal segment of the cingulum in AD. White matter fascicle profiles (5 sections) of the free-water fraction in the left and right fornix (FX), parahippocampal segment of the cingulum (PHC) and posterior cingulate segment of the cingulum (PCC). The free-water fraction was significantly higher in the fornix and parahippocampal segments of the cingulum in Alzheimer’s disease (AD; cross) and mild cognitive impairment (MCI; square) compared to cognitively healthy age-matched controls (Controls; circle). Data are presented as mean±SEM. Repeated measures – general linear model adjusted for multiple group comparisons: *p < 0.05; **p < 0.01; ***p < 0.001 significant difference between AD or MCI and Controls; $$p < 0.01 significant difference between AD and MCI.
After accounting for age, gender, and education, the following significant differences between groups remained: fascicle profiles of the free-water fraction in the fornix [right: p = 0.017; left: p < 0.001] and the parahippocampal segment of the cingulum [right: p = 0.015; left: p = 0.001]; fascicle profiles of glucose uptake in the left posterior cingulate segment of the cingulum [p = 0.015]. For fascicle profiles of ketone uptake, the significant interaction between fascicle sections and groups in the left fornix [p = 0.002] and right parahippocampal segment of the cingulum [p = 0.016] also remained.
DISCUSSION
This combined quantitative PET and diffusion MRI method, robust to WMH and crossing fibers, allows for the first time a section-by-section characterization of energy metabolism in human white matter fascicles. We show that AD presented changes in fuel uptake and diffusion measures mainly in the fornix and posterior segments of the cingulum, both fascicles of the medial temporal lobe. Glucose uptake was lower but ketone uptake remained normal in the posterior cingulate segment of the cingulum, demonstrating the capacity of this fascicle to utilize an alternative fuel to glucose in AD. The fascicle profiling approach demonstrated that ketone uptake was even higher than Controls in some sections of these fascicles in AD, an observation that was not apparent when the fascicles were analyzed as a whole. Higher ketone uptake may suggest a switch of energy fuel to ketones in certain white matter fascicles in AD, possibly to compensate the glucose deficit.
Quantitative FDG-PET, optimized for white matter fascicles, is a helpful tool to assess white matter function and integrity. Total white matter FDG uptake was previously reported to be the same as in sub-cortical regions and cerebellum in older adults (∼ 20μmol/100 g/min; [45]), but very few PET studies in humans have investigated white matter regionally [81, 82], and none quantified the tracer’s uptake rate. Relative uptake of FDG was assessed in WMH [81] and in white matter segmented into four lobes [82] in the context of MCI and AD. In rodent models, glucose metabolism was evaluated in limbic fascicles such as the fornix using FDG-PET [83] and 2-deoxyglucose [84].
Lower glucose uptake in the posterior cingulate segment of the cingulum in AD
Most DTI studies in AD report lower fractional anisotropy and higher mean diffusivity in the posterior cingulum [9, 85–87]. Our present results suggest that decreased glucose uptake in the left posterior cingulate segment of the cingulum in AD (Figs. 4F, and 6) may be linked to this deterioration of DTI measures previously reported. Non-significantly lower glucose uptake in this fascicle was also observed in MCI. Moderate to severe stages of AD may present a more widespread decrease of glucose uptake in the white matter. In all fascicles we analyzed, the left posterior cingulate segment of the cingulum had the highest glucose uptake in Controls, which may make this region more vulnerable to glucose deficiency in the course of AD. The posterior cingulate segment of the cingulum is connected to the posterior cingulate cortex, one of the first gray matter regions with glucose hypometabolism at the onset of AD [45, 88]. For many years now, the ‘diaschisis hypothesis’ of AD was investigated with in vivo imaging studies [46, 89–91]. This hypothesis proposes that a primary disconnection, at the cingulum level, of the posterior cingulate cortex from the medial temporal lobe contributes to posterior cingulate cortex hypometabolism during the course of AD. This cingulum disruption could originate from unmet energy needs of the axonal and oligodendrocyte compartments, leading to myelin catabolism [92], in agreement with the ‘retrogenesis model’ of AD. The cingulum disruption may also be due in part to Wallerian degeneration originating from cortical atrophy [18].
White matter energy needs
Since axons have limited glycolytic capacity, oligodendrocytes metabolize glucose and supply lactate for axonal energy requirements [93], which supports intra-axonal mitochondrial production of ATP [94]. White matter FDG uptake could thus mostly represent oligodendrocyte metabolic activity, while gray matter FDG uptake is considered a marker of synaptic activity. A new finding is the axo-myelinic synapse, in which axon-myelin communication occurs via glutamate, but which also requires more glucose to be processed by the oligodendrocyte [94]. This contributes to a relatively high energy requirement of oligodendrocytes [95] and may make them more vulnerable to insults such as hypoperfusion and nutrient or energy deficiencies [21, 96]. Indeed, healthy aging reportedly involves decreased glial but not neurite density in the fornix [97]. This brain glucose deficit underlies the ‘myelin model’ of AD in which myelin sheath disruption is an early change, particularly in regions containing vulnerable late-differentiating oligodendrocytes [21]. Myelin breakdown then disrupts impulse transmission, which functionally ‘disconnects’ cortical regions, eventually followed by neuronal loss and progressive cognitive deficits.
Higher ketone uptake in sections of white matter fascicles in AD
Perhaps our most novel observation is that white matter fascicles showed no reduction of ketone uptake in AD (Fig. 5), which is similar to what has been reported for gray matter [45, 51]. The ketone uptake rate (K) in white matter fascicles (0.017 to 0.032 min–1) is similar to that in gray matter (0.018 to 0.035 min–1) in Controls, MCI, and AD [45]. Fascicle profiling showed that ketone uptake was actually higher in some fascicle sections in AD compared to MCI and Controls (Fig. 5), specifically in section 5 of the fornix and parahippocampal segment of the cingulum. These two sections are anatomically adjacent and end in the hippocampus and parahippocampal cortex, respectively. Interestingly, these limbic and paralimbic structures have the highest baseline level of plasticity in the brain [98]. Higher ketone uptake in these fascicles could be explained by functionally intact or upregulated monocarboxylate transporters capable of providing more ketones to white matter in a context of chronic glucose deprivation such as AD. Indeed, in a rodent model, aging was characterized by an increased catabolism of myelin to produce ketones in response to chronic brain cell glucose deprivation [92].
Changes of diffusion measures in MCI and AD
Our results of free-water-corrected DTI measures (Supplementary Figure 4) confirm lower fractional anisotropy and higher mean and radial diffusivities in AD as extensively reported in the literature [9, 32]. Increased mean and radial diffusivities are suggestive of myelin breakdown [99]. AD has been associated with higher axial diffusivity [18] but classical DTI used in that study may be biased by the increased isotropic compartment (free-water) in AD. Once corrected for free-water, axial diffusivity is lower in AD, as reported in the present study and elsewhere [70] and in agreement with axonal damage repercussions on diffusion properties [100].
The free-water fraction was about 46% in the fornix of Controls, which is much higher than the other fascicles of interest that had free-water fractions of 4–10% (data not shown). The fornix lies close to CSF in the ventricles and interhemispheric fissure, so its high free-water fraction may in part represent CSF signal intensity contamination [30, 62]. Ventricular expansion associated with aging probably exacerbates this CSF contamination [101]. Elevated free-water fraction in the fornix may also represent increased extracellular isotropic water due to fornix atrophy in elderly. Indeed, very early structural changes occur in the fornix of cognitively healthy elderly such as a decrease of the total fornix volume and glial cells content [97, 102].
The free-water fraction was higher in the fornix and parahippocampal segment of the cingulum in MCI and AD (Fig. 7). It was recently shown that the elevated total white matter free-water fraction can differentiate MCI and AD from controls [34]. This elevated free-water fraction may simply be due to myelin and axonal loss. The parahippocampal cingulum fascicle links the medial temporal lobe to the posterior default mode network, a network that undergoes functional disconnection early in AD [103–106]. On the other hand, microglia and immune cells mediating neuroinflammation are expected to affect the extracellular space and to increase its water content [107, 108]. The pathology of AD is reported with microglial activation and inflammation specifically in white matter [109, 110]. In the present study, elevated free-water fraction was associated with low glucose uptake in the fornix of AD. A clinical study in mild AD using a PET ligand specific to microglia activation showed increased binding in the entorhinal, temporoparietal, and posterior cingulate cortices [111], regions presenting decreased glucose uptake. Combined with glucose hypometabolism, prolonged inflammation in white matter tissue may lead to axonal degeneration.
Limitations and future directions
A diffusion MRI acquisition voxel is about 2 to 15 mm3, which can contain a large number of individual axons and potentially many distinct fiber populations. In addition to axons, white matter voxels may also contain various glial cells, i.e., astrocytes, microglia, and oligodendrocytes [112–114]. Therefore, we cannot identify which cell types were associated with the differences in diffusion measures and energy usage observed in AD. MR spectroscopy would be necessary to have a more precise idea of the proportion of these cell types [113].
In order to correct for spillover from high to adjacent low-uptake regions, partial volume correction is routinely used in FDG-PET studies. An alternative to the Muller-Gartner method to correct for the spill-out of activity from high-uptake structures (i.e., gray matter such as the cingulate cortex) into low-uptake structures (i.e., white matter such as the posterior cingulum) could be a voxel-based algorithm [115], based on MRI segmentation of our white matter fascicles. Whether the latter method is more appropriate to quantify FDG uptake in specific white matter fascicles remains to be determined.
Apolipoprotein E (ApoE) status from our participants was not available and therefore the proportion of ApoE4 carriers in every groups could not be included as a covariable in statistical analyses. This may have affected our results if carriers were not equally distributed across groups. Indeed, ApoE4 carriers display significantly higher radial diffusivity in white matter regions [116] and a more widespread neurite density reduction in AD [117].
Fluid-attenuated inversion recovery (FLAIR) or T2-weighted images were not acquired for our participants and WMH could not be segmented reliably. Thus, WMH volumes could not be included as a covariable in our analyses. Although WMH were eliminated from white matter masks used for tractography, WMH regional burden may have affected our measures and results, such as FDG uptake, if WMH distribution was not similar across groups. Indeed, WMH are often found in the periventricular region, nearby the fornix for instance, analyzed in the present study. In future studies, including FLAIR images will be important. Then, an algorithm must be used for automatic detection and segmentation of WMH [118].
We analyzed fascicles from the limbic lobe [52] and major fascicles connecting to the medial temporal lobe. Hence, we do not yet know the extent to which lower glucose uptake in AD is present in other fascicles. In future studies, we could extend our fascicle analysis to the anterior cingulum, arcuate fasciculus and corticospinal tract, as previously studied in AD [28, 29], or use the whole-brain fixel-based approach, where ‘fixel’ refers to a specific fiber population in a voxel [29].
All main outcomes were analyzed using fascicle profiling [79, 119], in which each fascicle was divided into five sections thereby permitting separation of the head and tail sections (1 and 5), and intermediate sections (2, 3, and 4). However, some fascicles such as the inferior fronto-occipital fasciculus are longer (up to 190 mm) than others such as the parahippocampal cingulum and number of sections should be adjusted according to the fascicle length. More advanced fascicle profiling statistics exist, such as principal component analysis [120] and functional data analysis [121, 122], which could turn out to be more sensitive and provide further interpretation to our data.
Raising ketone availability to the brain is a therapeutic strategy that at least partially bypasses the brain energy (glucose) deficit in MCI and AD. Indeed, promising results were published recently involving ketogenic interventions that improve cognition in AD [123–125] and MCI [126]. This may imply that at least a proportion of brain cells are energy (glucose)-starved but not dead yet. Whether a ketogenic intervention in AD improves cognitive outcomes by overcoming glucose deficiency in white matter thereby delaying dysfunction and atrophy of white matter fascicles needs to be further investigated. Providing exogenous ketones to the brain may also reduce neuroinflammation surrounding white matter fascicles [127], thereby conserving more glucose for brain function per se. The investigation of the metabolic integrity of white matter fascicles has potential relevance to other neurological diseases in which white matter is affected such as Parkinson’s disease [127] and multiple sclerosis [128, 129].
Conclusion
Glucose and ketone utilization by white matter can be quantified with a dual-tracer PET method combined with fascicle-specific diffusion MRI in relation to the development of AD. White matter metabolic deterioration in AD appears to be specific to glucose, does not involve ketones, and is limited to certain fascicles such as the posterior cingulate segment of the cingulum. Inclusion of white matter fascicle structure and energy metabolism in future models of AD pathological cascade might be of interest, as Sachdev et al. [130] proposed for white matter structure. Whether glucose deficiency in white matter fascicles can be bypassed with a ketogenic intervention to reduce myelin catabolism, axonal dysfunction, and cognitive decline in AD can be investigated with the present method.
Footnotes
ACKNOWLEDGMENTS
We wish to thank Félix Morency, Sébastien, Tremblay, Marie-Christine Morin, Christine Brodeur-Dubreuil, the PET and MRI clinical teams at the Sherbrooke Molecular Imaging Center for technical assistance, Guillaume Theaud, Jasmeen Sidhu and the Sherbrooke Connectivity Imaging Lab team for their help on data processing and Lise Trottier and Frédéric Laberge for providing help on the statistical analyses.
We are grateful to Mathematics of Information Technology and Complex Systems (Mitacs) and Université de Sherbrooke Institutional Chair in Neuroinformatics for their funding support. CIHR, CRC, FRQS, and CFI also provided funding.