
Abstract
Alzheimer’s disease (AD) is the most common neurodegenerative disease and is characterized by preclinical, pre-dementia, and dementia phases. Progression of the disease leads to cognitive decline and is associated with loss of functional independence, personality changes, and behavioral disturbances. Current guidelines for AD diagnosis include the use of neuroimaging tools as biomarkers for identifying and monitoring pathological changes. Various imaging modalities, namely magnetic resonance imaging (MRI), fluorodeoxyglucose-positron emission tomography (FDG-PET) and PET with amyloid-beta tracers are available to facilitate early accurate diagnoses. Enhancing diagnosis in the early stages of the disease can allow for timely interventions that can delay progression of the disease. This paper will discuss the characteristic findings associated with each of the imaging tools for patients with AD, with a focus on FDG-PET due to its established accuracy in assisting with the differential diagnosis of dementia and discussion of other methods including MRI. Diagnostically-relevant features to aid clinicians in making a differential diagnosis will also be pointed out and multimodal imaging will be reviewed. We also discuss the role of quantification software in interpretation of brain imaging. Lastly, to guide evaluation of patients presenting with cognitive deficits, an algorithm for optimal integration of these imaging tools will be shared. Molecular imaging modalities used in dementia evaluations hold promise toward identifying AD-related pathology before symptoms are fully in evidence. The work describes state of the art functional and molecular imaging methods for AD. It will also overview a clinically applicable quantitative method for reproducible assessments of such scans in the early identification of AD.
INTRODUCTION
Dementia is a global problem, impacting over 46.8 million individuals worldwide and contributing to diminished quality of life, caregiver stress, and considerable financial burden [1]. Alzheimer’s disease (AD), the most common neurodegenerative dementia, accounts for 35 million cases and poses a significant dilemma clinically, financially, and for the public health sector [2, 3]. The incidence of AD continues to rise with population aging and advances in technology and medicine. Moreover, AD and other dementias are considered the major instigators of disability and institutionalization in the future since they compromise one’s ability to function independently [4, 5]. AD is influenced by numerous genetic, vascular, and psychosocial risk factors. The histopathologic hallmarks of AD are amyloid-β (Aβ) plaques and neurofibrillary tangles of hyperphosphorylated tau [6, 7]. Other factors including mitochondrial dysfunction, oxidative stress, pro-inflammatory responses, environmental features, and apoptosis in brain regions responsible for memory and cognition are thought to have a role in the pathogenesis of AD, and may lead to synaptic dysfunction and neuronal cell loss [8–10].
The newly revised Diagnostic and Statistical Manual of Mental Disorders (DSM) V distinguishes between major and mild neurocognitive disorder due to AD by identifying whether gradual significant cognitive decline interfering with independence in daily activities or non-disruptive, modest impairment in one or more cognitive domains (complex attention, executive function, learning and memory, language, perceptual-motor, or social cognition) is present [11]. At the same time, recent research acknowledges that the disease may take time to advance with amyloid deposition being possible to detect with imaging with estimates ranging from 15 to as early as 20 to 30 years prior to symptomatic AD [12–14]. Thus, recent revised criteria for the diagnosis of AD include accounting for a potential preclinical stage in which pathology may be present without overt symptoms [15]. Evidence of an AD genetic mutation warrants suspicion for probable AD for both categories, while evidence of decline in memory and learning, lack of mixed etiology, and progressive, gradual cognitive decline without extended plateaus warrants a diagnosis of probable AD for major neurocognitive disorder versus possible AD for mild neurocognitive disorder [16]. However, multiple neurodegenerative diseases may cause or contribute to dementia, which poses a diagnostic challenge as they share histopathological features and often clinically manifest in similar ways [17]. Moreover, co-occurrence of AD with dementia with Lewy bodies (DLB) or frontotemporal dementia (FTD) is common [18, 19]. The lack of a high level of agreement between clinical and neuropathological diagnosis and high incidence of neuropathological comorbidities suggests the need for tools that improve diagnostic accuracy [20].
The need for enhanced diagnostic certainty and better understanding of disease pathophysiology led the National Institute on Aging and the Alzheimer’s Association (NIA-AA) to redefine the 1984 criteria for AD diagnosis, by incorporating biomarkers during various phases (asymptomatic and preclinical, symptomatic or pre-dementia, and dementia caused by AD) along a continuous spectrum of AD [15, 22]. The biomarkers include low cerebrospinal fluid (CSF) Aβ and increased amyloid tracer retention on positron emission tomography (PET) (amyloid biomarkers) as well as biomarkers of neuronal injury which include elevated CSF tau, brain atrophy on magnetic resonance imaging (MRI), and hypometabolism as indicated by decreased fluorodeoxyglucose (FDG) uptake on PET. The recommendations for preclinical AD are for research purposes, while the diagnostic guidelines for the other two stages are considered appropriate for clinical use. By providing information about the underlying pathology and detecting structural or functional patterns that are consistent with cognitive dysfunction, biomarkers serve important functions for evaluating disease progression in patients with mild cognitive impairment (MCI) patients in the prodromal stage [23, 24]. An estimated 10–15% of MCI patients, who display greater cognitive deficits than considered normal for their age and education level, progress to dementia within a year after initial diagnosis [25, 26]. The development of additional criteria integrating the growing array of diagnostic data points for AD has been summarized by Dubois and colleagues [27]. In that work, the suggested criteria relied upon a specific phenotype as the foundational criterion such as amnestic syndrome or progressive change in memory function over 6 months. Overlaid onto that standard is biomarker evidence of AD such as decreased CSF Aβ1–42 or increased tau or phosphorylated tau as well as genetic evidence of autosomal dominant AD. Neuroimaging biomarkers, especially if integrated among them, have the potential to allow an early diagnosis of specific neurodegenerative diseases, and then to identify patients that will progress to a dementia state.
Clinically, the emphasis is increasingly on earlier stages of the disease, stressing the importance of highly sensitive clinical diagnostic imaging modalities. In this review, the utility of the structural, functional, and molecular imaging techniques and relative strengths and limitations of these modalities will be discussed to allow for relative comparisons of diagnostic accuracy and effectiveness at tracking disease progression. The biomarkers’ potential for differential diagnosis will also be evaluated since overlapping clinical phenotypes can hinder accurate diagnoses. A discussion of quantification tools that can enhance visual analysis and a diagnostic algorithm that optimally integrates the imaging tools will be shared to guide decision making and help enhance patient management by healthcare professionals.
FDG-PET
FDG-PET is a highly sensitive technique used to evaluate brain metabolism that positively contributes to AD diagnosis. Numerous studies of clinically identified AD patients have demonstrated a characteristic AD pattern, namely bilateral hypometabolism in posterior cingulate cortex and parietotemporal cortex, that correspond to postmortem AD pathologic diagnosis [28, 29]. As such, it is thought to represent the “N” portion of the ATN framework. In the largest study with autopsy-confirmed diagnoses, detection of progressive dementia with PET had a sensitivity of 94% and specificity of 73% [30, 31]. In a follow-up analyses for patients studied with contemporary PET scanners, specificity was shown to be almost as high as sensitivity (87%) for predicting which patients would progress to dementia [32]. Hypometabolism is first seen in the posterior cingulate cortex in prodromal AD, followed by the parietotemporal cortex [30]. FDG-PET is useful for tracking changes in the disease process since metabolic deficits worsen with progression of the disease [23]. Decline in FDG uptake tends to precede and parallel declining cognitive abilities [24]. FDG-PET also has prognostic value as it can be used to predict which MCI individuals will progress to dementia [33, 34]. Additionally, FDG-PET in early-onset AD compared to late-onset AD demonstrates decreased glucose uptake in left parietal lobe (Brodmann Areas 7, 31, and 40) [35]. In turn, this could allow for intervention with pharmacological agents that can halt progression of the disease. Moreover, FDG-PET has been used to accurately predict rate of subsequent cognitive and functional decline in individuals who go on to develop AD [34, 36]. FDG-PET is also particularly useful for improving diagnostic accuracy of highly intelligent individuals as they may perform well on clinical assessments but still have notable hypometabolism, indicative of impending dementia [37, 38]. Detection of the disease process in the early stages is optimal for effectively guiding management of the disease, initiating appropriate palliative and psychosocial care, and providing time for patients to tend to the personal, financial, and legal consequences of the disease [38].
FDG-PET can also be used to differentiate AD patients from those with vascular dementia, who often present with clinically similar symptoms and who receive diagnoses that are discrepant from pathological reports. Early accurate diagnosis is important as it will allow for appropriate management of the risk factors contributing to the disease. Hypometabolism in cortical, subcortical, and cerebellar areas are characteristic of vascular dementia [32].
FDG-PET is also useful for differential diagnosis as different neurodegenerative dementias have specific patterns of FDG hypometabolism that precede the onset of clinical symptoms [39]. DLB, characterized by neuropsychiatric disturbances and deficits in arousal and attention, tends to present with hypometabolism in the occipital cortex [31]. Using postmortem validation, FDG-PET distinguished DLB from AD with a sensitivity of 90%, higher than that obtained with clinical diagnostic criteria, and specificity of 80% [31, 40]. Similarly, FDG-PET can be used to differentiate between AD and FTD, which is clinically sometimes marked by behavioral and language-predominant changes. Hypometabolism in the frontal lobes, sparing the motor cortex, caudate nuclei, insula, and thalamus bilaterally, more accurately predicts histopathologic diagnosis of FTD documented by postmortem examination [41, 42]. The pooled differential diagnostic performance for classification of AD versus other types of neurodegenerative dementias yield an accuracy of 85% with sensitivity of 87% and specificity of 81% [31]. Figures 1 and 2 demonstrate the characteristic patterns of metabolic reductions in subjects diagnosed with DLB and FTD, respectively.
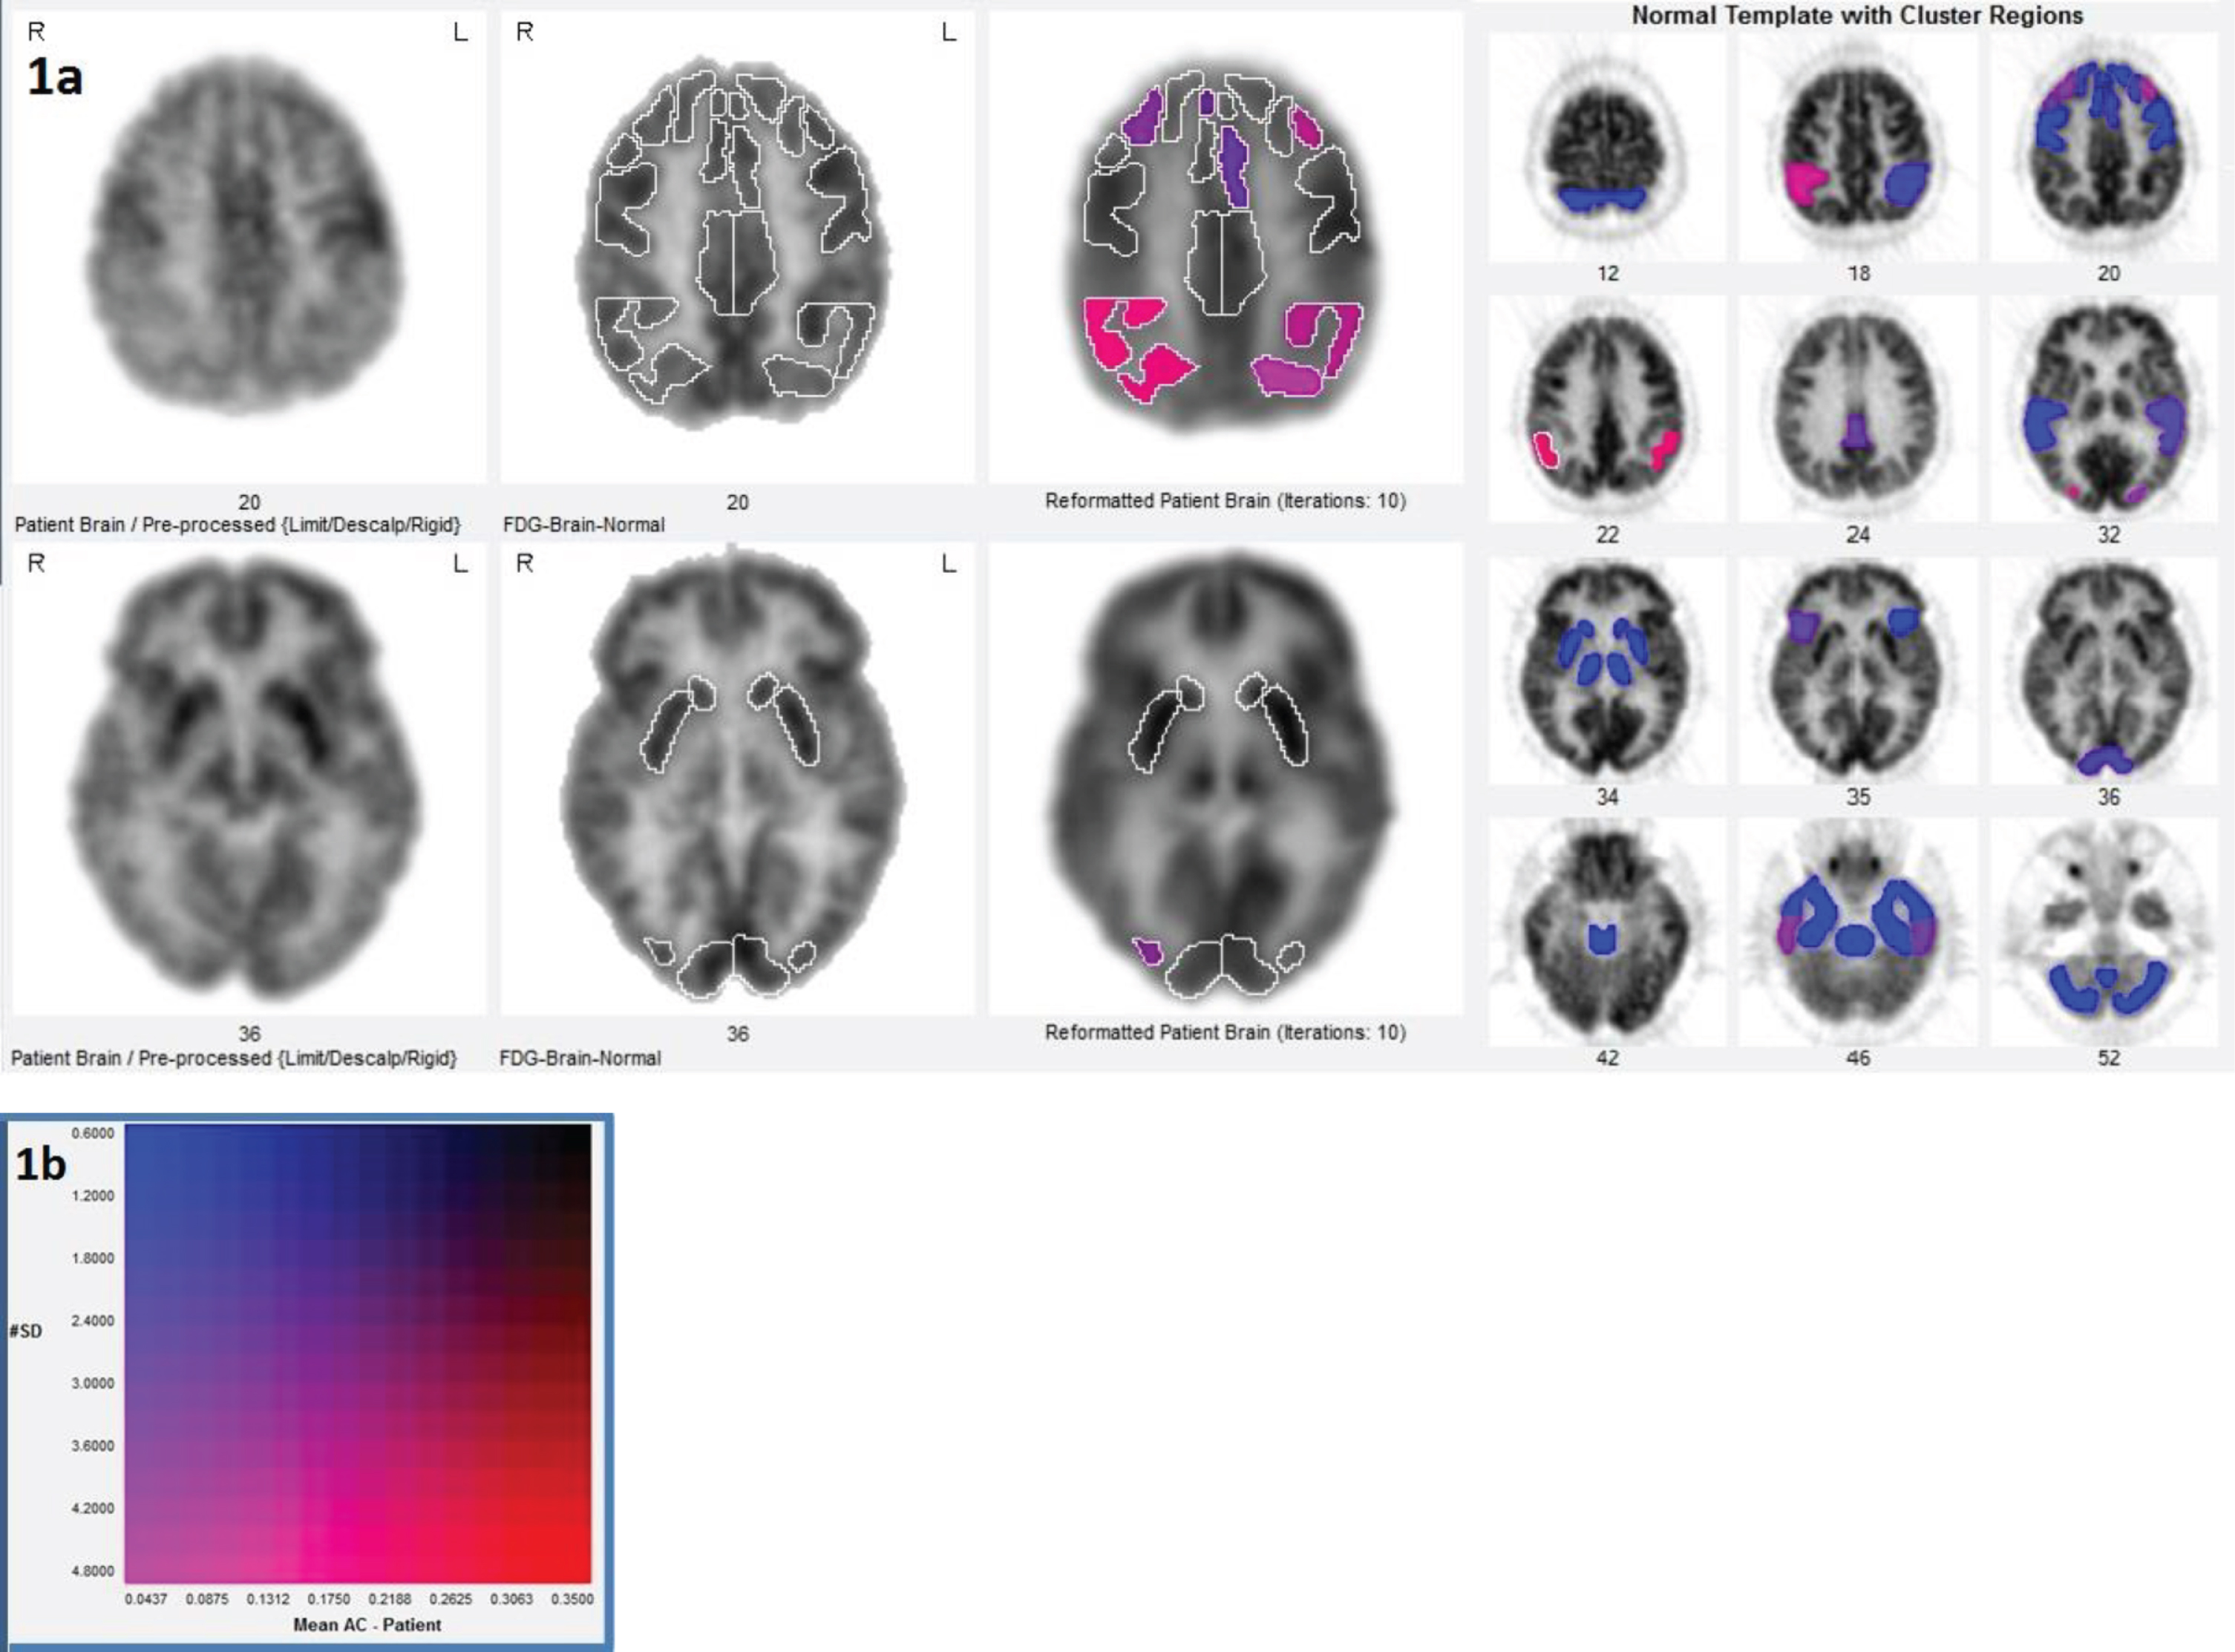
A brain FDG-PET of a 66-year-old man scan demonstrates moderate to severe parietotemporal and associative visual hypometabolism, and milder frontal and posterior temporal hypometabolism, with relative preservation of sensorimotor and posterior cingulate cortex. This pattern of cortical hypometabolism is typical for dementia with Lewy bodies. a) Two-dimensional color scale captures the magnitude and number of standard deviations from normal mean for each region and volume of interest (b).
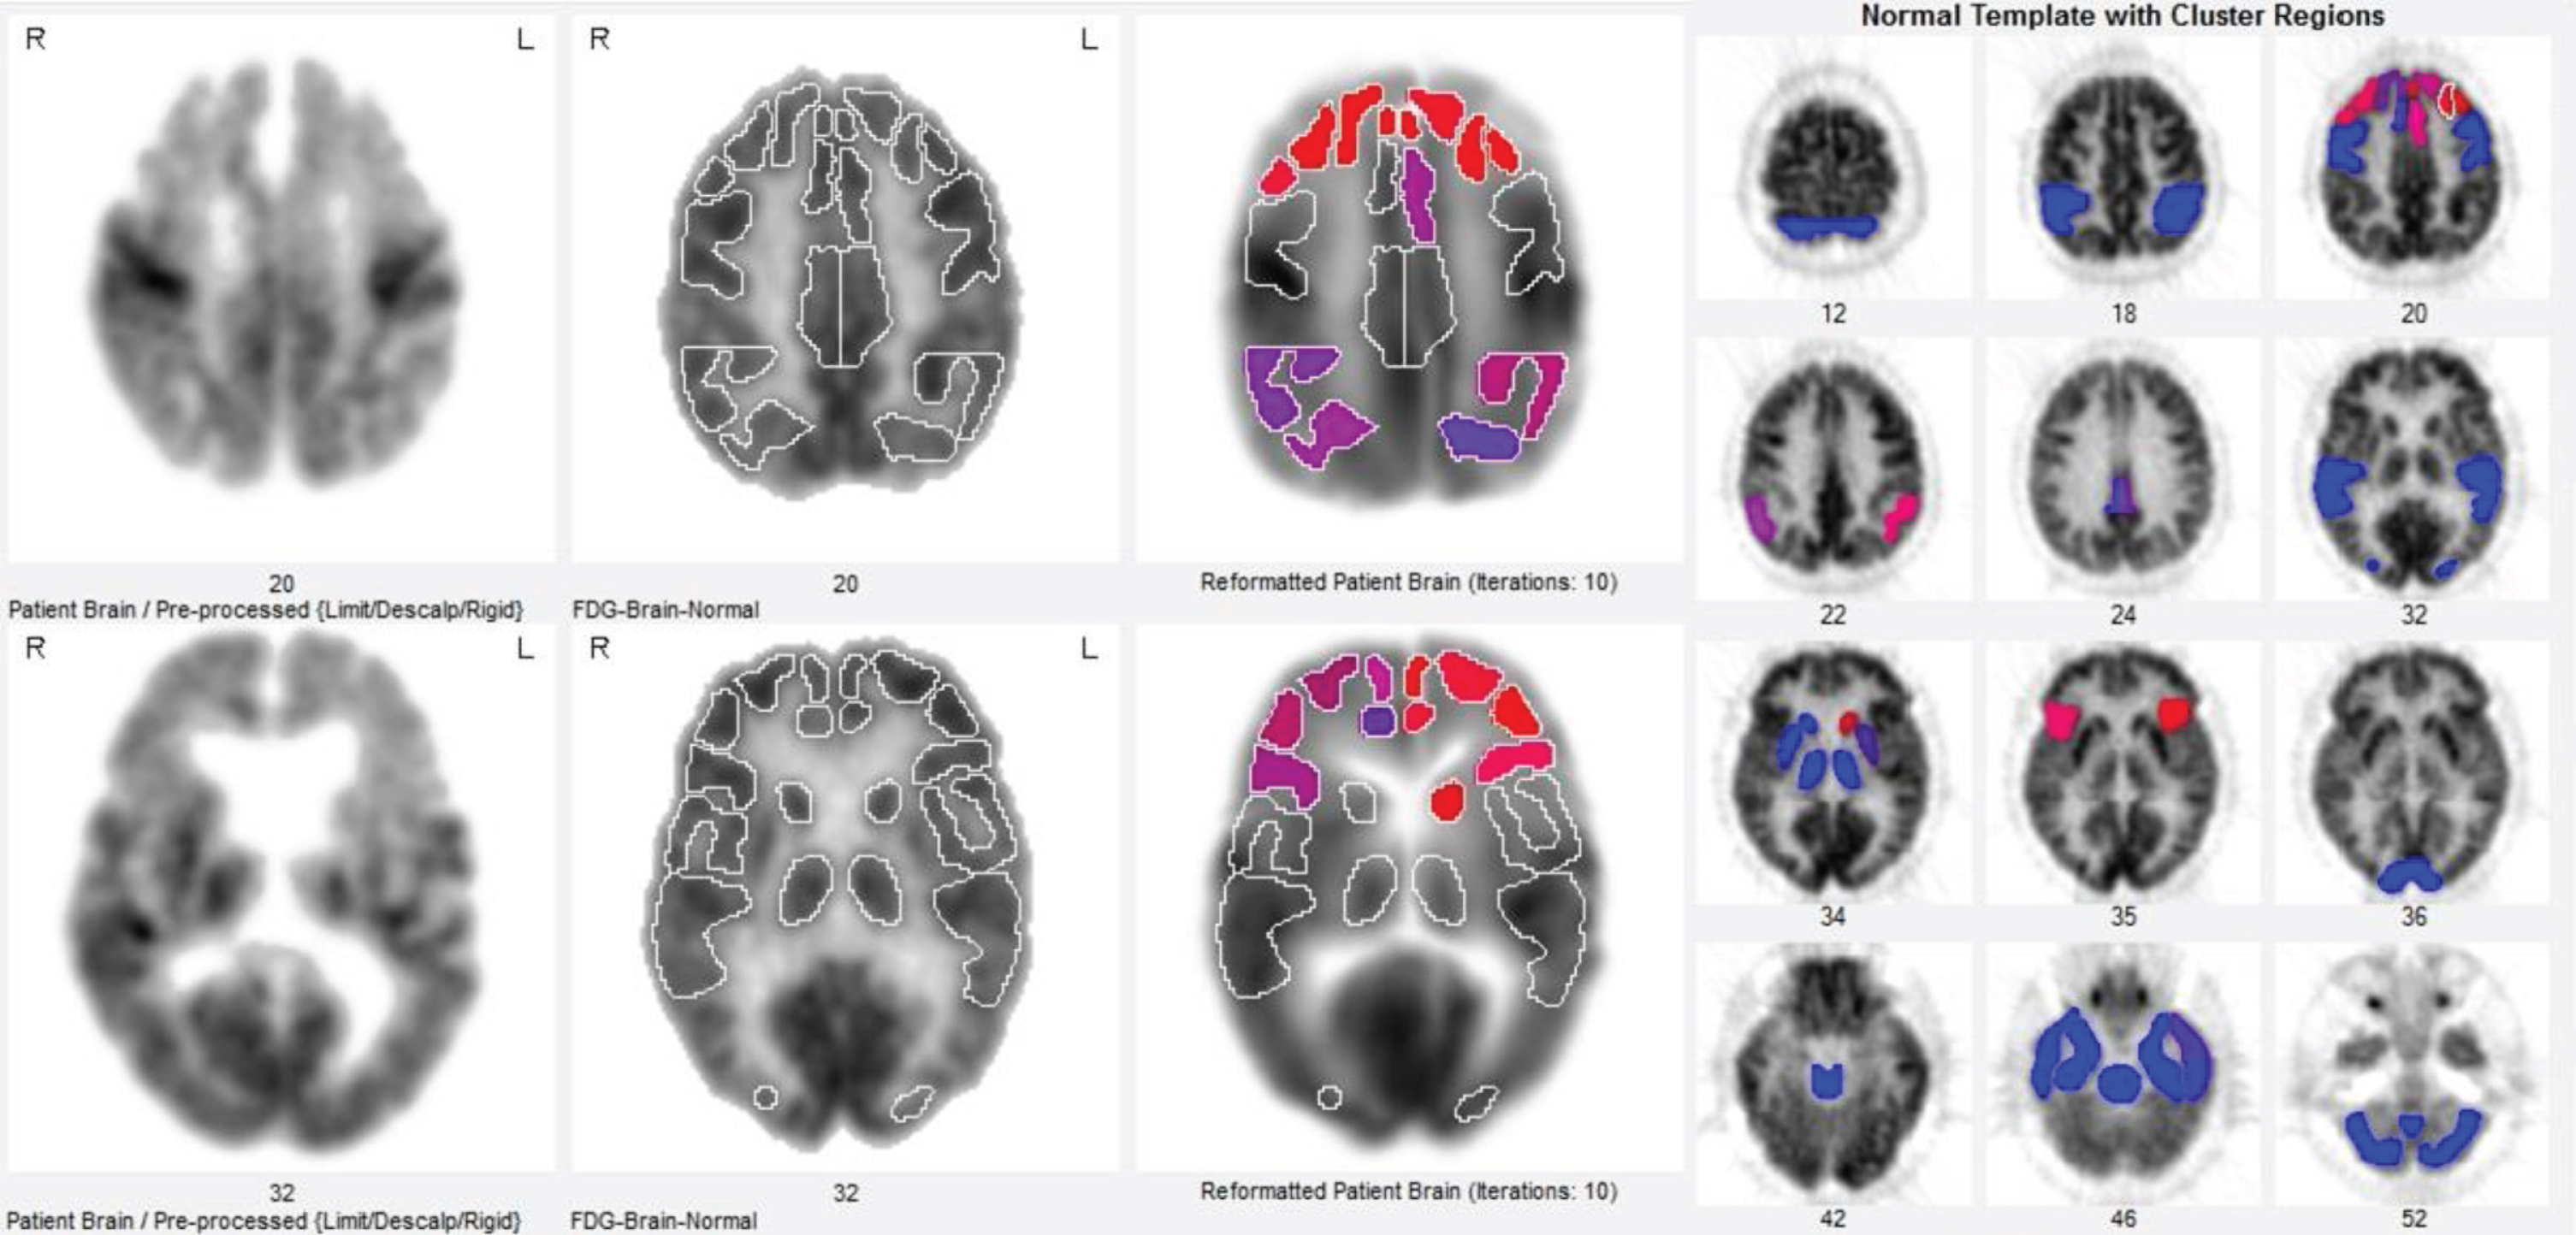
An 81-year-old man with brain FDG-PET scan displaying extensive bilateral frontal hypometabolism, milder temporal-parietal hypometabolism, and relatively well preserved sensorimotor and thalamic structures. This pattern of frontal-predominant severe hypometabolism is consistent with frontotemporal dementia.
AMYLOID-PET
Aβ deposition is thought to be an early event in the AD pathologic process. Aβ, derived from amyloid-β protein precursor, aggregates extracellularly into plaques of insoluble fibrils and soluble oligomers. Aβ accumulates years before the onset of clinical symptoms according to neuropathologic studies [43]. Previously, Aβ levels were primarily determined through autopsy, but the development of various tracers including Pittsburg-B compound (PiB) and various F-18 tracers (e.g., florbetapir, florbetaben, and flutemetamol) have allowed determination of Aβ content premortem. With respect to the new amyloid, tau, neurodegeneration (ATN) framework, amyloid PET can evaluate the (A) component [44]. Due to the longer half-life of F-18 in comparison to the C-11 label of PiB, the new tracers are more practical for commercial distribution and broader clinical use. As a result, there is heightened interest in integrating this molecular imaging technique in the clinical workup of patients.
A negative amyloid scan indicates sparse to no Aβ plaques, while a positive scan points to presence of moderate to frequent plaques. Figure 3 demonstrates a characteristic amyloid negative versus positive scan. Johnson et al. reviewed 15 recent publications of groups who performed amyloid PET on clinically diagnosed AD patients and reported that 96% of these patients were amyloid positive [45]. Combined data from five amyloid PET studies with longitudinal clinical follow-up for 1–3 years of 155 MCI patients showed that 53 of 57 participants (93%) who progressed to AD were amyloid positive at the time of baseline evaluation. In this same study only 4 of 54 MCI participants (7%) whose amyloid scans were negative progressed to clinical AD [45]. A negative amyloid scan suggests the cognitive deficits are not attributable to AD. For instance, Fig. 4 demonstrates a scan that is negative for pure AD, but positive for DLB. Positive amyloid scans do not establish a definitive diagnosis of AD as high plaque density has been noted in cognitively normal elderly individuals and in other medical conditions [46]. A further limitation of interpreting amyloid PET is that amyloid deposition is also present in aging [47] and other neurodegenerative diseases such as DLB [48].
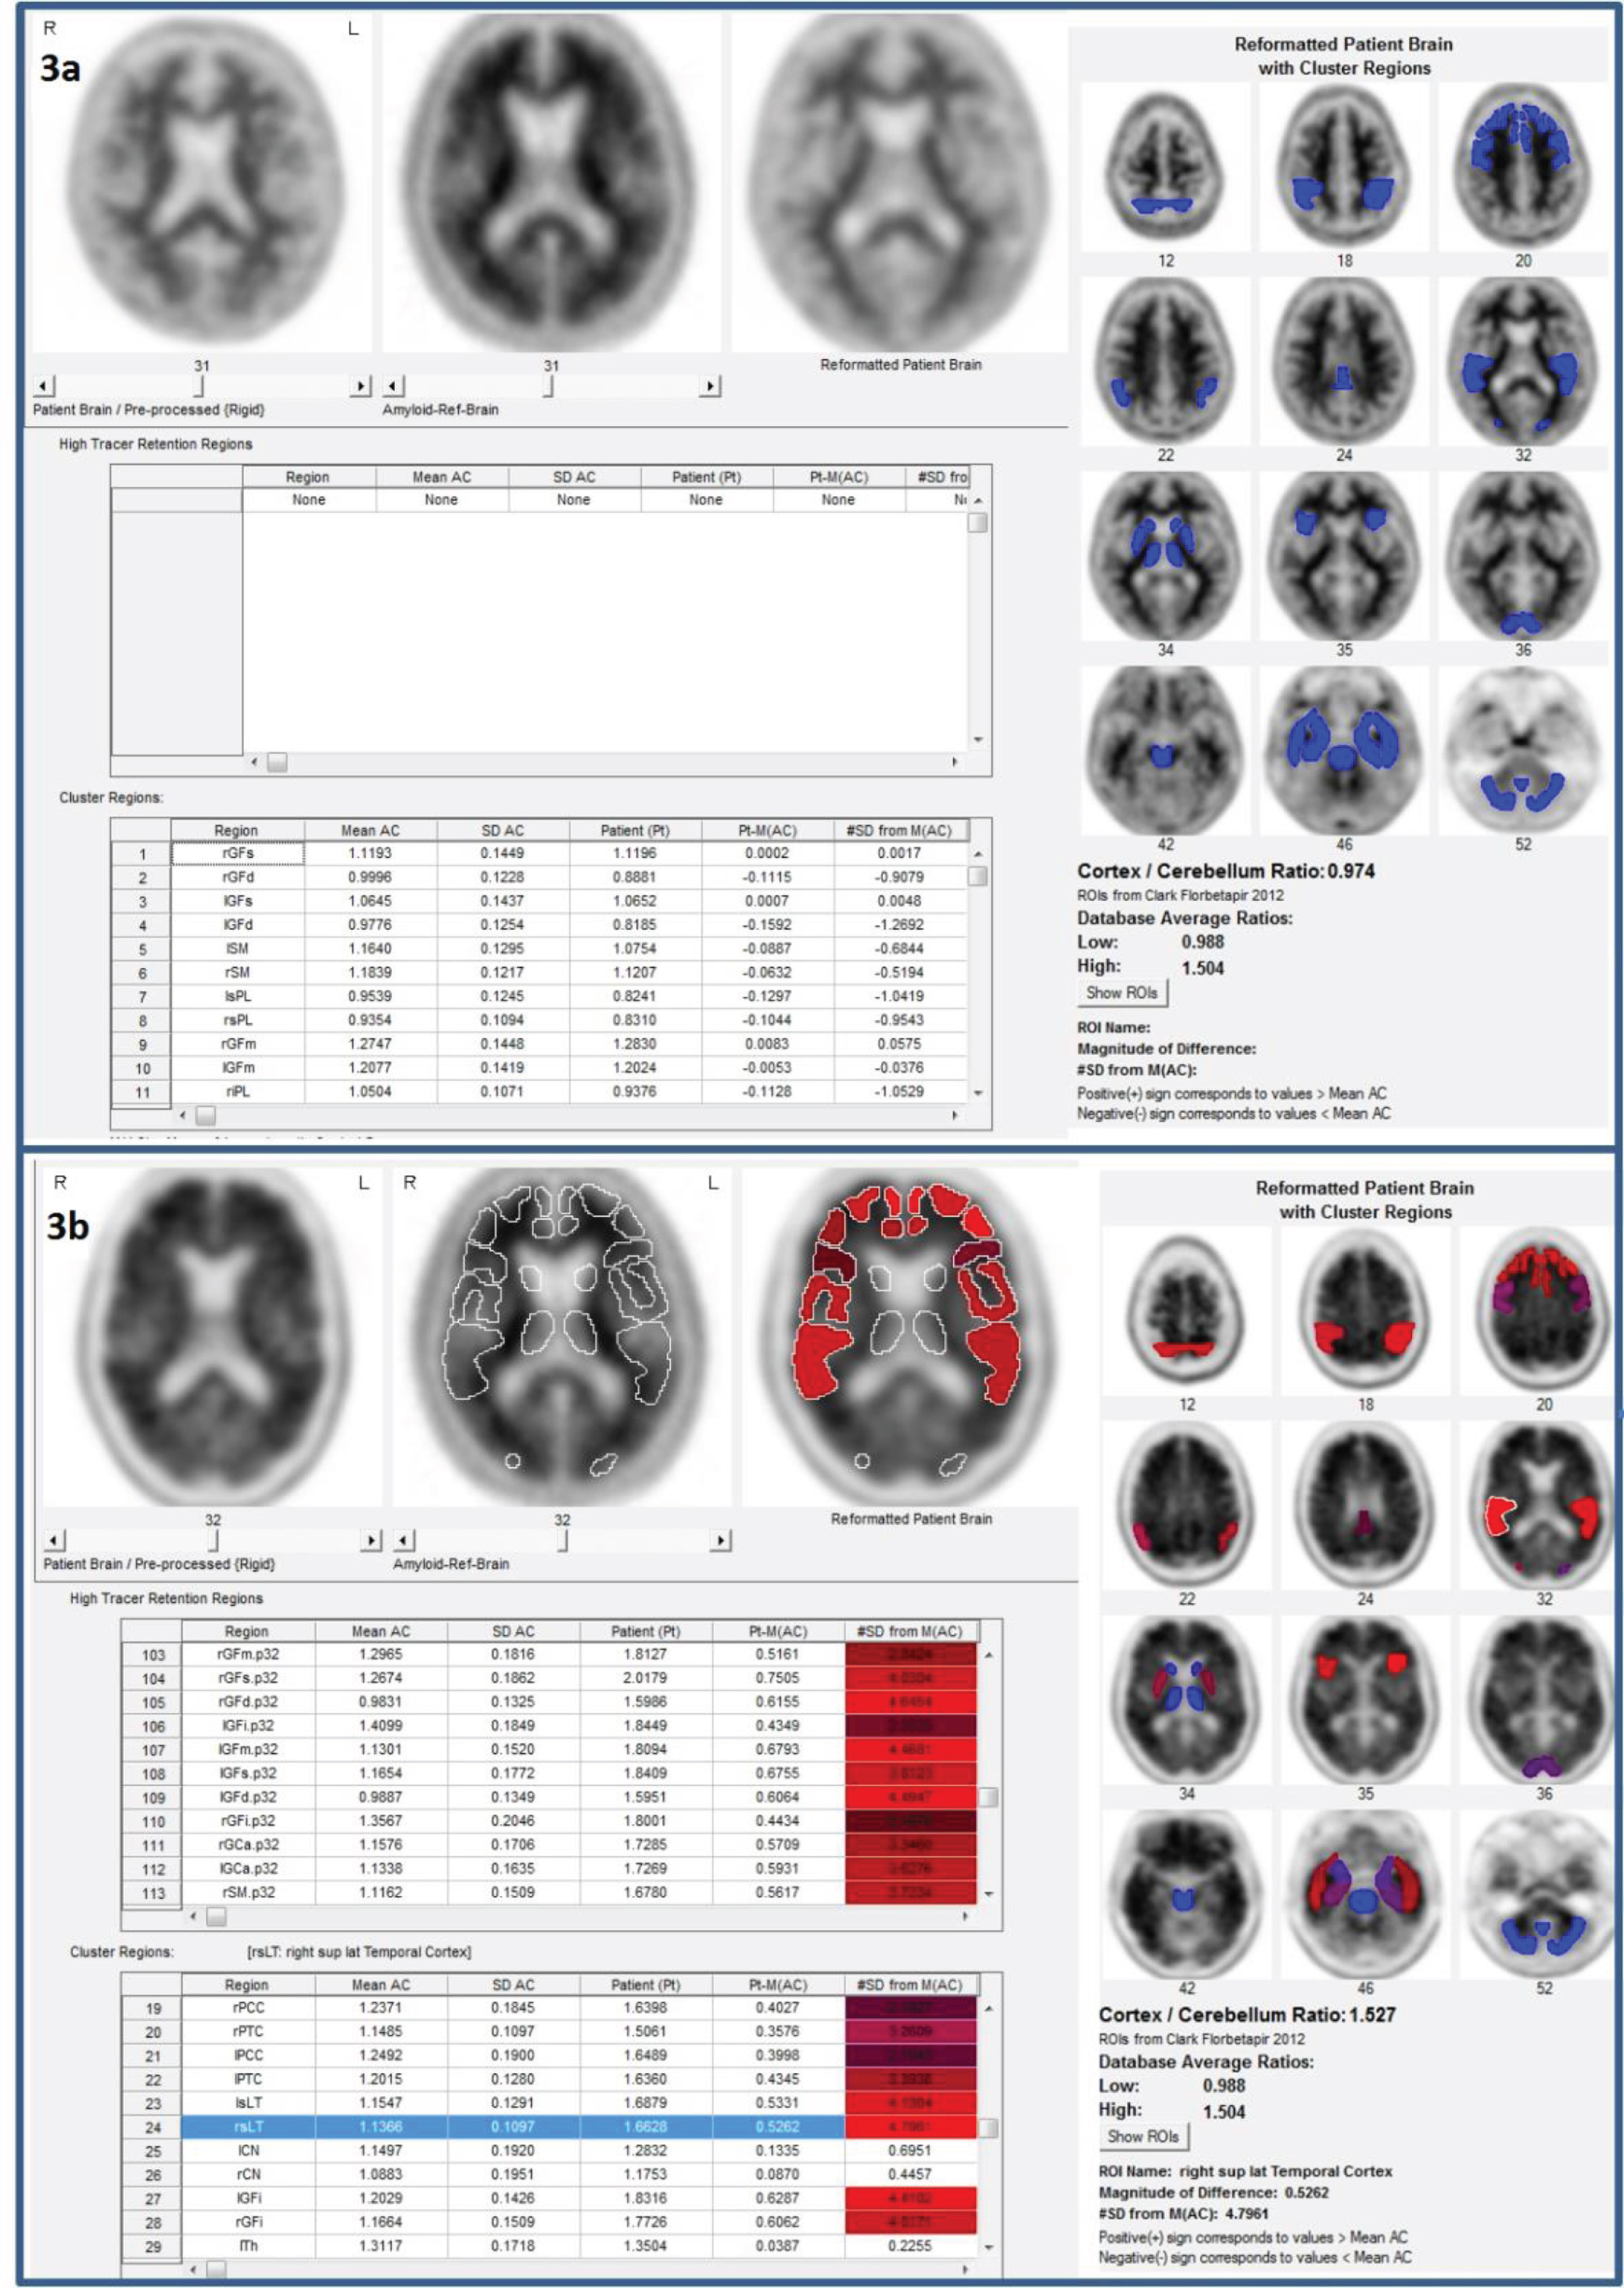
Characteristic amyloid scans. a,b) Predominant white matter retention seen in prototypical negative florbetapir PET scan of a 62-year-old woman. a) Positive florbetapir PET scan demonstrates shift to predominant grey matter retention of a 68-year-old woman (b).
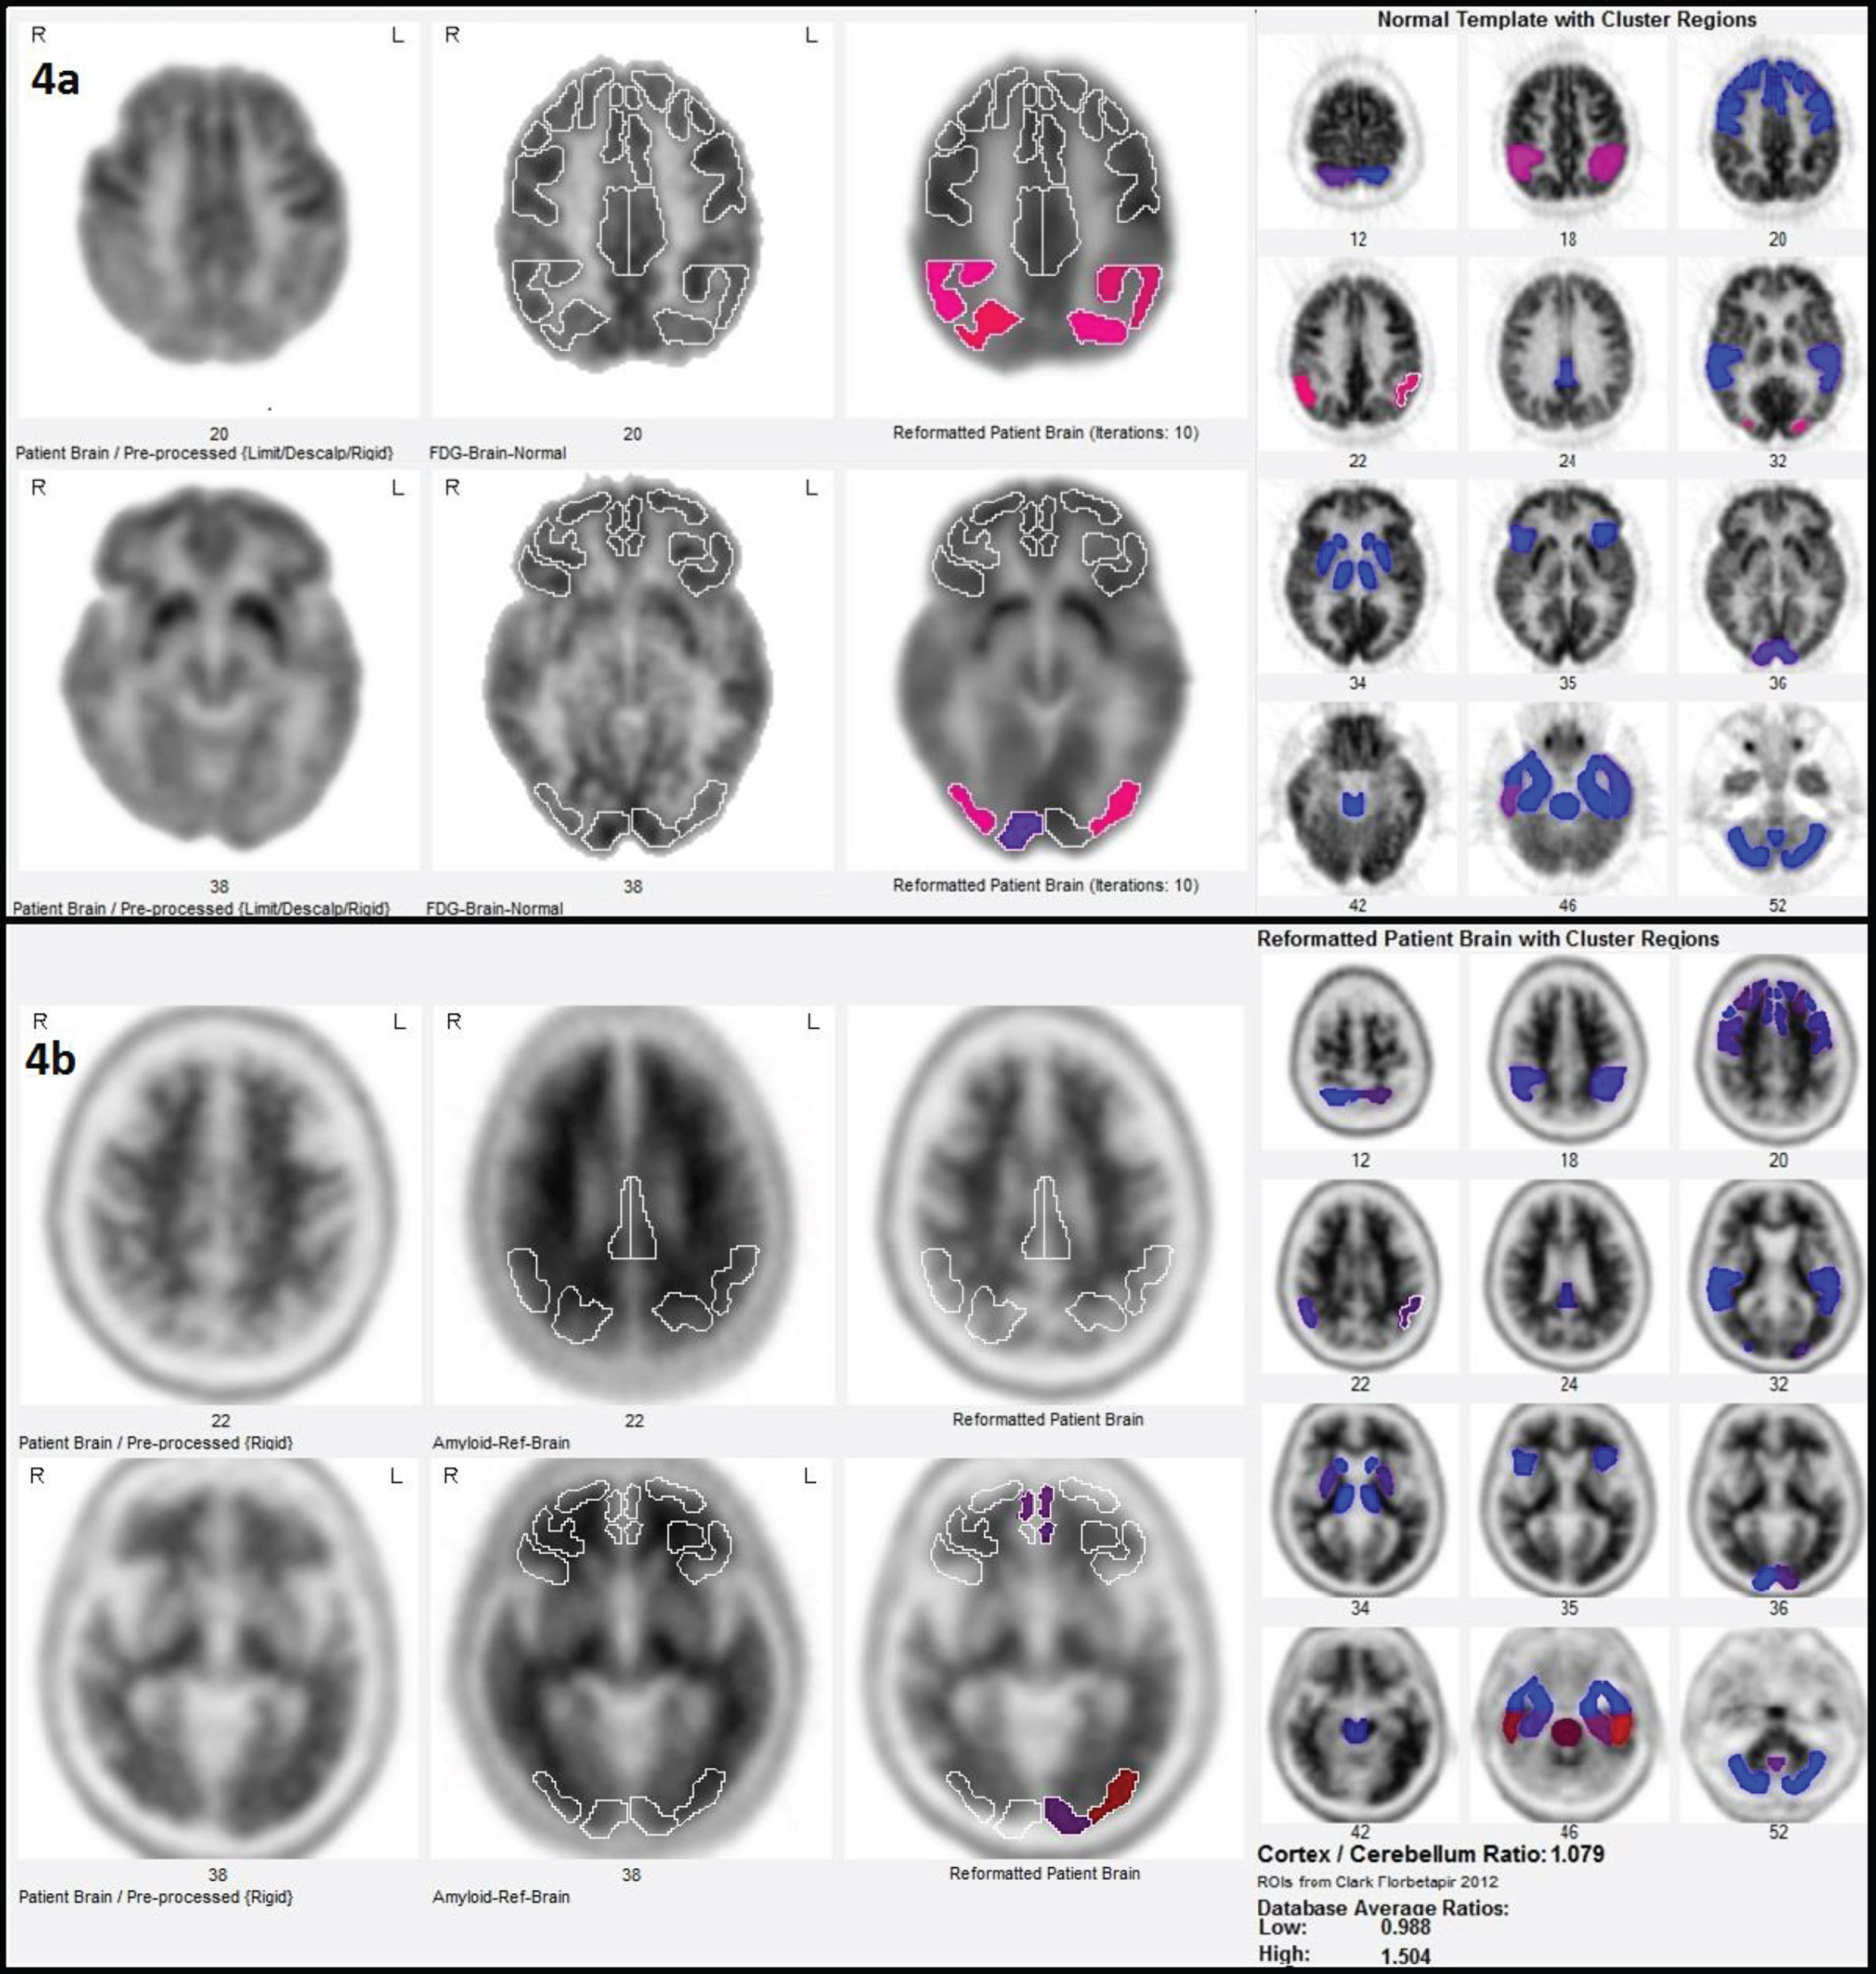
A 72-year-old man that is negative for Alzheimer’s disease, positive for Lewy body dementia. a, b) FDG-PET shows severe parietotemporal and associative visual cortex hypometabolism, consistent with dementia with Lewy bodies. a) Florbetapir PET is negative with a cortex to cerebellum ratio index of 1.079, close to the normal database mean for low (0.988) and far below the mean for high (1.5) (b).
The utility of amyloid imaging is limited as it is difficult to further interpret the scans as being consistent with other diseases. In contrast, MRI and FDG-PET scans can identify additional indications of disease pathology. Additionally, recent evidence shows that Aβ oligomers, rather than the fibrillar Aβ plaques that are detected through amyloid imaging, are the toxic form of amyloid that initiate the neurodegenerative process underlying AD [49, 50]. Thus, the effects caused by oligomeric Aβ levels cannot be directly visualized with current amyloid scans. Additionally, the cost of amyloid PET discourages widespread use, CSF measurements of Aβ burden can provide analogous information without the high associated expense if amyloid imaging is only to be used to indicate whether Aβ is present [45]. Furthermore, Aβ deposition is an early event in the AD pathological cascade. Since accumulation eventually plateaus and recent evidence suggests a possible decoupling phenomenon between amyloid deposition and processes that mediate neurodegeneration, amyloid imaging is not an effective in vivo marker of progression of dementia [51–54]. Consequently, there is poor correlation between the disease stage and Aβ levels in dementia patients, as well as a lack of correspondence between Aβ CSF levels and the regional distribution of FDG-PET changes. Data are currently limited to support the use of amyloid imaging for prognostic information to asymptomatic individuals or those who have AD risk factors.
Tau PET is a relatively newer molecular neuroimaging biomarker of AD but has received growing interest due to its ability to target tau that is linked with greater magnitude to synapse loss than amyloid [55]. Tau PET tracers include first generation tracers [18F]THK5317, [18F]THK5351, [18F]AV1451 (also known as [18]T-807, [18F]flortaucipir), and [11C]PBB3) [56]. Second generation tracers include [18F]MK-6240, [18F]RO-948 (previously referred to as [18F]RO69558948), [18F]PI-2620, [18F]GTP1, [18F]PM-PBB3, and [18F]JNJ64349311 ([18F]JNJ311), and its derivative [18F]JNJ-067] [57]. While tau PET allow for evaluating the T portion of the ATN framework and flortaucipir has been recently FDA cleared under the commercial name Tauvid [58], tau imaging is limited in use due to significant off-target binding [59].
STRUCTURAL MRI
The amount, distribution, and rate of cerebral atrophy as visualized with MRI can provide key neurodegenerative information. Different diseases tend to have varying characteristic patterns of neuronal losses that contribute to atrophy, rendering MRI a potentially useful tool for differential diagnosis. Medial temporal lobe atrophy is correlated with cognitive decline. Antemortem MRI scans of pathologically-confirmed dementia cases have revealed that those with AD primarily demonstrated atrophy in temporoparietal association areas and medial temporal lobe, while DLB patients displayed atrophy in the bilateral amygdala, dorsal midbrain, and inferior temporal lobes [60]. Atrophy in the frontal and temporal lobes was identified for FTLD subjects.
Overall, MRI is a convenient tool for assisting with early diagnosis since it is widely available and allows for serial images without concerns for radiation. Nonetheless, several limiting factors must be recognized like inability to directly detect the histopathological hallmarks of AD, limited molecular specificity, and overlapping atrophy patterns with other diseases [45]. In addition, volume changes may occur due to factors unassociated with disease progression, rendering it difficult to use MRI for evaluation of changes in cognitive decline over time. Even when abnormalities cannot be detected with MRI, significant changes in bran function as a result of neurodegenerative diseases may be identified using PET.
MULTIMODAL IMAGING
Utilization of multimodal imaging tools, in which several techniques are simultaneously applied, can help enhance diagnostic accuracy by providing complementary information. Support vector machine (SVM) analysis has been applied for detection of dementia in multimodal imaging. Briefly, SVM creates a hyperplane to separate controls from a patient population such as, in this case, AD and can be applied for single or multiple modalities for improved combined accuracy. One study explored multimodal classification of AD and MCI in 51 AD, 99 MCI, and 52 healthy subjects enrolled in the Alzheimer’s Disease Neuroimaging Initiative who had MRI, FDG-PET, and CSF data. Use of multimodal biomarkers resulted in 93.2% accuracy for distinguishing between AD and healthy controls and 76.4% accuracy for classifying MCI from healthy controls [61]. Additionally, a combination of the modalities allowed for correct classification of 91.5% of MCI converters and 73.4% of MCI non-converters, which has potentially beneficial implications since misclassification of MCI converters is more commonplace in practice than for non-converters.
Furthermore, another study evaluated the relative contributions of PiB, FDG-PET, and MRI for differentiating LBD from AD and reported that hippocampal atrophy, global cortical PiB retention, and occipital lobe metabolism together improved the accuracy of discriminating patients with AD and DLB to 98% in contrast to any one of the imaging tools alone [62]. Similarly, SVM analysis in patients with clinically diagnosed AD, FTLD, or controls who had both FDG-PET and MRI showed that though FDG-PET had the highest accuracy for distinguishing the three groups (81% overall) when considering a single modality, a combination of the modalities improved accuracy of differentiation to 92% for all three groups and 94% for AD versus FTLD alone [63]. These studies demonstrate that SVM is a promising tool for detecting multivariate relationships between different modalities and multimodal imaging can enhance dementia detection and differentiation. A recent review of studies exploring the relative and combined accuracy of neuroimaging tools in predicting conversion from MCI to AD also had potentially clinically applicable findings, as combinations of neuroimaging biomarkers were more accurate than any singling imaging modality [64]. Future investigations exploring the combinations of imaging modalities in different stages of AD and in different settings are needed to further clarify the role of multimodal imaging in clinical practice.
QUANTIFICATION
Improved interpretation of brain scans, through quantification software, can enhance the diagnostic value obtained with PET [65]. Interpretive confidence and accuracy can increase when pairing quantitative data with visual assessments, especially for readers without significant experience [66]. Currently available quantitative tools for single subject analysis in clinical settings that can yield information about the degree and statistical significance of hypometabolism in certain regions will allow for higher sensitivity for AD diagnosis [67, 68]. Furthermore, quantification of FDG-PET is useful in measuring metabolic changes between subsequent scans [69]. For instance, occurrence of metabolic decline versus stability can help distinguish between the presence or absence of pathologic processes, lending support for the AD diagnosis [70]. Assessments of progression or regression between two scans of the same patient over time will allow for better regional comparisons, increase the reliability of readings, and offer a standard means of communicating findings with physicians across different centers.
Methods of quantifying PET activity using a voxel-based method, such as statistical parametric mapping, or a pixel-based method such as 3-dimensional stereotactic surface projection (Neurostat, Seattle, WA), are widely used for their research applications. For individual brain scan analyses, several software packages are available for clinical usage. FDA-cleared display and analysis packages include NeuroQ (Syntermed Inc., Atlanta, GA), Cortex ID (GE Healthcare, Waukesha, WI), MIM Neuro (MIM Vista Corp, Cleveland, OH), and Scenium (Siemens AG, New York, NY). At our institution, University of California Los Angeles, we utilize NeuroQ (http://www.syntermed.com), the first FDA-cleared software for brain quantification, to provide comparisons of regional distribution of FDG to a normal database and to assist with differential diagnosis of dementia. Following scalp stripping, rigid registration, and elastic spatial transformation to a template space, NeuroQ rapidly quantifies brain activity in 240 standardized regions of interest on each PET scan and then clusters them into 47 volumes of interest. The program includes a database of cognitively normal subjects that are used for comparisons of brain activity levels and outputs of statistical significance. Most recently, NeuroQ has been cleared for use with amyloid scans as it offers a tool to analyze retention levels in different regions of the brain, as well as providing an index of overall cortical accumulation of tracer. Figures 1–4 utilize NeuroQ to identify regions of abnormality and to provide a corresponding display of relative statistical significance.
INTEGRATION
How then should use of the various clinically available neuroimaging tools be integrated? Objective assessment of the patients and their history is the initial step (Fig. 5). Obtaining past medical/family/educational history and co-morbidities is critical for distinguishing AD from effects of secondary dementia processes [71, 72]. If the clinician detects cognitive deficits or personality-related or behavioral changes after taking the patient’s history and physical exam, then suspicious historical features or neurological findings must be examined. If present, an MRI or CT should be administered or a neurology/neurosurgery consult must be considered. Structural and functional imaging complement clinical tests since imaging can provide information about the disease pathology and is less subject to practice effects, or floor effects and may also identify a surgically treatable disease. The clinician should also look for correctable conditions from labs or the history/physical examination and refer for the pertinent consults. According to EFNS guidelines, blood tests are helpful in excluding co-morbidities and should include vitamin B12, folate, TSH, calcium, glucose, complete blood cell count, renal, and liver function assessments [8, 72]. If no correctable conditions are present or deficits persist even after therapy, then FDG-PET should be considered. Those patients with FDG-PET scans that show the possibility of Lewy bodies may benefit from dopaminergic imaging like DAT-SPECT or FDOPA-PET, while amyloid imaging will be appropriate for those FDG-PET scans that are either unclear with respect to presence of AD or may reflect inadequately treated comorbid conditions that can alter cerebral metabolism.
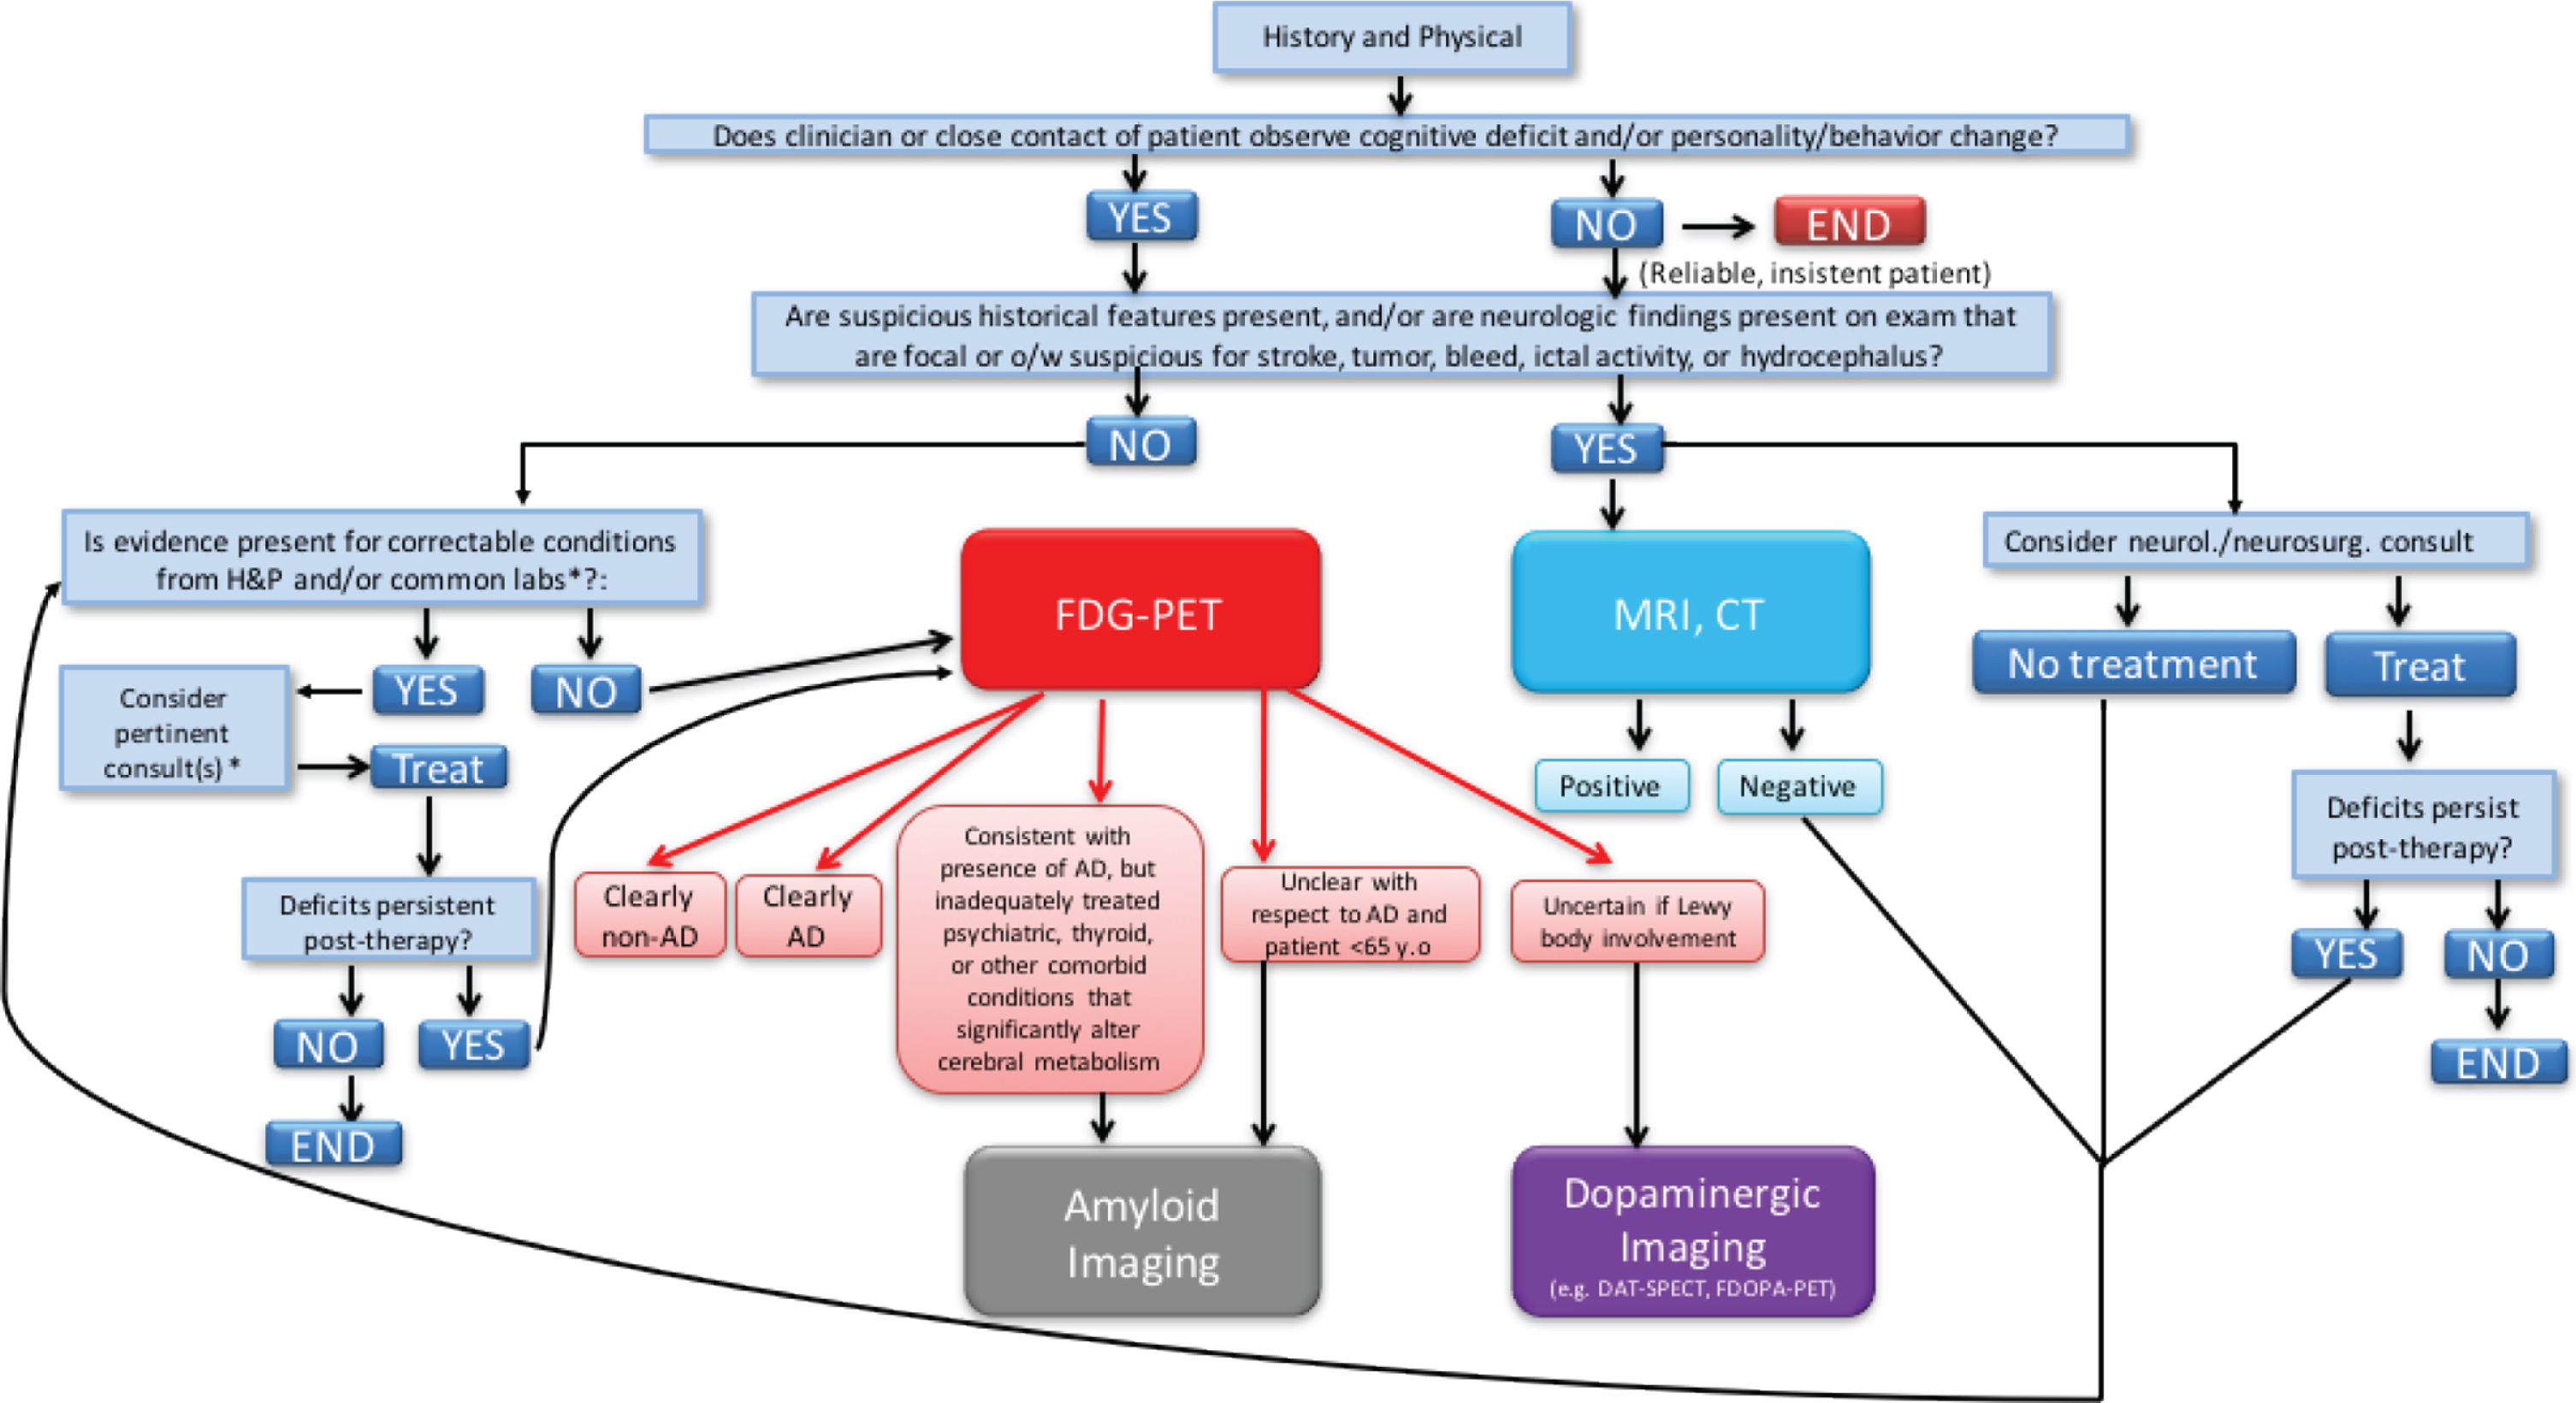
Diagnostic algorithm integrating multiple available imaging tools. Note: Although not discussed in the present paper, dopaminergic imaging [56] may help with diagnosis of Lewy body dementia, parkinsonian syndromes, and essential tremor. *Common History and Physical (H & P) items include: depression, substance abuse, malnourishment, medication effects or interactions, cardiopulmonary compromise. *Common Labs include: Electrolyte/calcium imbalance, anemia, hypoxemia, infection, thyroid, renal, or hepatic dysfunction, glucose dysregulation. †Consults include: Cardiology, Infectious Disease, Endocrine, Psych, Pulmonary, Renal.
CONCLUSION
With the increasing prevalence of AD, the utilization of various neuroimaging modalities to help detect pathological changes in the early stages of the disease will become increasingly common. Patterns of structural and functional cerebral changes are consistent with neurodegenerative dementias and can be used to reduce uncertainty in AD diagnosis. In the future, more longitudinal studies that employ multiple imaging tools will be helpful for understanding the relative contributions of each imaging technique and will allow for more direct comparisons. For example, the combination of quantitative structural MR imaging and neuronuclear PET imaging can potentially meet the clinical need of predicting who is most likely to have AD [73] or who is more likely to progress to AD [74]. The availability of FDA cleared algorithms for these multi-modal imaging approaches increases the clinical translatability of this approach [32, 76]. Imaging tools, however, will not be used alone but can be supplemented with CSF approaches in which the ratio of beta amyloid and phosphorylated tau can often predict the results of amyloid PET imaging [77]. Recently, imaging tools have also been used to monitor the effectiveness of new therapies [78, 79]. Preclinical intervention studies that use imaging biomarkers to choose subjects or provide outcome measures to see if therapies have disease modifying effects are emerging [45]. These may significantly contribute to our understanding of AD and help guide future patient evaluations and treatment.
Footnotes
ACKNOWLEDGMENTS
Dr. Raji was supported in his research efforts by a training grant from the National Institute of Biomedical Imaging and Bioengineering (NIH T32 EB001631), administered by the UCSF Department of Radiology and Biomedical Imaging, and the American Society of Neuroradiology Boerger Research Grant. He is currently supported by additional grants from the Radiological Society of North America Research Scholar Award and WUSTL NIH KL2 Grant (KL2 TR000450 –ICTS Multidisciplinary Clinical Research Career Development Program).