
Abstract
Background:
Currently, there is no objective, clinically available tool for the accurate diagnosis of Alzheimer’s disease (AD). There is a pressing need for a novel, minimally invasive, cost friendly, and easily accessible tool to diagnose AD, assess disease severity, and prognosticate course. Metabolomics is a promising tool for discovery of new, biologically, and clinically relevant biomarkers for AD detection and classification.
Objective:
Utilizing artificial intelligence and machine learning, we aim to assess whether a panel of metabolites as detected in plasma can be used as an objective and clinically feasible tool for the diagnosis of mild cognitive impairment (MCI) and AD.
Methods:
Using a community-based sample cohort acquired from different sites across the US, we adopted an approach combining Proton Nuclear Magnetic Resonance Spectroscopy (1H NMR), Liquid Chromatography coupled with Mass Spectrometry (LC-MS) and various machine learning statistical approaches to identify a biomarker panel capable of identifying those patients with AD and MCI from healthy controls.
Results:
Of the 212 measured metabolites, 5 were identified as optimal to discriminate between controls, and individuals with MCI or AD. Our models performed with AUC values in the range of 0.72–0.76, with the sensitivity and specificity values ranging from 0.75–0.85 and 0.69–0.81, respectively. Univariate and pathway analysis identified lipid metabolism as the most perturbed biochemical pathway in MCI and AD.
Conclusion:
A comprehensive method of acquiring metabolomics data, coupled with machine learning techniques, has identified a strong panel of diagnostic biomarkers capable of identifying individuals with MCI and AD. Further, our data confirm what other groups have reported, that lipid metabolism is significantly perturbed in those individuals suffering with dementia. This work may provide additional insight into AD pathogenesis and encourage more in-depth analysis of the AD lipidome.
INTRODUCTION
Alzheimer’s disease (AD) is a clinically and patho-physiologically heterogeneous, complex neurodege-nerative disorder and is the most prevalent form of dementia [1]. The major historical neuropathologic characteristics include the accumulation of amyloid-β extracellular plaques and intracellular neurofibrillary tangles composed primarily of tau [2, 3]. Mild cognitive impairment (MCI) is the prodromal state of AD where objective cognitive deficits are present, but not of sufficient severity to impair functional capacity [4]. In some instances MCI is thought to be a transitional state between normal aging and AD; however, not all cases will convert to AD [5]. The conversion rate of MCI to AD is estimated to be ap-proximately 10% per year [6] and that number in-creases annually [7]. Current therapies for AD are typically initiated only after a clinical diagnosis of either MCI or AD is made. Their modest benefit may thus be partly explained by the fact that irreversi-ble brain pathology has already accumulated by the time the clinical features are recognized [8]. Increasing knowledge of the etiopathogenesis of AD holds promise for the development of new targeted therapies and biomarker-guided prevention strategies [9]. The development of valid and reliable biomarkers for AD will not only aid clinicians in recognizing the disease in its earliest symptomatic stages but will be especially important for effective disease-prevention or disease-modifying therapies when they become available [10]. Furthermore, reliable biomarkers might permit preclinical intervention or even prevention, before substantial neuropathological damage has occurred and before the onset of prodromal or manifest AD. Researchers are curr-ently developing novel treatments for AD that could potentially prevent neurodegeneration [11]. The dev-elopment of early biomarkers is a necessary first step to the design of such prevention and early-in-tervention trials.
Although substantial progress has been made in identifying positron emission tomography (PET) and cerebrospinal fluid (CSF) biomarkers for diagnosing AD, the impractical and invasive nature of these modalities make them a less attractive approach for most patients. Moreover, financial and logistical hur-dles limit the use of these markers as primary diagnostic tools [10, 12]. As tissue lesion, organ dysfunction and pathological states can cause alteration in both the chemical and protein composition of blood, most of today’s clinical laboratory tests are based on the analysis of the liquid component of blood, including serum and plasma [13]. Therefore, in the case of AD diagnosis, attention has turned toward the development of blood-based biomarkers [9, 10]. One of the major hurdles of measuring brain derived proteins associated with disease onset and progression in the blood has always been the blood-brain barrier (BBB) restricting their movement [9, 14]. Thus, blood-based markers may not entirely reflect the biochemical milieu of the CNS. Measuring small molecules that can flow freely across the BBB may provide a more comprehensive picture of CNS activity and provide an accurate readout of what is happening within the brain [9, 15].
Metabolomics is a rapidly developing technology that is capable of quantifying the entire complement of metabolites in a given biological specimen, bio-fluid, or tissue [16] and promises great potential for early diagnosis, to monitor therapy, and for understanding the pathogenesis of many diseases [17]. We and others have shown the merit of metabolic pro-filing techniques for successfully characterizing neurodegenerative diseases [18–25]. This technique has recently proven useful in identifying plasma bio-marker panels for differentiating preclinical AD subjects from controls [12, 26–28], although these studies require further validation.
Plasma metabolomic analyses, therefore, represent a potential opportunity for the surveillance and early identification of individuals at risk of conversion to MCI and in turn to manifest AD, and thereby delineate a population for early therapeutic intervention [29–31]. The complexity and heterogeneity of AD biospecimens make it necessary for optim-ized analyses to be carried out on large sample sizes. In this study, we present a combination of 1H NMR and LC-MS based metabolomics to biochemically profile plasma harvested from patients at four sites across the US, including the Alzheimer’s Disease Research Centers (ADRC) at Emory and Rush, and samples obtained from the greater Rochester, NY and Irvine, CA communities, which is likely to have increased sample diversity in terms of ethnicity, educational level, and other relevant sociodemographic parameters. Using artificial intelligence and machine learning techniques on the two types of metabolomic data, our aim was to develop a diagnostic algorithm capable of accurately discriminating between cognitively intact controls, MCI, and AD participants.
MATERIAL AND METHODS
Samples
The study was conducted in the metabolomics division at the Beaumont Research Institute, MI, USA. A community-based sample cohort consisted of unrelated samples kindly provided by the ADRCs at Emory (Atlanta) and Rush (Chicago), and samples obtained from the greater Rochester, NY and Irvine, CA communities through the Rochester/Orange County Aging Study (R/OCAS). The sample cohort consisted of 77 AD patients, 71 MCI patients, and 101 cognitively healthy controls (HC). Peripheral blood was obtained following written informed consent for participation in the study and meeting study requirements [12, 26]. Study protocols and informed consent were approved by each respective Institutional Review Board (IRB). The combined sample set and proposed analysis was approved by the IRB at Beaumont Health (IRB # 2016-148).
The diagnosis of probable dementia due to AD was established according to the NINCDS-ADRDA criteria [32]. The diagnosis of MCI was determi-ned according to the Mayo Clinic criteria [33, 34]. Blood samples were obtained upon enrollment, along with the assessment of cognitive state for diagnostic determination. Cognitive assessments were varied across the sites with the Rush and Emory ADRCs utilizing the core ADRC cognitive protocols supplemented with other measures including for example, the Cambridge Cognitive Test (CAMCOG) [33] and the Mini-Mental State Examination (MMSE) [35]. Participants from the R/OCAS were grouped into diagnostic categories using a clinically relevant neuropsychological battery as reported in our prior work [12, 36]. The primary measure of memory in this battery was the Rey Auditory Verbal Learning Test (RAVLT) [37]. In addition, critical parameters such as ethnicity, education and other sociodemographic factors for each patient was reported (Supplementary Table 1).
Sample preparation and data collection
For this investigation, blood collections have taken place at four notable AD research centers across the US. Sampling protocols have been previously reported [12, 26].
For NMR data collection, samples were prepared using a modified version of the method as described by Mercier et al. (2011) [38]. A total of 300μl of plasma were filtered through pre-washed (×7) 3.5 KDa filters (Amicon Micron YM-3; Sigma-Aldrich, St. Louis, MO) via centrifugation at 13,000 g, at 4°C for 30 min. To 228μl of the filtrate 28μl of D2O and 24μl of 11.77 mM sodium 2,2-dimethyl-2-2silapentane-5-sulfonate (DSS (D6) in 50 mmol NaH2PO4 buffer (pH7) were added. Using a liquid handler system (Bruker Biospin, USA), 200μl of the mixture was transferred to a 3 mm NMR tube for analysis. All 1H NMR spectra were acquired as previously described by Ravanbakhsh et al. (2015) [39] and Graham et al. (2016) [22]. Data collection took place on a Bruker Ascend III HD 600 MHz spectrometer (Bruker-Biospin, MA, USA) equipped with a 5 mm TCI cryo-probe at 300 K. Five hundred and twelve transients were acquired for each sample and chemical shifts (δ) are reported in parts per million (ppm). The singlet at 0.00 ppm produced by the methyl groups of the internal standard 4,4-dimethyl-4-silapentane-1-sulfonic acid (DSS-d6) was used for spectral referencing and quantification. All spectra were processed and analyzed using Chenomx NMR Suite (v8.1, Chenomx, Canada).
For targeted mass spectrometry, plasma samples were analyzed using a combination of direct injection mass spectrometry with a commercially available reverse-phase LC-MS/MS Kit (AbsoluteIDQ™ P180 Kit) as previously described [12, 41]. Briefly, data were acquired on a Waters TQ-S mass spectrometer coupled to Acquity I-Class ultra-pressure liquid chromatography system. The samples were delivered to the mass spectrometer by a LC method followed by a direct injection (DI) method. MetIQ (Biocrates) was used to control the entire assay workflow, from sample registration to automated calculation of metabolite concentrations, to the export of data into other data analysis programs.
Statistical analysis
Univariate analysis
Using MetaboAnalyst (v 4.0) [42], a student’s t- test and Mann Whitney U test were performed for all pair-wise comparisons for both parametric and non-parametric distributions, respectively. To acco-unt for multiple comparisons false discovery rates (0.05 < fdr; q-values) were calculated. In order to find out whether sample demographics were statistically significantly different one-way Analysis of Variance analysis (ANOVA) and chi-square tests were conducted using IBM SPSS Statistics toolbox (ver 24.0).
Machine learning-based regression analysis
The machine learning models investigated in this study include Logistic Regression, Linear Discriminant Analysis, Quadratic Discriminant Analysis, Gaussian Naïve Bayes, Linear Support Vector Ma-chine (SVM), Gaussian kernel SVM, K Nearest Neighbors, Decision Trees, Random Forest, Gradient Boosted Machine, and XGBoost. Prior to examining the predictive performance of the various machine learning (ML) approaches, sum normalized, generalized log transformed (glog) and auto-scaled data from each individual group were subjected to explo-rative multivariate statistical data analysis by Principal Component Analysis (PCA) to check for potential outliers or systematic variation (p < 0.05). Further, a Partial Least Squares-Discriminant Analysis (PLS-DA) was undertaken to assess the variation associated with sample collection sites. A Recursive Feature Elimination (RFE) method using logistic regression was applied to each pair-wise comparison (HC versus MCI, MCI versus AD, and HC versus AD) to find the most discriminative variables [43–45]. We used the top 5 discriminant variables to avoid overfitting. Following variable selection, numerous machine-learning models were built. To find the optimal com-bination for each algorithm, hyper-parameters such as cost values, kernel functions and the numbers of trees to train the data set were tuned. 10-fold cross validation was performed during model development. Once an optimal model was developed, prediction was carried out through 5-fold cross validation. Therefore, using the optimal hyperparameters, our models have essentially been trained on 4 folds and tested on the remaining fold. This was repeated 5 times across all datasets. In small datasets, one potential pitfall is that randomly splitting the data into train and test sets may bias the models giving over optimistic results. In order to prevent this, 5-fold cross validations were used for prediction.
The Synthetic Minority Over-Sampling Technique (SMOTE) method from the imbalanced-learn library in python and K-Nearest Neighbors (knn) were used to account for oversampling. Different number of neighbors and different number of data points for oversampling were tested to determine the best combination. Using the k-fold approach, only the training portion was oversampled, and the test set kept as original. Model performance was assessed by classification accuracy rate, by the area under a receiver operating characteristic (AUROC) curve, and by the identification of true discriminating features. Supplementary Figure 1 displays the schematic of the approach used to identify the best plasma biomarker panel for each pair-wise comparison.
Metabolite set enrichment analysis
Metabolite set enrichment analysis (MSEA) was undertaken using MetaboAnalyst (v4.0) [46]. Met-abolite names were converted to their respective Human Metabolite Database (HMDB) identifiers, and the raw data were imported in rows. The raw data were subsequently normalized to the sum, log transformed and auto scaled. The pathway-associated metabolite set was the chosen metabolite library, and all compounds in this library were used. Pathways with a Holm corrected p-value less than <0.002 were considered to be statistically, significantly different between the various pair-wise comparisons.
RESULTS
Using a combination of 1H NMR and DI–LC–MS/MS we profiled plasma collected from four different sites across the United States, from participants with MCI or AD and compared this with plasma from healthy, cognitively intact controls (HC). A total of 46 and 183 metabolites were accurately identified and quantified in plasma using 1H NMR and DI–LC–MS/MS, respectively. Of those recorded metabolites, 17 were detected across both platforms. Using these metabolite concentrations, three pair-wise univariate, and multi-variate statistical comparisons were carried out (HC versus MCI, MCI versus AD, and HC versus AD). Important sociodemographic factors for each participant have been reported in Supplementary Table 1. As evide-nced using the mean values of the respective MMSE score for each group and the p-values calculated using the Chi-square test (Supplementary Table 2), each sample group is well defined based on their cognitive scoring [47]. Supplementary Table 2 also reports the results of the multi-group comparisons of important demographic factors such as age and gender. The results of the one-way analysis of variance (ANOVA) and Chi-square test revealed that both gender and age were not statistically different between the groups. Supplementary Table 3 lists the results of the univariate analysis comparing the mean concentrations of all metabolites from HC versus MCI participants. As shown in the table, of the 212-recorded metabolites, 23 metabolites reached statistical significance (p < 0.002: q < 0.05). ‘Acetic acid’, ‘lysoPC a C16 : 1’, ‘C18 : 2’, ‘SM C24 : 1’ and ‘SM C24 : 0’ were identified by RFE to be the most discriminative between HC and MCI plasma extracts (Fig. 1A). In this particular comparison, 5 nearest neighbors with 200 oversampled points provided the best predictive outcome for all ML based models (Fig. 1B). The relative performance of 11 ML models used in this study were assessed by calculating a classification accuracy rate, AUROC, sensitivity and specificity values for each model. Based on these performance metrics the best three classifiers were found to be logistic regression, linear support vector machine (linear svm), and kernel support vector machine (kernel svm) (Fig. 1C), with AUC values = 78.3, 79.1, and 78.7, respectively. Following the ML based predictive model development using HC versus MCI data, the results of the pathway topology analysis identified amino sugar metabolism, alanine metabolism, and the glucose-alanine cycle to be the top three biochemical pathways that were significantly disrupted as a direct result of MCI (Supplementary Table 4).
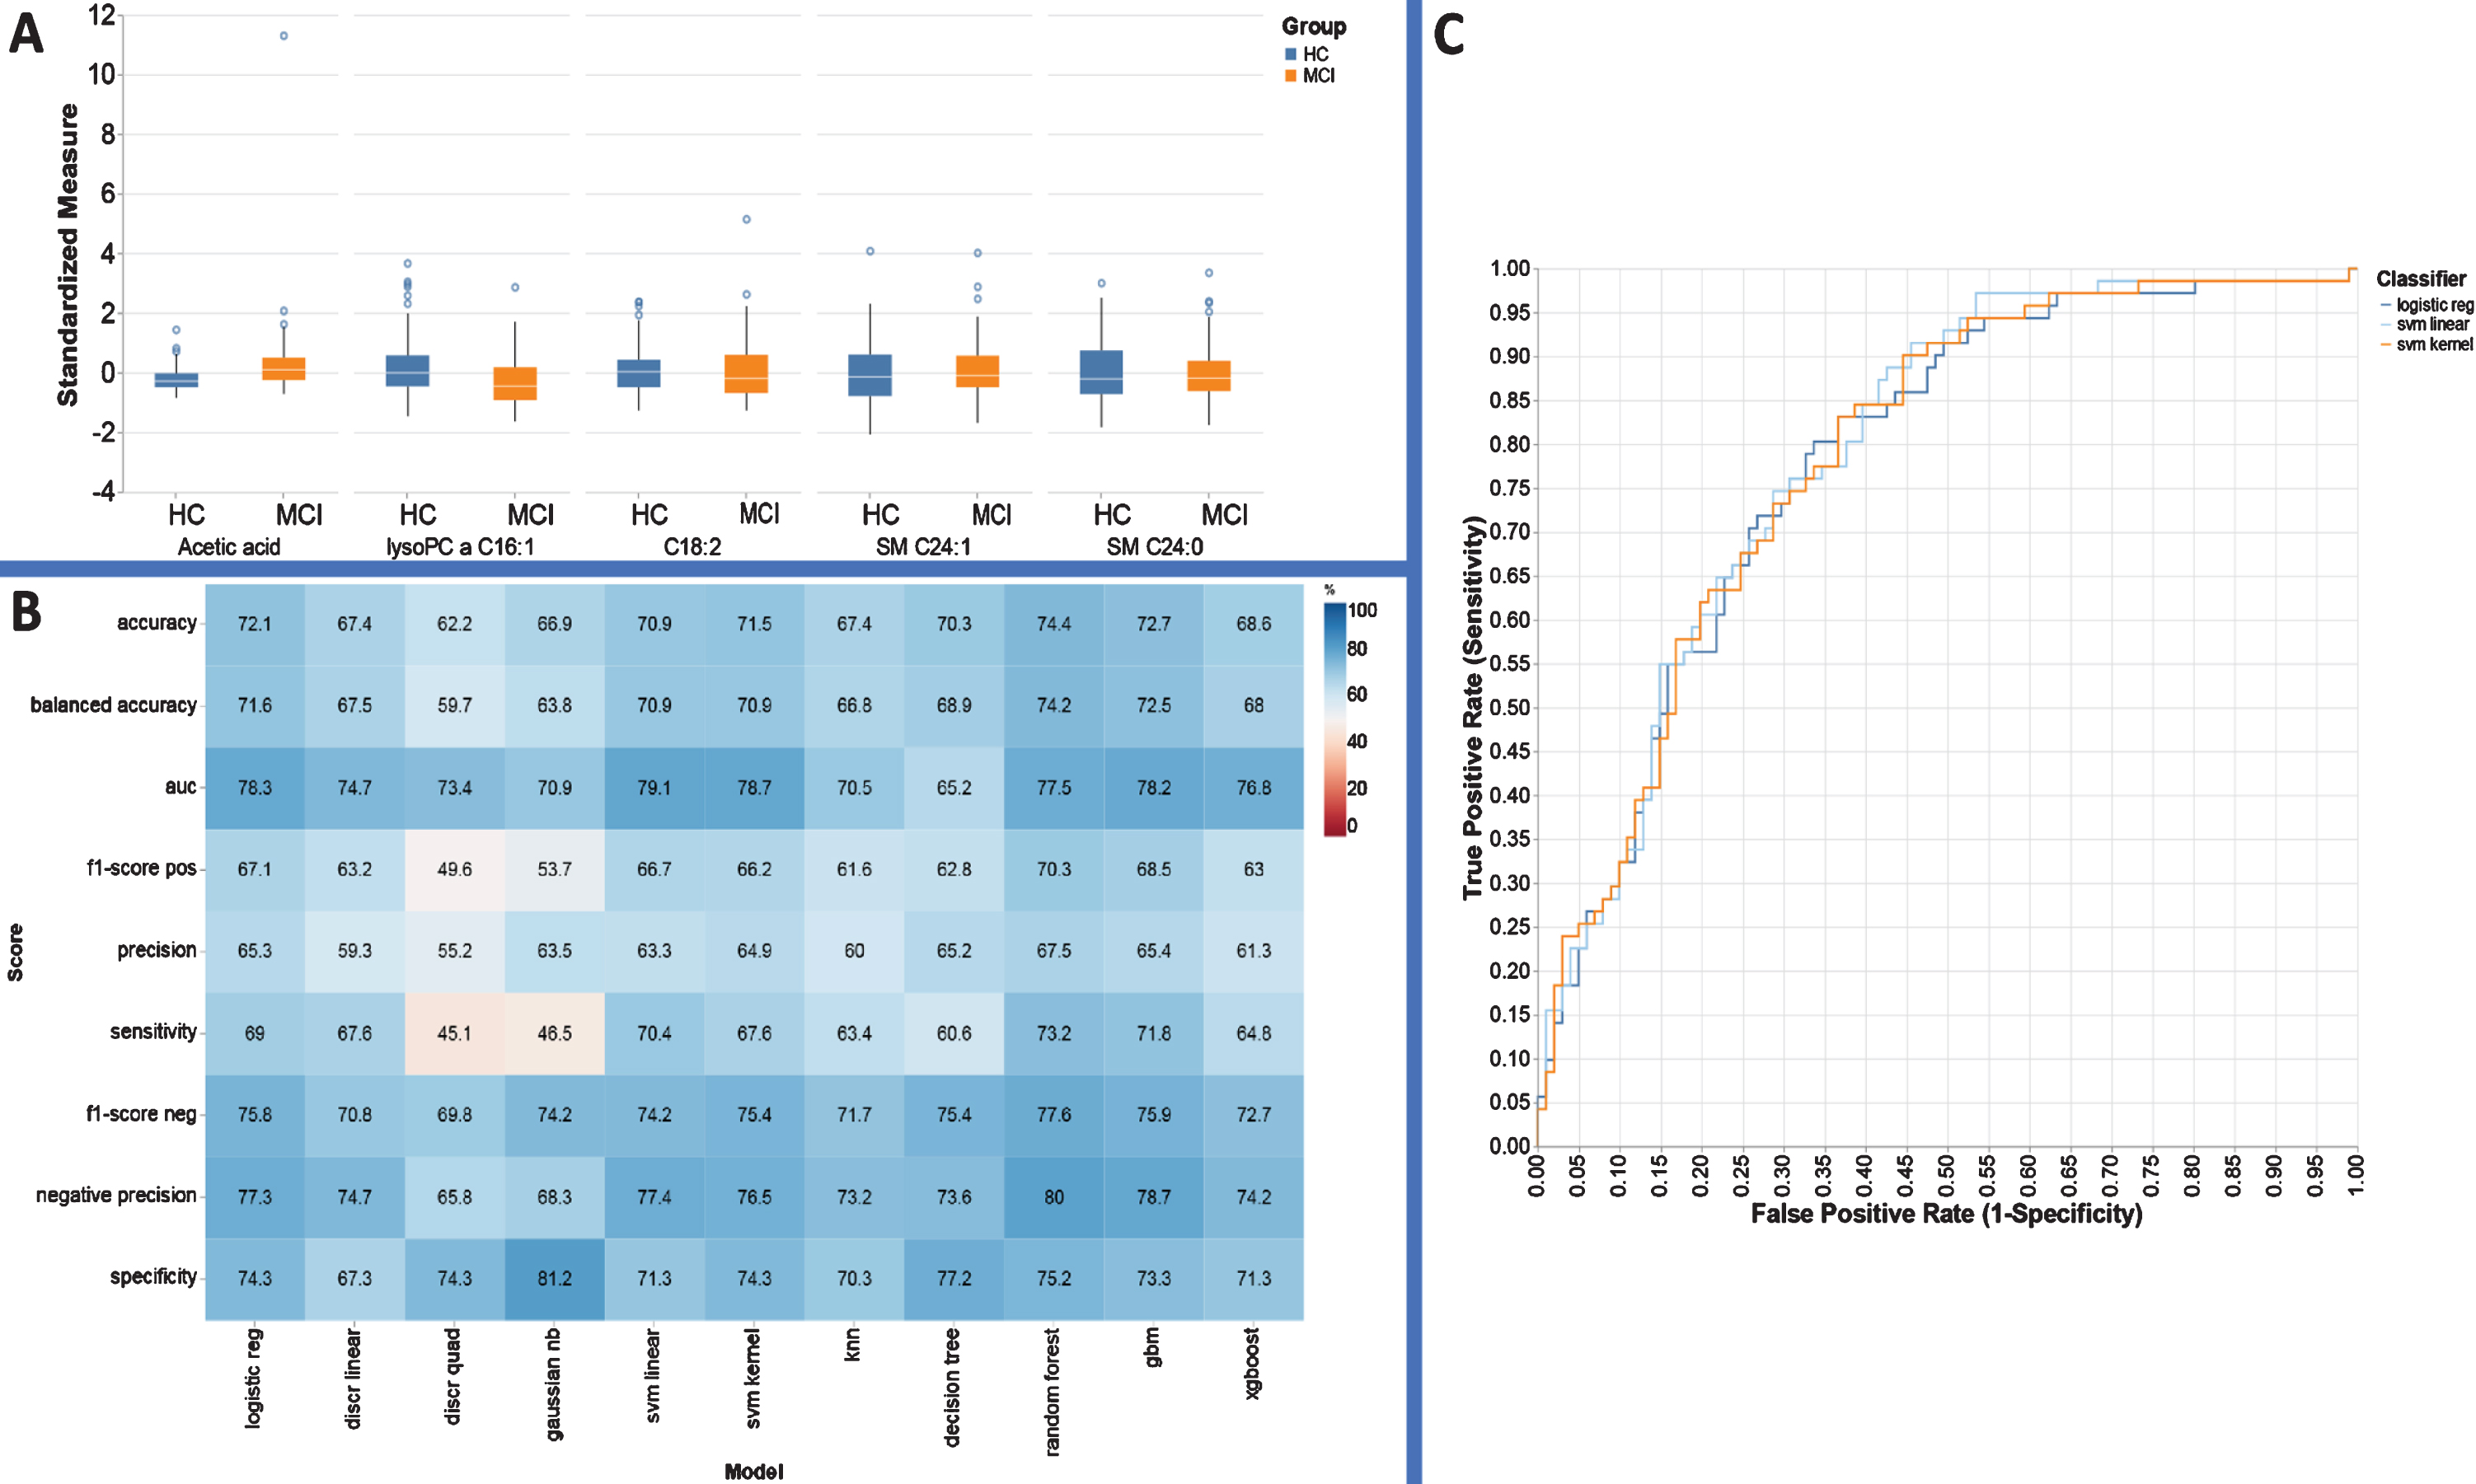
Performance evaluation metrics for each ML based model to include sensitivity, specificity, and AUC for the metabolite panels identified using the RFE variable selection algorithm for distinguishing HC from MCI.
Supplementary Table 5 lists the results of the univariate analysis comparing the mean concentrations of all metabolites from MCI versus AD participants. Of the 212 metabolites, 20 were found to have significantly different plasma concentrations (p < 0.002; q < 0.05). In this instance, RFE identified ‘Acetic acid’, ‘PC ae C36:0’, ‘SM C26:0’, ‘Acetone’, and ‘PC ae C36:4’ as the most important metabolites for separating MCI sufferers from AD patients (Fig. 2A). The best oversampled model for this data set was developed using 9 nearest neighbors with both groups oversampled 500 times (Fig. 2B). Using these settings among the various ML algorithms, logistic regres-sion analysis, linear discriminant analysis and linear svm analysis were found to be top 3 outperforming classifiers providing AUC values = 72.9, 72.1, and 73.1, respectively (Fig. 2C).

Performance evaluation metrics for each ML based model to include sensitivity, specificity, and AUC for the metabolite panels identified using the RFE variable selection algorithm for distinguishing AD from MCI.
Subsequent MSEA revealed that multiple biochemical pathways were significantly perturbed (p <0.002) in AD as compared to MCI. These include ketone body metabolism, fatty acid biosynthesis, cysteine and methionine metabolism, carnitine meta-bolism, mitochondrial β-oxidation of short-chain saturated fatty acid (SCSFA), mitochondrial β-oxid-ation of long-chain saturated fatty acid (LCSFA), and folate metabolism (Supplementary Table 6).
Supplementary Table 7 lists the results of the univariate analysis comparing the mean concentrations of all metabolites for HC versus AD participants. For this comparison, 12 of the recorded metabolites had statistically, significantly different concentrations (p < 0.002; q < 0.05) between HC and AD plasma. In this case, RFE identified ‘SM C16:0’, ‘PC ae C42:1’, ‘PC ae C40:2’, ‘PC ae C42:3’, and ‘PC ae C38:4’ to be the most important classification features (Fig. 3A). The data were oversampled using 3 nearest neighbors with both groups oversampled 500 times (Fig. 3B). In this scenario logistic regression, linear svm analysis and kernel svm analysis exhibited a significantly higher classification accuracy (70.2, 70.2, 70.2), and AUC values = 74.7, 74.7, 75.8, respectively.
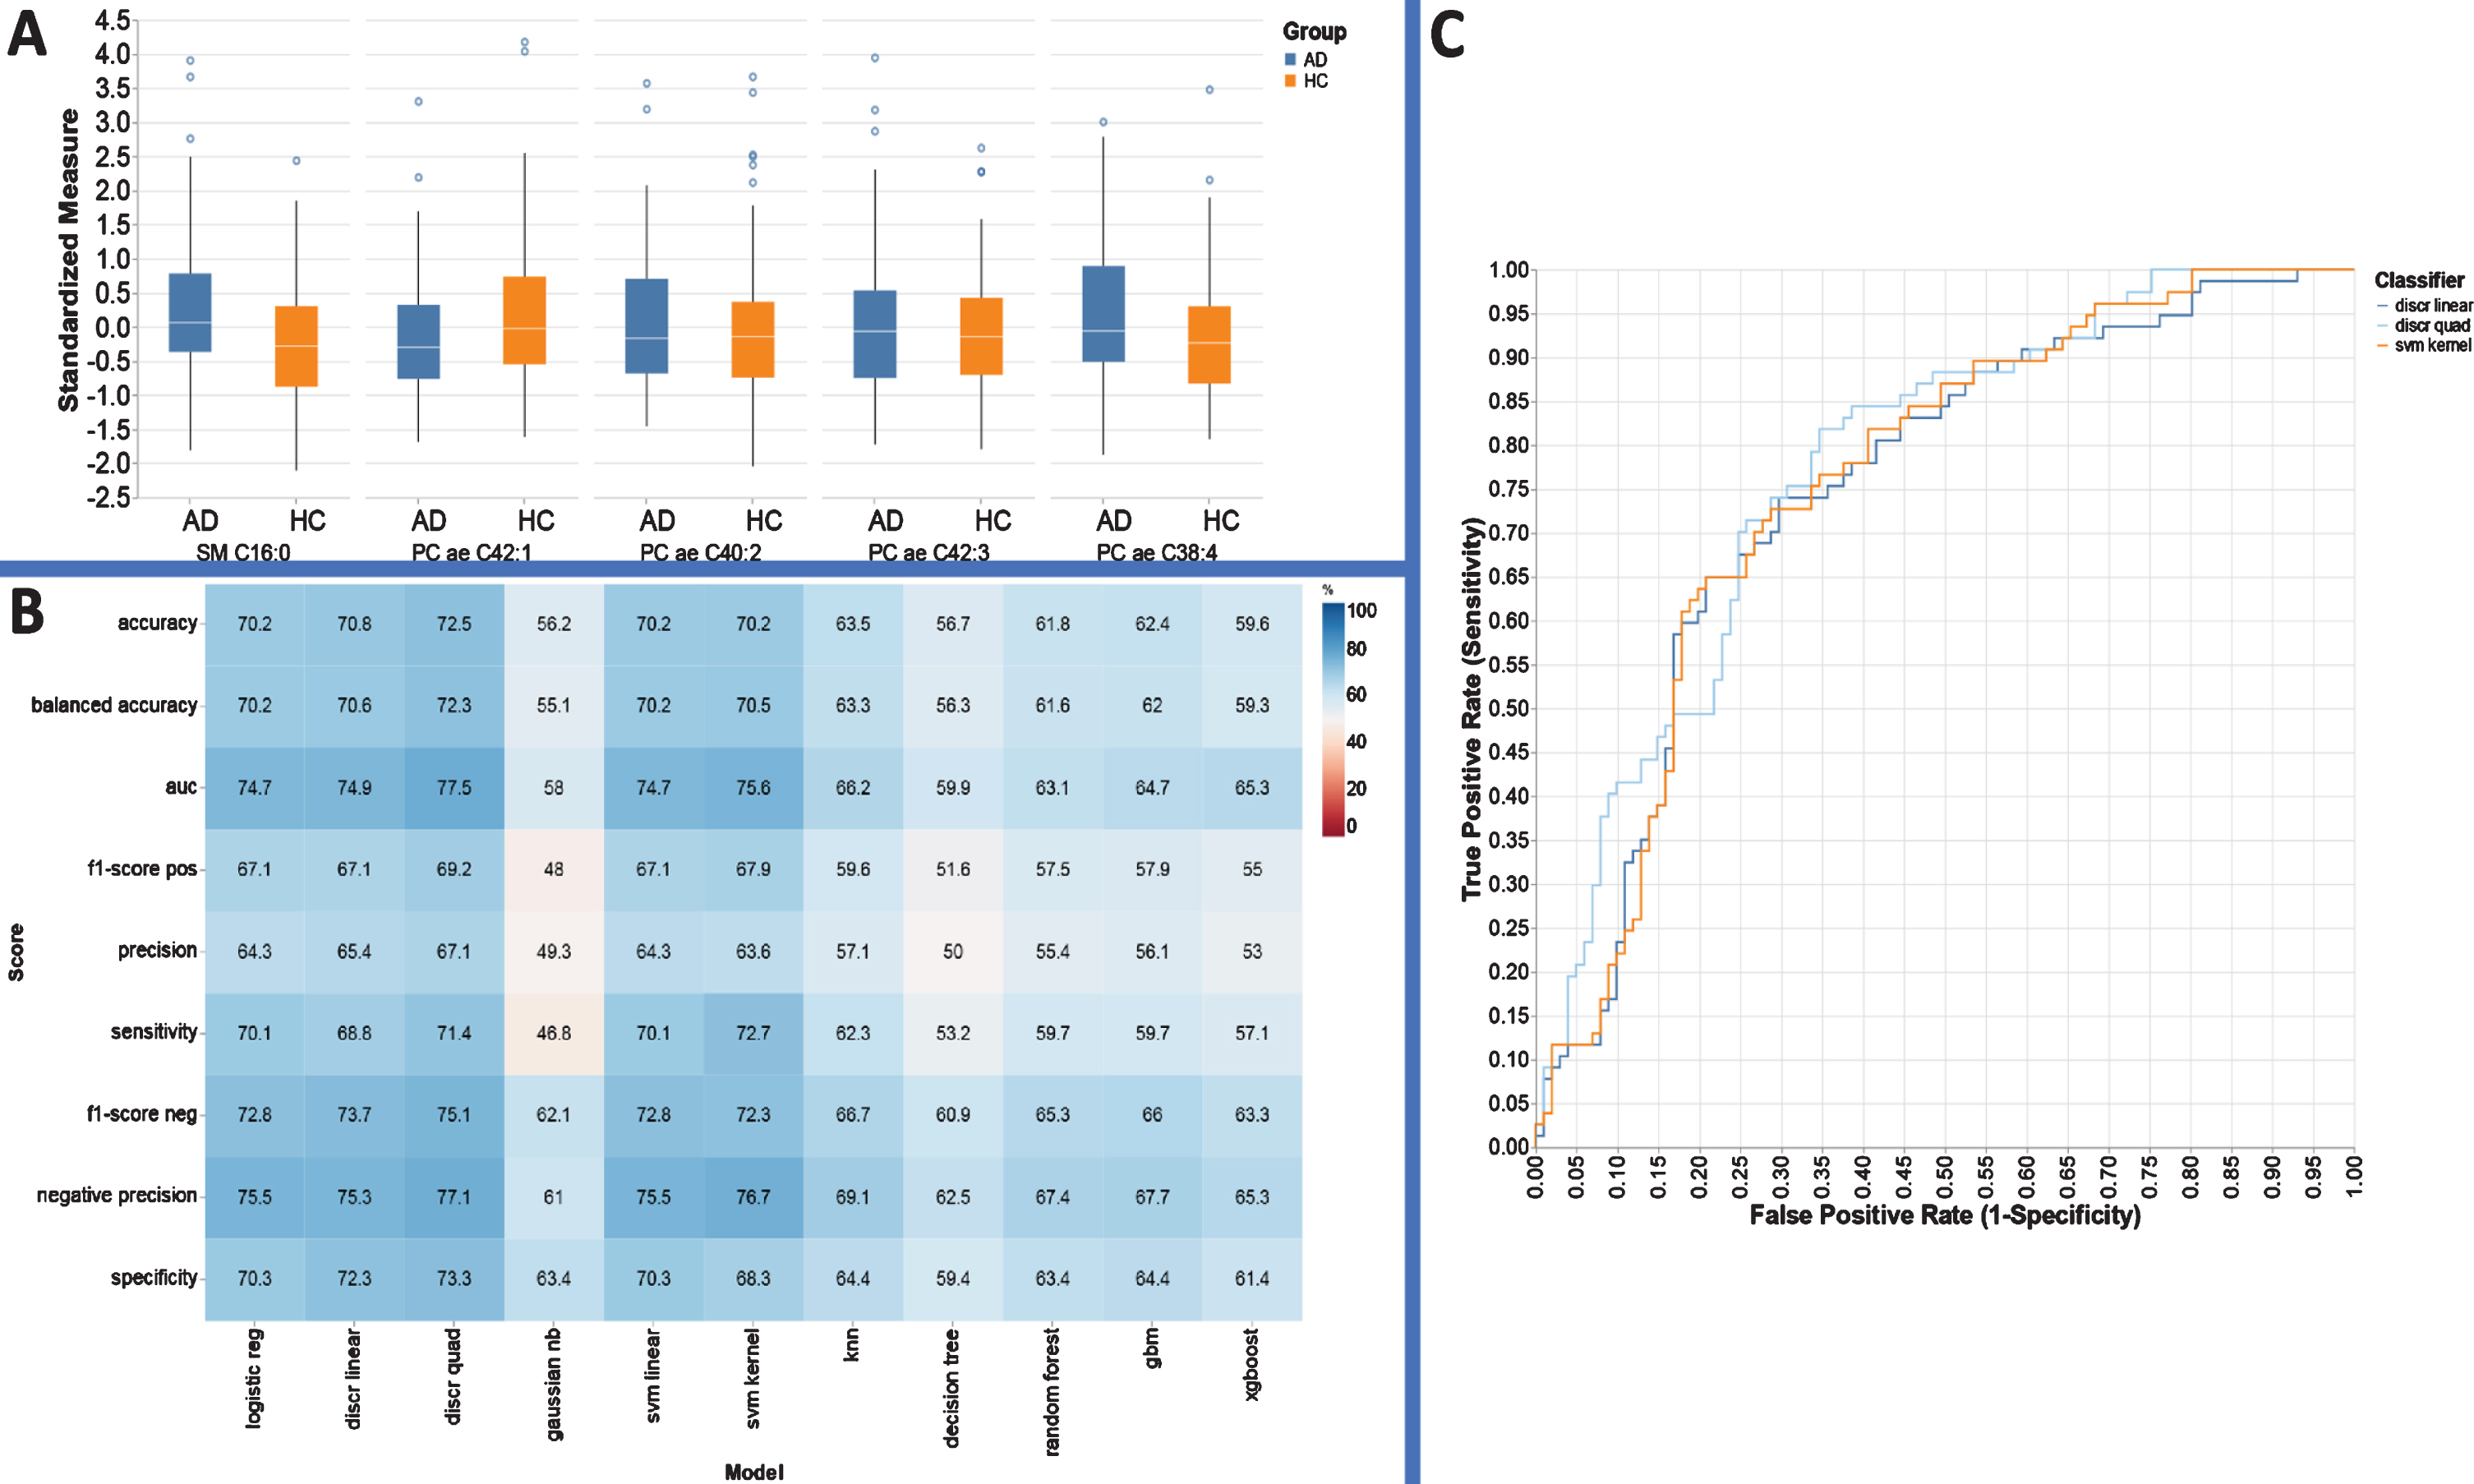
Performance evaluation metrics for each ML based model to include sensitivity, specificity, and AUC for the metabolite panels identified using the RFE variable selection algorithm for distinguishing AD from HC.
MSEA of the mean concentration data identified Tryptophan metabolism, glutamate metabolism, phospholipid metabolism, taurine and urea cycle, and sphingolipid metabolism to be significantly perturbed between HC and AD plasma extracts (p < 0.002; (Supplementary Table 8).
DISCUSSION
To the best of our knowledge, this is the first reported study to apply 1H NMR and DI/LC-MS/ MS to biochemically profile plasma from AD and MCI patients with the aim of identifying diagnostic biomarkers of disease, in comparison to control subjects. As metabolites exhibit a wide range of chemical and physical properties, it is currently impossible to employ one single analytical platform to analyze the entire metabolome. Thus, combining quantitative NMR and MS-based metabolomics approaches will increase our coverage of the metabolome making it much more likely we will identify robust, clinically useful biomarkers of disease. Moreover, given the complex and heterogeneous nature of AD, combining metabolomics data obtained from various analytical platforms may better reflect potential etiologic mechanisms and provide improved insight into the underlying pathobiological processes [48]. An additional strength of this particular study is the multi-center approach, where community-based samples have been collected from across the US and are likely to reflect a higher phenotypic diversity and real-life scenarios (i.e., more applicable to the gen-eral population). To account for any potential technical differences in sample acquisition between the various institutes and prior to employing any supervised classification approaches, we employed PCA to each individual group to make sure that systematic (technical) variation was not overshadowing any biological variation. Our results show that variation due to sample collection was negligible as evidenced by the scores plots in Supplementary Figure 2A–C. No separation was apparent due to the samples originating from different sites. While PCA is generally satisfactory to show that no variation was evident between collection sites, we decided to run PLS-DA models and measured the explained variation by each latent variable (LV). The top LVs for each model explained between 2 and 3% of the variation which is comparable to technical noise (Supplementary Figure 3A–C). Statistical analysis for multi-group comparison of demographic information revealed no group or gender differences between each group.
Based on univariate statistics, substantial alterations in plasma levels of various metabolites were detected (p < 0.05). A notable finding of this targeted metabolomics study was distinct metabolites belonging to acylcarnitines (AC), phosphatidylcholines (PC), and sphingomyelin (SM) classes and how they are related to AD. In particular, they are present at much lower levels in AD as compared to HC, as also reported by several other groups [49, 50]. Knowing that approximately 20% of total glucose-derived energy is consumed by the brain, it is not surprising that as the increasingly, inefficient AD brain attempts to maintain energy homeostasis, it switches to an alternative source of energy in the form of lipids. Strikingly, we observed that lipid levels are also lower in MCI when compared to HC, and that they tend to rise in AD samples. This has also been reported by other groups [10, 26] and we hypothesize that this drop-in lipid levels is directly related to the initial insult of AD pathogenesis in the brain. While these changes are in plasma, our group have also observed these changes in post-mortem human brain (data not presented) and we believe that the changes in plasma may occur in parallel to those observed in brain [23]. We speculate that during the prodromal phase of AD multiple metabolic pathways are perturbed and as a result, many metabolites are affected. After the emergence of clinical symptoms, the brain tries to maintain a resting level of specific metabolites and cannot reach initial values as observed in healthy, cognitively intact individuals due to significantly advancing hallmark pathology. We have previously reported a similar pattern in preclinical AD, where certain blood lipid levels are lower just prior to the emergence of clinical features and return to near normal levels later during the course of the disease [12].
Several ML approaches, such as knn [51], decision tree [52], logistic regression [25], and svm [53], have been routinely used by metabolomics investigators, but it is not quite clear which, if any, of these models are the best choice for the analysis of metabolomic data sets. Toward this end, we attempted to systematically evaluate several ML algorithms through classification accuracy rate, sensitivity and specificity, and the correct identification of the true discriminant features to build multi-biomarker models for clinical diagnosis and to predict AD and MCI based on the measurement of metabolite concentrations in plasma samples. The best three classifiers differentiating HC and MCI participants using the RFE based variable selection were logistic regression, linear svm, and kernel svm with classification accuracies of 72.1%, 70.9%, and 71.5%, respectively. In terms of AUC, the average AUC using these RFE features were 78.3, 79.1, and 78.7 which demonstrates the utility of this subset over all available metabolites. MCI differed from control specimens due to decreased levels of lysoPC a C16:1, C18:2, SM C24:0, and increased levels of acetic acid and SM C24:1 (Fig. 1A).
The same procedure was repeated with the top five metabolites identified using the RFE method, namely, acetic acid, PC ae C36:0, SM C26:0, acetone, and PC ae C36:4 for distinguishing MCI from AD (Fig. 2A). We used the concentration values of these metabolites to develop ML models which accurately distinguish MCI from AD participants (Fig. 2B). Of those models, AUC values of 72.9, 72.1, and 73.1 (95% CI) for logistic regression analysis, LDA, and linear svm analysis were acquired, respectively (Fig. 2C). AD differed from MCI samples due to increases in PC ae C36:4, SM C26:0, and PC ae C3:0 and decreases in acetic acid and acetone.
Figure 3A illustrates an optimal five-feature panel selected by RFE, and the corresponding performance metrics provided by each ML based approach utilizing this panel are presented in Fig. 3B. Linear discriminant analysis, quadratic discriminant analysis, and kernel svm models have similar AUC perfor-mance (74.7, 77.5, 74.7) and accuracy (70.8%, 72.5%, 70.2%) for AD diagnosis (Fig. 3C). The panel can simply be characterized with respect to concentration changes in PC and SM groups, respectively.
It is worth noting that both the logistic regression and linear SVM models performed equally well. Of note, each statistical algorithm follows different optimization procedures to reach optimal classification and predictive accuracy. Therefore, finding out the most compatible statistical approach with the metabolomics data in hand will help to maximize the predictive accuracy for a certain disease which is clinically vital.
Many studies have reported perturbations in amino acid levels in the blood and brain of AD patients and mouse models [54–56]. In parallel with those studies, the results of our MSEA when comparing the plasma metabolic profile of HC and MCI participants identified significant changes in amino acid metabolism (Supplementary Table 4). Identifying amino acid changes in patients with MCI is important as these changes may be directly related to the onset of AD. When neurons fail to catabolize glucose efficiently, during AD progression, they may become reliant upon amino acid oxidation as an alternative source for energy production. If neuronal amino acids become depleted or if the machinery used to metabolize amino acids becomes dysregulated, the neurons may enter apoptosis, contributing to the developing pathophysiology. However, even if neuronal energy levels are maintained via amino acid oxidation, the increased amounts of ammonia released during amino acid catabolism could lead to neuronal cell death as the urea cycle would become saturated as a result [55, 57].
In order to provide insights into the pathogenic mechanism or biochemical perturbations associa-ted with MCI and AD, we performed enrichment analyses as previously mentioned (Supplementary Table 6). Overall, significant alterations in fatty acid-related metabolism (Fatty Acid Biosynthesis, Mitochondrial Beta-Oxidation of SCSFA, and Mitochondrial Beta-Oxidation of LCSFA), ketone body metabolism and folate metabolism were observed. The association between fatty acids and AD has previously reported and their protective effect against age-related cognitive decline and onset of AD have been shown [58]. Our data suggested that dysregulation of fatty acid related metabolism lead to changes in levels of carnitines, phosphocholines, and sphing-olipids. Carnitine performs a crucial role in the energy metabolism of the brain, controlling the influx of fatty acids into the mitochondria, facilitating the oxida-tion of pyruvate, and protecting the neurons from the accumulation of membrane-destabilizing acylCoA [58–60]. Non-esterified LCFAs or their activated forms exert a large variety of harmful side-effects on mitochondria, such as enhancing the mitochondrial reactive oxygen species generation in distinct steps of the beta-oxidation and therefore potentially increasing oxidative stress [61]. Taken all together we believe that during the progression from MCI to AD, fatty acid metabolism is downregulated to avoid significant peroxisomal side-effects. It is also important to stress, that while not all cases of MCI will phenotypically convert to AD due to the heteroge-neity of the condition (likely to encompasses other emerging neurodegenerative conditions), it does highlight the clinical need to develop a test to identify those at greatest risk of converting from MCI to AD earlier. It is also important to note that all three comparative tests (HC versus MCI, HC versus AD, MC versus AD) resulted in three different sets of metabolites being selected, implicating slightly different metabolic pathways. This reinforces the emerging idea that the pathobiology is not a monotonic increase of a single process (proteopathy), but rather a dynamic set of metabolic processes which enter into and exit the pathobiological cascade at different time points and for different lengths of time.
While this study presents a novel approach, it is not free of limitations. Having access to all the soc-iodemographic information for all the samples may have improved our model performance and enabled us to highlight any correlations between these in-teresting factors and particular metabolic variables. Secondly, having access to imaging and CSF bio-markers according to the NIA-AA research framework for defining AD [62] would also have been extremely useful to compare/include with our meta-bolomics analyses. Unfortunately, due to the cost-prohibitive nature of these tests and the limited budget available for these combined studies, we do not have all this information for all samples. Finally, while our results are encouraging, further validation work is required.
Conclusion
In summary, our group, for the first-time, have combined quantitative, targeted metabolomics data acquired using 1H NMR and DI-LC-MS/MS in-tegrated with several robust machine learning approaches to identify blood-based biomarkers for the detection of MCI and AD. We propose that perturbations in lipid metabolism may be integral to the evolution of AD neuropathology as well as to the eventual onset of AD. We believe that minimally invasive blood metabolite markers as presented herein could have future clinical utility for AD and MCI diagnosis. Based on these results, further work is warranted to validate our findings in a much larger cohort. Considering the fact that lipids are central for prediction and evaluation of AD neuropathology, intensive investigation of the entire brain and blood lipidome is warranted.
Footnotes
ACKNOWLEDGMENTS
We thank Emory Alzheimer’s Disease Research Center and Rush Alzheimer’s Disease Center for providing plasma samples. This work was partially funded by US National Institutes of Health grants R01AG030753, generous contributions made by the John and Marilyn Bishop Foundation and the Fred A. & Barbara M. Erb Foundation, and a Department of Defense grant (DOD W81XWH-09-1-0107) awarded to H.J.F.