
Abstract
Background:
Hypometabolism detected by fluorodeoxyglucose F18 positron emission tomography ([18F] FDG PET) is an early neuropathologic changes in Alzheimer’s disease (AD) and provides important pathologic staging information.
Objective:
This study aimed to discover genetic interactions that regulate longitudinal glucose metabolic decline in AD-related brain regions.
Methods:
A total of 586 non-Hispanic white individuals from the Alzheimer’s Disease Neuroimaging Initiative (ADNI) 1/GO/2 cohorts that met all quality control criteria were included in this study. Genome-wide association study of glucose metabolic decline in regions of interest (ROIs) was performed with linear regression under the additive genetic model.
Results:
We identified two novel variants that had a strong association with longitudinal metabolic decline in different ROI. Rs4819351-A in gene 1-acylglycerol-3-phosphate O-acyltransferase 3 (AGPAT3) demonstrated reduced metabolic decline in right temporal gyrus (p = 3.97×10⁻⁸, β= –0.016), while rs13387360-T in gene LOC101928196 demonstrated reduced metabolic decline in left angular gyrus (p = 1.69×10⁻⁸, β= –0.027).
Conclusion:
Our results suggest two genome-wide significant SNPs (rs4819351, rs13387360) in AGPAT3 and LOC101928196 as protective loci that modulate glucose metabolic decline. These two genes should be further investigated as potential therapeutic target for neurodegeneration diseases.
INTRODUCTION
Cerebral glucose hypometabolism measured by fluorodeoxyglucose F18 positron emission tomography ([18F] FDG PET) is an early biomarker of dementia, which superiors to a baseline clinical evaluation for years. It is used to distinguish different neurodegeneration diseases and investigate pre-symptomatic Alzheimer’s disease (AD) [1, 2]. Glucose metabolic decline can also predict the conversion from healthy aging to mild cognitive impairment (MCI), and from MCI to AD [3–5]. Moreover, enhanced glucose uptake in neurons have a strong neuroprotective effect in improving proteostasis [6]. Therefore, the molecular pathway associates with glucose hypometabolism may have close relation to disease progression.
Common genetic variations may affect the vulnerability to AD and other diseases by protect from or predispose to biological changes. Previous genome-wide association study (GWAS) of biomarkers including hippocampal atrophy, amyloid-β (Aβ), cerebrospinal fluid (CSF) tau have identified a number of significant variants and genes associated with AD endophenotype, which have revealed the mechanism of AD vulnerability to some extent and have provided an insight into AD therapy [7–9]. Although how AD pathology is influenced by metabolic decline is well established, findings on the genetic contributions to these changes are rare. The posterior cingulate cortex (PCC) is a central brain region coordinates memory and internal cognitive function, which correlates well with AD progression [10, 11]. Recent GWAS on glucose metabolic decline in PCC have identified single nucleotide polymorphism (SNP) in PPP4R3A gene which protects individuals from hypometabolism [12]. This study provides an insight into the pathology of glucose metabolism in brain, however, the genetic associations between glucose metabolic decline and vulnerability to AD in regions other than PCC remain unknown.
Pervious work using voxel-based approach demonstrates a typical AD hypometabolic pattern including the posterior cingulate cortex, inferior parietal lobe, inferior temporal gyrus, hippocampus and so on, which helps distinguish AD from other neurodegeneration diseases [13, 14]. Hence, genetic study on glucose metabolic decline of this pattern may identify more novel variants that would reveal the biological mechanisms of AD. The aim of our study was to discover common genetic variants associated with the longitudinal metabolic decline in AD-related brain regions. We performed a quantitative trait GWAS of longitudinal metabolic decline in AD-related brain regions measured by [18F] FDG PET and explored the effect of the significant SNPs on glucose metabolism.
METHODS
Participants details
All participants were enrolled from ADNI-1, ADNI-2, and ADNI–Grand Opportunity (GO) database (http://adni.loni.usc.edu). The ADNI was launched in 2003 as a public-private partnership, led by Principal Investigator Michael W. Weiner, MD. The ADNI was established to test whether serial magnetic resonance imaging, PET, other biological markers, and clinical and neuropsychological assessment can be combined to measure the progression of mild cognitive impairment and early AD. This was a re-analysis data available from shared data repositories. We restricted the analysis to participants who were non-Hispanic/Latino Caucasians with European ancestry. Only individuals that had at least two year longitudinal [18F] FDG PET data and genotype data available were included. This made up a total of 586 ADNI participants (AD = 67, MCI = 323, normal cognitive (NC) = 196; Table 1).
Demographic characteristics of ADNI participants
AD, Alzheimer’s disease; ADNI, Alzheimer’s Disease Neuroimaging Initiative; MCI, mild cognitive impairment; N, number; NC, normal cognition; SD, standard deviation.
Genotyping and quality control
The ADNI-1, ADNI-2, and ADNI–GO participants’ GWAS data were genotyped using blood DNA samples with three genotyping arrays: Illumina 610-Quad, Illumina-OmniExpress or Illumina HumanOmni2.5–4v1 [15]. Genotype data underwent standard quality control including sample exclusion for call rate >95%, SNP exclusion for call rate >95%, Hardy-Weinberg Equilibrium (HWE) of p > 1×10⁻⁶, Minor Allele Frequency (MAF) >0.08, identity checks, cryptic relatedness and genetic heterozygosity. The final data set included a total of 278,989 SNPs and 586 participants. Quality control was performed using PLINK 1.9 software. GWAS data was also used for obtaining the genotype information of significant SNPs in our follow-up analysis.
Imaging analysis
FDG-PET analysis data were obtained from UC Berkeley and Lawrence Berkeley National Laboratory. PET images were spatially normalized in Statistical Parametric Mapping (SPM) to the MNI PET template. In previous work by Jagust et al., [18F] FDG-PET scans were acquired and pre-processed using a meta-analytic approach where uptake in each regions of interest (ROIs) was normalized by uptake in pons/vermis reference region. This identified a set of five regions located in right and left angular gyri, bilateral posterior cingulate gyrus, and right and left middle/inferior temporal gyrus that were the most frequently associated regions in glucose metabolic changes with AD [16, 17]. All participants from ADNI-1, ADNI-2, and ADNI–GO with at least two years longitudinal [18F] FDG-PET data available were included. The annual metabolic decline based on follow-up measurements was used as phenotype in GWAS. The difference between the first [18F] FDG-PET data and two or three years later [18F] FDG-PET data, after dividing the duration years, was used to calculated the annual decline of glucose metabolic uptake in ROIs.
Statistical analysis
GWAS was performed using PLINK 1.9 software. The analysis was run using a linear regression under the assumption of an additive genetic model. Baseline age, gender, education attainment, baseline diagnosis, and APOE ɛ4 status as covariates were included in this module. We included APOE ɛ4 as a covariate to limit the effects on APOE ɛ4 genotype. The suggestive association threshold was p < 1×10⁻⁵ and the genome-wide significance threshold was p < 5×10⁻⁸, which was a more conservative and consensus threshold for genome-wide significance [18]. Significant SNPs that passed the genome-wide significant threshold would be further investigated. Regional association plots were created using LocusZoom while Manhattan plots and QQ plots were generated using the package “qqman” in R statistical software (Version 3.6.2). GWAS that identified significant SNPs were then rerun with CSF Aβ42 added as a covariate to exam whether amyloid status would change the results. CSF Aβ42 concentration was measured by Roche Elecsys electrochemiluminescence immunoassays and all CSF biomarker assays were performed in duplicate and averaged [19].
RESULTS
Demographic characteristics of ADNI participants
A total of 586 ADNI participants including 196 NC individuals, 323 MCI individuals, and 67 AD individuals was enrolled in GWAS of glucose metabolic decline in different ROI. Table 1 demonstrated the characteristics of included population. Using ANOVA method, no significant differences were found in gender (p = 0.731) between three diagnostic groups, while age (p = 1.83*10–7), education attainment (p = 0.001), and APOE ɛ4 genotype (p = 4.25*10–13) differed between groups. In order to reduce potential bias from population stratification, the multidimensional scaling (MDS) approach was conducted. ADNI participants demonstrated tight clustering with individuals of European ancestry in MDS plot (Fig. 1).
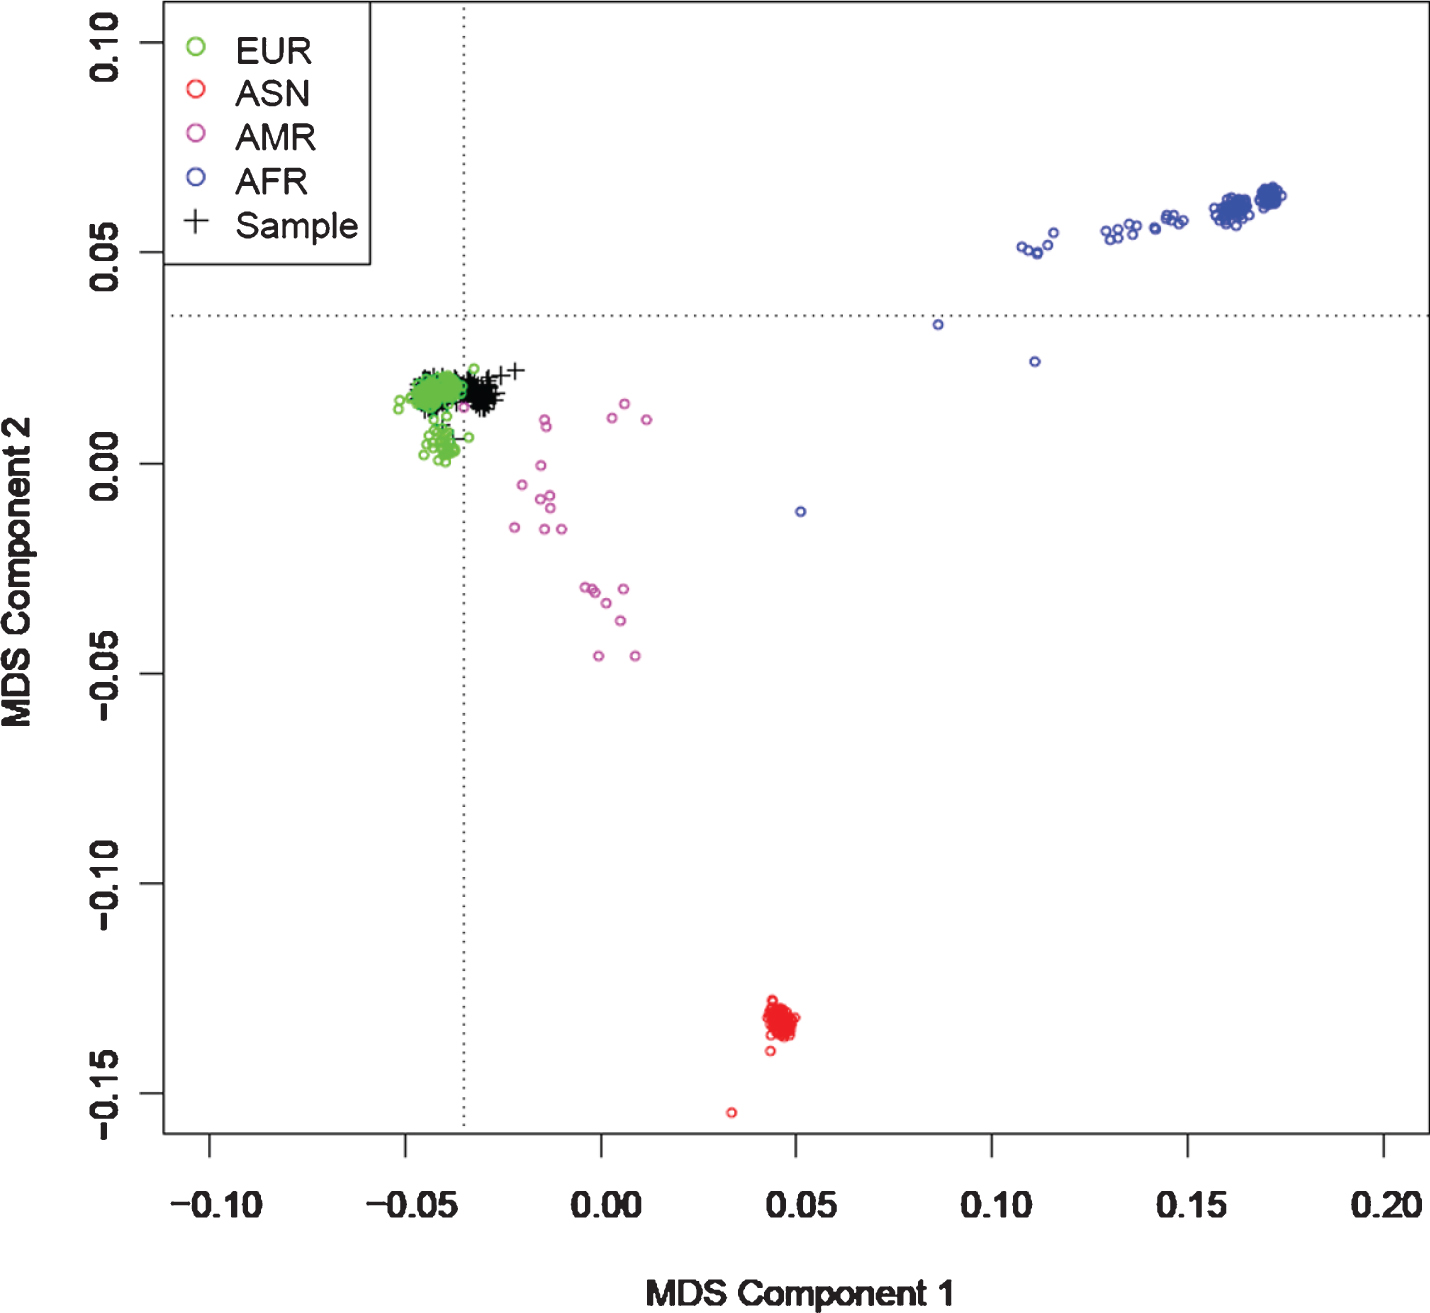
Multidimensional scaling (MDS) plot of the 1000 Genomes data against the ADNI data. The black crosses in the upper left part represent the participants of ADNI, the colored symbols represent the 1KG data (EUR, European; AFR, African; AMR, Ad Mixed American; ASN, Asian). The MDS plot demonstrated that all the participants involved in GWAS were from European ancestry.
GWAS identified two variants associated with longitudinal metabolic decline in different ROI
There was a total of 22 SNPs passed the suggestive threshold (p < 1×10⁻⁵), among them, 4 SNPs was suggested to be associated with glucose metabolic decline in more than one region. The number of SNPs passed the suggestive threshold in right temporal gyrus, left temporal gyrus, bilateral posterior cingulate, right angular gyrus, and left angular gyrus was 11, 3, 3, 5, and 5, respectively. Only two SNPs passed the genome-wide significance threshold (p < 5×10⁻⁸), one was in right temporal gyrus and the other was in left angular gyrus.
The significant SNP in right temporal gyrus was rs4819351, an intronic variant located in the gene AGPAT3 on chr. 21q22.3 (Fig. 2A, MAF = 0.227, β= –0.016, p = 3.97×10⁻⁸). In addition, rs13387360 was located in the uncharacterized gene LOC101928196 on chr. 2p24.1 and demonstrated genome-wide significant with glucose metabolic decline in left angular region (Fig. 2B, MAF = 0.086, β= –0.027, p = 1.69×10⁻⁸). Regional analysis revealed no SNP was in high linkage disequilibrium (LD) with these two significant SNPs (Fig. 2C, D). Q-Q plots of right temporal gyrus and left angular region were conducted to see the comparison in observed and expected p values. Both genomic inflation factor λ were equal to 1.01, indicating no remarkable inflation of the observed p values (Fig. 2E, F). Top SNPs (rs6560488, rs11884740 and rs10795879) that had strong associations with glucose metabolic decline in other three ROIs were described in Table 2.

Results of GWAS for [18F] FDG PET longitudinal decline in ROIs. A) Manhattan plot demonstrating the results of the GWAS in right temporal gyrus. The blue line represents a suggestive association threshold (1×10⁻⁵) and the red line indicates the genome-wide association threshold (5×10⁻⁸). The rs4819351 in gene AGPAT3 passed the genome-wide significance threshold. B) Manhattan plot demonstrating the results of the GWAS in left angular gyrus. The rs13387360 in gene LOC101928196 passed the genome-wide significance threshold. C) Regional association plot demonstrating regional linkage disequilibrium for rs4819351 with other SNPs. D) Regional association plot demonstrating regional linkage disequilibrium for rs13387360 with other SNPs. E) Q-Q plot demonstrating the comparison in observed and expected p values of GWAS in right temporal gyrus. λ is the genomic control value. F) Q-Q plot demonstrating the comparison in observed and expected p values of GWAS in left angular gyrus.
Top SNPs associated with glucose metabolic decline in ROIs
CHR, chromosome; MAF, minor allele frequency; SNP, single nucleotide polymorphism.
Among the 586 participants in GWAS, 358 carried no minor alleles, 198 carried one minor allele, and 30 carried a pair of minor alleles at rs4819351. The number for rs13387360 was 492, 89, and 5, respectively. The homozygous minor allele group was the least reduction group in right temporal gyrus glucose metabolism while the homozygous wild-type group owned the largest decline scope (Fig. 3A). The homozygous minor allele group also demonstrated the highest and most stable [18F] FDG PET values over time, after adjusting for diagnose at baseline (Fig. 3C). The homozygous minor allele group of rs13387360 also demonstrated the least glucose metabolic decline in right angular region and the rs13387360-T carriers owned higher adjusted [18F] FDG PET values than non-carriers (Fig. 3B, D).
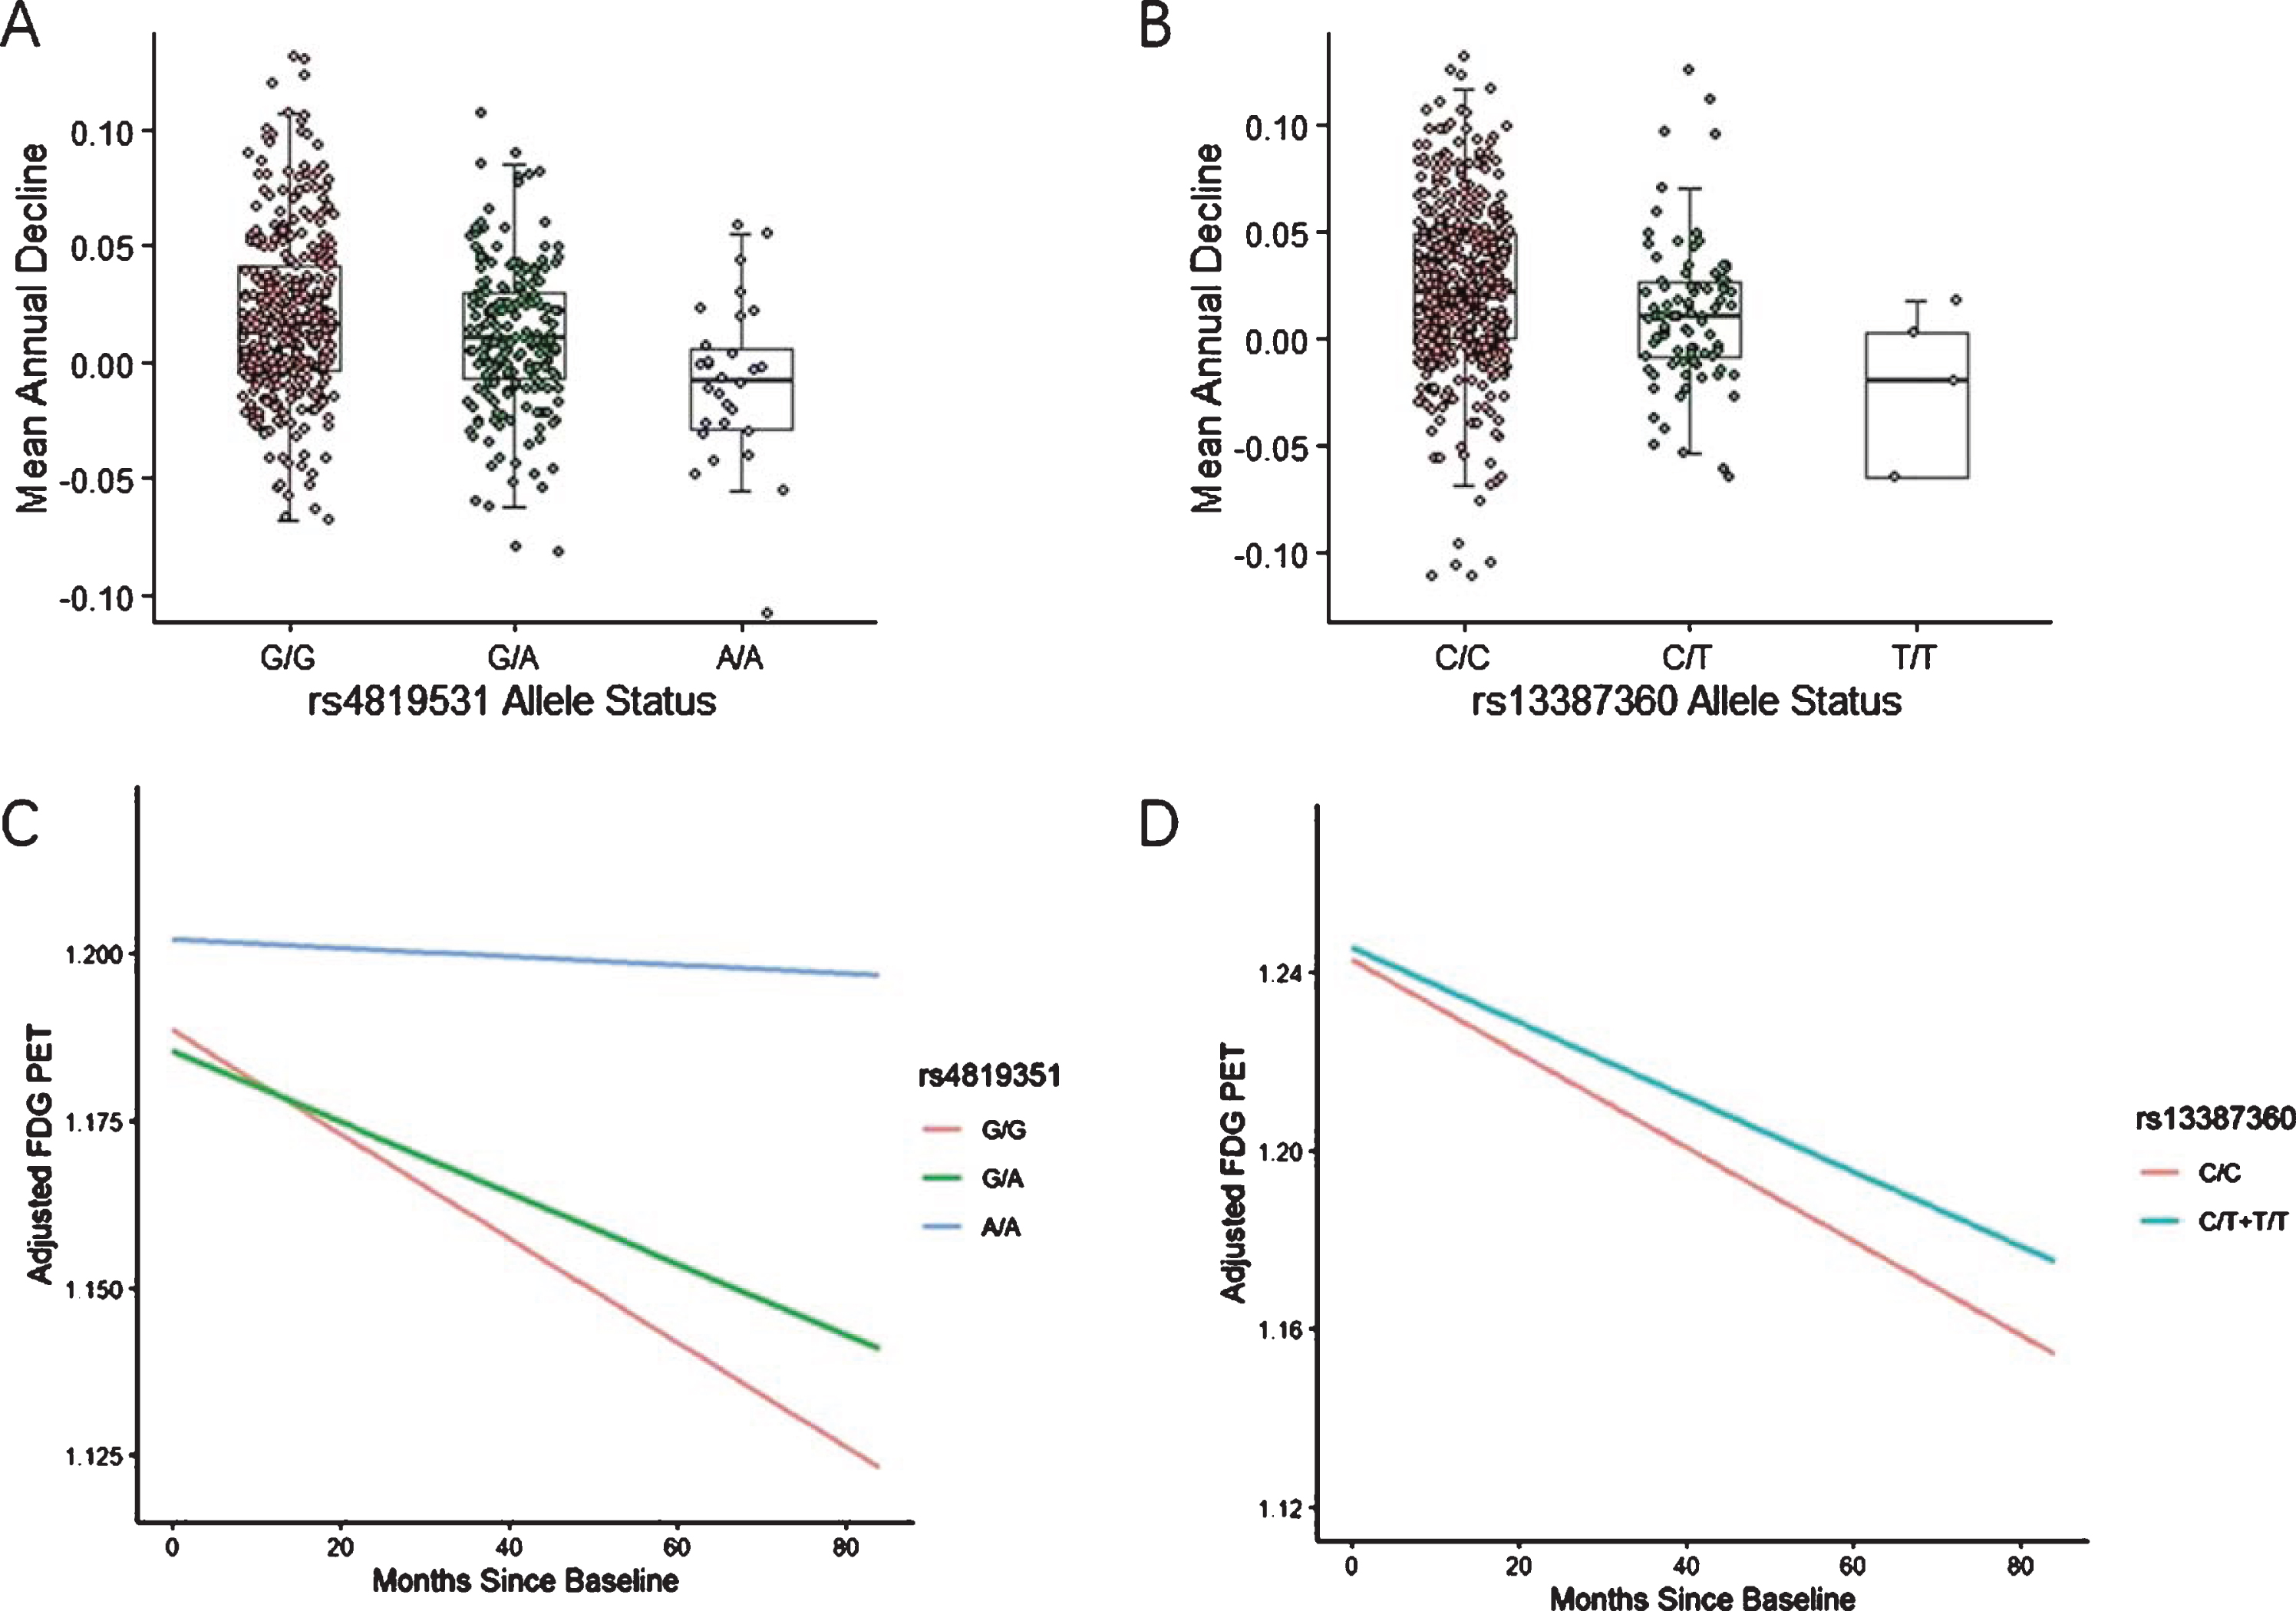
Longitudinal metabolic decline of the significant SNPs in ROIs. A) Annual decline in right temporal gyrus glucose metabolism by rs4819351 genotype. The A allele is associated with less decline in glucose metabolism. B) Annual decline in left angular gyrus glucose metabolism by rs13387360 genotype. The T allele is associated with less decline in glucose metabolism. C) Mean right temporal gyrus [18F] FDG PET over time by rs4819351 genotype, adjusted for diagnose at baseline. D) Mean left angular gyrus [18F] FDG PET over time in rs13387360-T carriers versus non-carriers, adjusted for diagnose at baseline.
Effect of amyloid status on significant SNPs
As models of AD pathophysiology theorize a temporal sequence where amyloidosis initiates a biological cascade that leads to neurodegeneration [20], we applied CSF Aβ42 as a covariate to account for heterogeneity caused by difference in amyloid status. The effect of rs13387360 in left angular region remained significant (β= –0.027, p = 1.42×10⁻⁸) and the effect of rs4819351 was quite strong (β= –0.016, p = 5.39×10⁻⁸) as well.
DISCUSSION
In this study, GWAS was performed to study the genetic contribution on cerebral glucose metabolic decline. The advantage of using all [18F] FDG PET ROIs as an endotype in the present study was that it identified more novel variants associated with glucose metabolism in specific regions. We demonstrated that less glucose metabolic decline was associated with rs4819351-A in right temporal gyrus as well as rs13387360-T in left angular gyrus, and the results remained stable when amyloid status was taken into account. These results suggested that rs4819351 in gene AGPAT3 and rs13387360 in gene LOC101928196 embodied a protective effect on AD pathology by preserving brain glucose uptake.
As previous study has identified a protective effect of rs2273647 on hypometabolism in PCC region [12] and the two genetic loci demonstrated in our study was found to be associated with reduced glucose metabolic decline in different regions, the regional specificity may be one breakthrough to understand the significant SNPs’ effect on the underlying AD pathology. The glucose uptake measured by FDG PET demonstrates a sex-related difference in different regions [21], which may be due to the effect of estrogen on glucose metabolism [22]. Similarly, the region specificity of the identified genetic variants can be potentially explained by the different biological functions of the related gene and its biochemistry pathway to glucose metabolism. Moreover, both rs4819353 (p = 9.20×10⁻⁷) and rs13387360 (p = 1.97×10⁻⁶) passed the suggestive threshold in right angular gyrus, which suggested that the role of significant SNPs on glucose metabolism is more an overall effect rather than restricted to a single region.
AGPAT3, also known as LPAAT3, is identified as one of the AGPAT family enzymes that catalyzes the conversion of lysophosphatidic acid (LPA) to phosphatidic acid (PA). PA is a signaling phospholipid as well as a precursor for the synthesis of various downstream glycerophospholipids [23, 24]. PA generation is regulated by insulin, however, increasing PA level contributes to inhabitation of insulin signaling [25, 26]. The dysfunction of cerebral insulin signaling pathway exacerbates neurodegeneration and synaptic loss, which exists before Aβ accumulation, implying its important role in cognitive impairment [27–29]. Higher expression level of AGPAT3 may help PA accumulation and break insulin signaling, which will result in reduced brain glucose uptake that linked to AD. Another possibility lies in the activated peroxisome proliferator-activated receptors (PPAR)-α which can both inhibit amyloidogenic pathway, tau hyperphosphorylation, neuroinflammation and regulate AGPAT3 mRNA [30, 31], the alterations in AGPAT3 may influence the impact of PPAR-α and thus affecting AD progression. Since glucose metabolic decline is an early biomarker for neurodegeneration, which is not specific to AD [13], AGPAT3 may be a protective factor to multiple neurodegeneration diseases. As oxidative stress is an important pathogenic factor that leads to reduced glucose metabolism in AD pathology [32], AGPAT3 may protect neuronal cells from oxidative damage. However, rs4819351 has not been reported on other GWAS and the association between AGPAT3 and neurodegeneration diseases remains unknown, further investigations will be needed to identify the exact mechanism of rs4819351 and AGPAT3 to disease vulnerability.
Although GWAS demonstrated a quite significant association of rs13387360 in gene LOC101928196 with left angular gyrus glucose metabolic decline, no relevant studies have revealed the possible function of gene LOC101928196 and no other GWAS have reported the association between rs13387360 and other phenotype. More understandings of the gene are needed to further study the role of this variant on AD progression.
Our study had few limitations. First, the number of SNPs used for this study was small due to lack of imputation. Since rs2273647 identified in GWAS of glucose metabolic decline in PCC is an imputed SNP [12], we were not able to validate this result. Second, age, education attainment, and APOE ɛ4 demonstrated linear relation with diagnose, which may cause bias to the result. We rerun the GWAS with diagnose excluded as covariate, the effect of rs13387360 was stronger (p = 9.47×10⁻⁹) and the effect of rs4819351 remained quite strong (p = 9.70×10⁻⁸). Third, although we used the largest sample of longitudinal metabolic decline data in ADNI, the sample size was relatively small in terms of genetic studies. We predicted that SNPs passed the suggestive threshold in five ROIs may show genome-wide significance with a lager sample size and more significant variants may be found with proper imputation. Finally, our results may not represent other races as the participants were restricted to European ancestry to avoid population stratification.
In conclusion, we detected two novel protective variants in gene AGPAT3 and LOC101928196 that associated with reduced glucose metabolic decline. Our findings detected the genetic contributions to cerebral glucose metabolism and explored a role of AGPAT3 in AD progression. While the biological pathway of AGPAT3 to AD vulnerability and the function of LOCI101928196 was unknown, the results suggested that a further study on these two genes may provide new insights into the prevention and therapeutic development of AD and other neurodegeneration diseases.
Footnotes
ACKNOWLEDGMENTS
This study was supported by grants from the National Natural Science Foundation of China (91849126), Shanghai Municipal Science and Technology Major Project (No.2018SHZDZX01) and ZHANGJIANG LAB, Tianqiao and Chrissy Chen Institute, and the State Key Laboratory of Neurobiology and Frontiers Center for Brain Science of Ministry of Education, Fudan University.
Data collection and sharing for this project was funded by the Alzheimer’s Disease Neuroimaging Initiative (ADNI) (National Institutes of Health Grant U01 AG024904) and DOD ADNI (Department of Defense award number W81XWH-12-2-0012). ADNI is funded by the National Institute on Aging, the National Institute of Biomedical Imaging and Bioengineering, and through generous contributions from the following: AbbVie, Alzheimer’s Association; Alzheimer’s Drug Discovery Foundation; Araclon Biotech; BioClinica, Inc.; Biogen; Bristol-Myers Squibb Company; CereSpir, Inc.; Cogstate; Eisai Inc.; Elan Pharmaceuticals, Inc.; Eli Lilly and Company; EuroImmun; F. Hoffmann-La Roche Ltd and its affiliated company Genentech, Inc.; Fujirebio; GE Healthcare; IXICO Ltd.; Janssen Alzheimer Immunotherapy Research & Development, LLC.; Johnson & Johnson Pharmaceutical Research & Development LLC.; Lumosity; Lundbeck; Merck & Co., Inc.; Meso Scale Diagnostics, LLC.; NeuroRx Research; Neurotrack Technologies; Novartis Pharmaceuticals Corporation; Pfizer Inc.; Piramal Imaging; Servier; Takeda Pharmaceutical Company; and Transition Therapeutics. The Canadian Institutes of Health Research is providing funds to support ADNI clinical sites in Canada. Private sector contributions are facilitated by the Foundation for the National Institutes of Health (![]() ). The grantee organization is the Northern California Institute for Research and Education, and the study is coordinated by the Alzheimer’s Therapeutic Research Institute at the University of Southern California. ADNI data are disseminated by the Laboratory for Neuro Imaging at the University of Southern California.
). The grantee organization is the Northern California Institute for Research and Education, and the study is coordinated by the Alzheimer’s Therapeutic Research Institute at the University of Southern California. ADNI data are disseminated by the Laboratory for Neuro Imaging at the University of Southern California.