
Abstract
Background:
The suggested association between severe obstructive sleep apnea (OSA) and risk of Alzheimer’s disease (AD) needs further study. Only few recent reports exist on associations between brain amyloid-β (Aβ) burden and severe OSA in middle-aged patients.
Objective:
Examine the possible presence of cortical Aβ accumulation in middle-aged patients with severe OSA.
Methods:
We performed detailed multimodal neuroimaging in 19 cognitive intact patients (mean 44.2 years) with severe OSA (Apnea-Hypopnea Index >30 h–1). Known etiological factors for possible Aβ accumulation were used as exclusion criteria. Aβ uptake was studied with [11C]-PiB-PET, glucose metabolism with [18F]-FDG-PET, and structural imaging with 3.0T MRI.
Results:
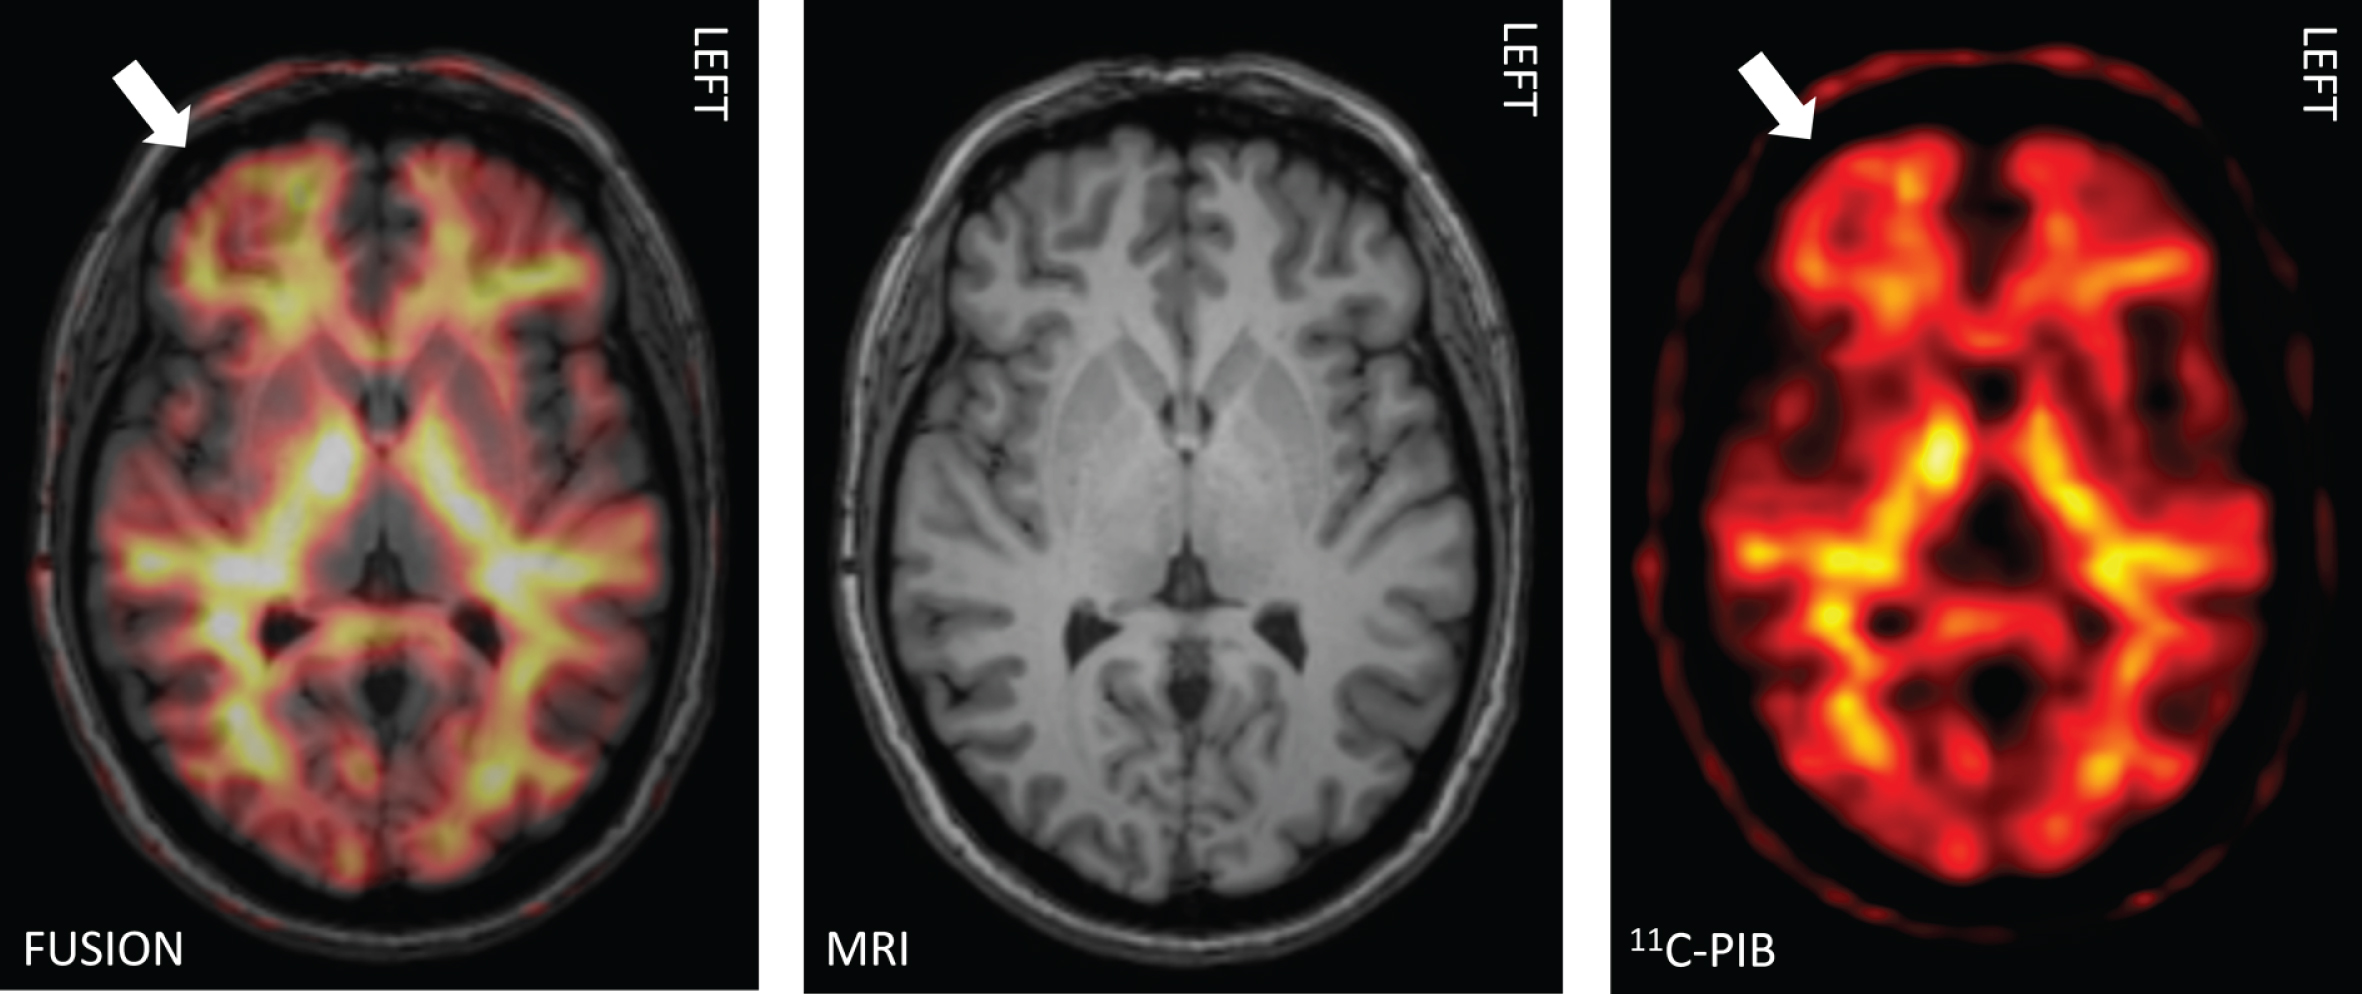
When analyzed individually, in [11C]-PiB-PET a substantial number (∼32%) of the patients exhibited statistically significant evidence of increased cortical Aβ uptake based on elevated regional Z-score values, mostly seen bilaterally in the precuneus and posterior cingulum regions. Cortical glucose hypometabolism in [18F]-FDG-PET was seen in two patients. MRI did not show structural changes suggestive of AD-related pathology.
Conclusion:
Increased [11C]-PiB uptake was seen in middle-aged cognitively intact patients with severe OSA. These findings are similar to those described in cognitive unimpaired older OSA patients. The changes in cortical Aβ uptake suggest that severe OSA itself may predispose to alterations related to AD already in middle-age. Aβ clearance may be compromised without simultaneous evidence of metabolic or structural alterations. The results emphasize the importance of early diagnostics and proper treatment of severe OSA in cognitively intact middle-aged subjects, possibly diminishing the individual risk for later cognitive dysfunction.
INTRODUCTION
Since the discovery of the brain’s glymphatic pathways [1], there have been several important observations that clearly related the quality and amount of sleep to the brain’s capacity to clear amyloid-β (Aβ) and other metabolic substances. Sleep deprivation may act as a risk factor of Alzheimer’s disease (AD) [2–4] via Aβ burden. Patients with obstructive sleep apnea (OSA) have poor quality of sleep, insufficient sleep, and chronic partial sleep deprivation. OSA exhibits also several daytime signs and symptoms [5]. The underlying brain mechanisms of various cognitive symptoms, such as impaired memory and attention are mostly unknown. Reports proposing a significant association between OSA and risk of AD [6–12] have highlighted the overlap of findings on Aβ burden in OSA, memory decline, and the possible risk of subsequent clinical AD.
Very recently, in cognitively unimpaired older adults (mean age 69.1 years) with OSA, amyloid depositions have been shown in posterior cingulate and precuneus regions [13]. However, evidence of possible similar depositions in much younger patients is lacking. We explored the possible presence of cortical Aβ accumulation in middle-aged patients with severe OSA with multimodal neuroimaging using [11C]-PiB-PET, [18F]-FDG-PET, and 3.0T magnetic resonance imaging (MRI). We carefully studied selected OSA patients to avoid known causes that could account for possible Aβ accumulation. This selected cohort of middle-aged patients should not exhibit increased Aβ uptake, but if present, it would support the deleterious effect of severe OSA itself on the development of Aβ burden.
METHODS
Participants
The cohort population was collected retrospectively from a routine diagnostic patient population from the years 2011–2018 that was evaluated at the Department of Clinical Neurophysiology at Kuopio University Hospital (KUH) due to a clinical suspicion of OSA. It consisted of 19 middle-aged patients, 5 females and 14 males (mean age 44.2 years, range 31–50 years, SD 5.8), with findings of severe OSA in their diagnostic respiratory polygraphy. Ambulatory home sleep apnea testing (HSAT) evaluations were conducted by using an Embletta polygraphic device (Natus Medical Inc., CA, USA) and RemLogic version 3.2 software (Embla Systems LCC, Broomfield, CO, USA). The following biosignals were recorded: airflow, heart rate, respiratory movements, and oxygen saturation. The respiratory polygraphic OSA diagnosis was based on routinely used guidelines (AASM 2012) [14] and manual analysis were made by an experienced physician with special knowledge of sleep disorders. Initially, medical records of all patients were reviewed, and then eligible patients were carefully selected to complete the aims of the present study. In the recruitment and the final enrollment for this study, we applied several inclusion criteria: 1) age 30–50 years, 2) no medical history of major neurological diseases (e.g., cognitive impairment, stroke, epilepsy, major head trauma with or without consciousness), 3) no history of psychiatric illness (e.g., depression, schizophrenia, bipolar disorders), 4) diabetes, when present, had to be in good treatment balance, 5) no use of medication influencing on the central nervous system (CNS) or any substance abuse, 6) no subjective or objective symptoms or signs of any cognitive difficulties, and 7) severe OSA (AHI, Apnea-Hypopnea Index >30 h–1) in diagnostic HSAT. Eligible patients were clinically evaluated with the Consortium to Establish a Registry for Alzheimer’s Disease Neuropsychological Battery (CERAD-NB) [15, 16]. In order to be applicable to the multimodal imaging, they had to reach normal results in the CERAD-NB evaluation.
Standards protocol approvals, registrations, and patient consents
The Ethics Committee of the Northern Savo Hospital district, Kuopio, Finland, approved the study which was performed in accordance with the Declaration of Helsinki. Written informed consent was obtained from all the subjects prior to any clinical and imaging studies, and the patients were also given detailed instructions for the multimodal imaging studies ([11C]-PiB-PET, [18F]-FDG-PET, and 3.0T MRI) and other examinations described here in details.
Clinical and neuropsychological evaluation
A venous blood sample for the APOE genotyping was obtained and genomic DNA was extracted using QIAamp DNA blood mini extraction kit (QIAGEN, Hilden, Germany). Cognition was examined using the Finnish version of the CERAD-NB [17]. Experienced neurologists and a psychologist who specializes in memory disorders evaluated the cognitive performances. For all the study patients, we also performed another routine HSAT between [11C]-PiB and [18F]-FDG-PET to determine the severity of OSA at the time of the imaging studies.
Imaging protocols, analyses, and preprocessing
Multimodal imaging was performed in a planned order in separate out-patient admissions at KUH. First, [11C]-PiB-PET was performed, then within two weeks [18F]-FDG-PET, and finally MRI within three months. In one patient, [18F]-FDG-PET was not performed due to the patient’s unsuitable personal timetable. Every patient was also personally contacted and briefly interviewed before and after every imaging admission.
Functional imaging
Synthesis of high molecular activity [11C]-PiB
The method optimization started with an initial specific activity of 10 GBq/umol (typically used as a limit for a clinical scan). With the described improvements, it was possible to reach a range from 110–190 GBq/umol (EOS n = 19) of molecular activity. The total synthesis time was 40 min including 6 min of aseptic dispensing in a class A isolator. The radiochemical purity was over 99.9%.
Imaging of Aβ uptake with [11C]-PiB
Each patient underwent a 30 min [11C]-PiB static PET scan 60 min after intravenous injection of in-house produced 550 MBq of [11C]-PiB. [11C]-PiB PET/CT scans were performed using a Siemens Biograph mCT PET/CT scanner (Siemens Healthcare, Erlangen, Germany). Computed tomography (CT) information was used for attenuation correction. Images were reconstructed on a 128×128 matrix using the ordered subsets expectation maximization (OSEM) iterative algorithm (4 iterations, 21 subsets, zoom 2, no post filter).
Imaging of cerebral glucose metabolism with [18F]-FDG
Within 2 weeks of the [11C]-PiB scans, a 15 min static PET scan was performed 60 min after intravenous injection of in-house produced 200 MBq of [18F]-FDG using a Siemens Biograph mCT PET/CT-scanner (Siemens, Knoxville, TN, USA). Patients were asked to fast 6 hours prior the [18F]-FDG-injection, and their blood glucose level was determined and confirmed as normal before injection. CT information was used for attenuation correction. Images were reconstructed on a 400×400 matrix using OSEM iterative algorithm (4 iterations, 21 subsets, Gaussian 3 mm post filter, zoom 2).
Analyses of PET-images
All [11C]-PiB and [18F]-FDG-PET images were analyzed at the individual level. Reconstructed PET images were also analyzed semi-quantitatively, resulting in Z-score values, with a commercial software CortexID Suite (GE Healthcare, Waukesha, WI, USA), using standardized uptake value (SUV) and comparing the findings to a dataset of healthy controls (for PiB: n = 75, 30 subjects <50 years; for FDG: n = 294, 38 subjects <48 years and 43 subjects 49–57 years) from material provided by the manufacturer. In addition, three-dimensional (3D) stereotactic surface projections were generated, and 16 ([11C]-PiB) or 24 ([18F]-FDG) regional Z-scores were calculated, respectively. Automated average Z-scores generated from CortexID Suite were calculated for the following software's predefined regions, i.e., for [11C]-PiB: prefrontal, anterior cingulate, precuneus/posterior cingulate, parietal, temporal lateral, occipital, sensorimotor, and temporal mesial lobes (see Figs. 1–3) and for [18F]-FDG: lateral and medial prefrontal, sensorimotor, anterior and posterior cingulate, precuneus, superior, and inferior parietal, occipital, primary visual, and lateral and mesial temporal lobes. The cerebellum was used as a reference region in the analyses.
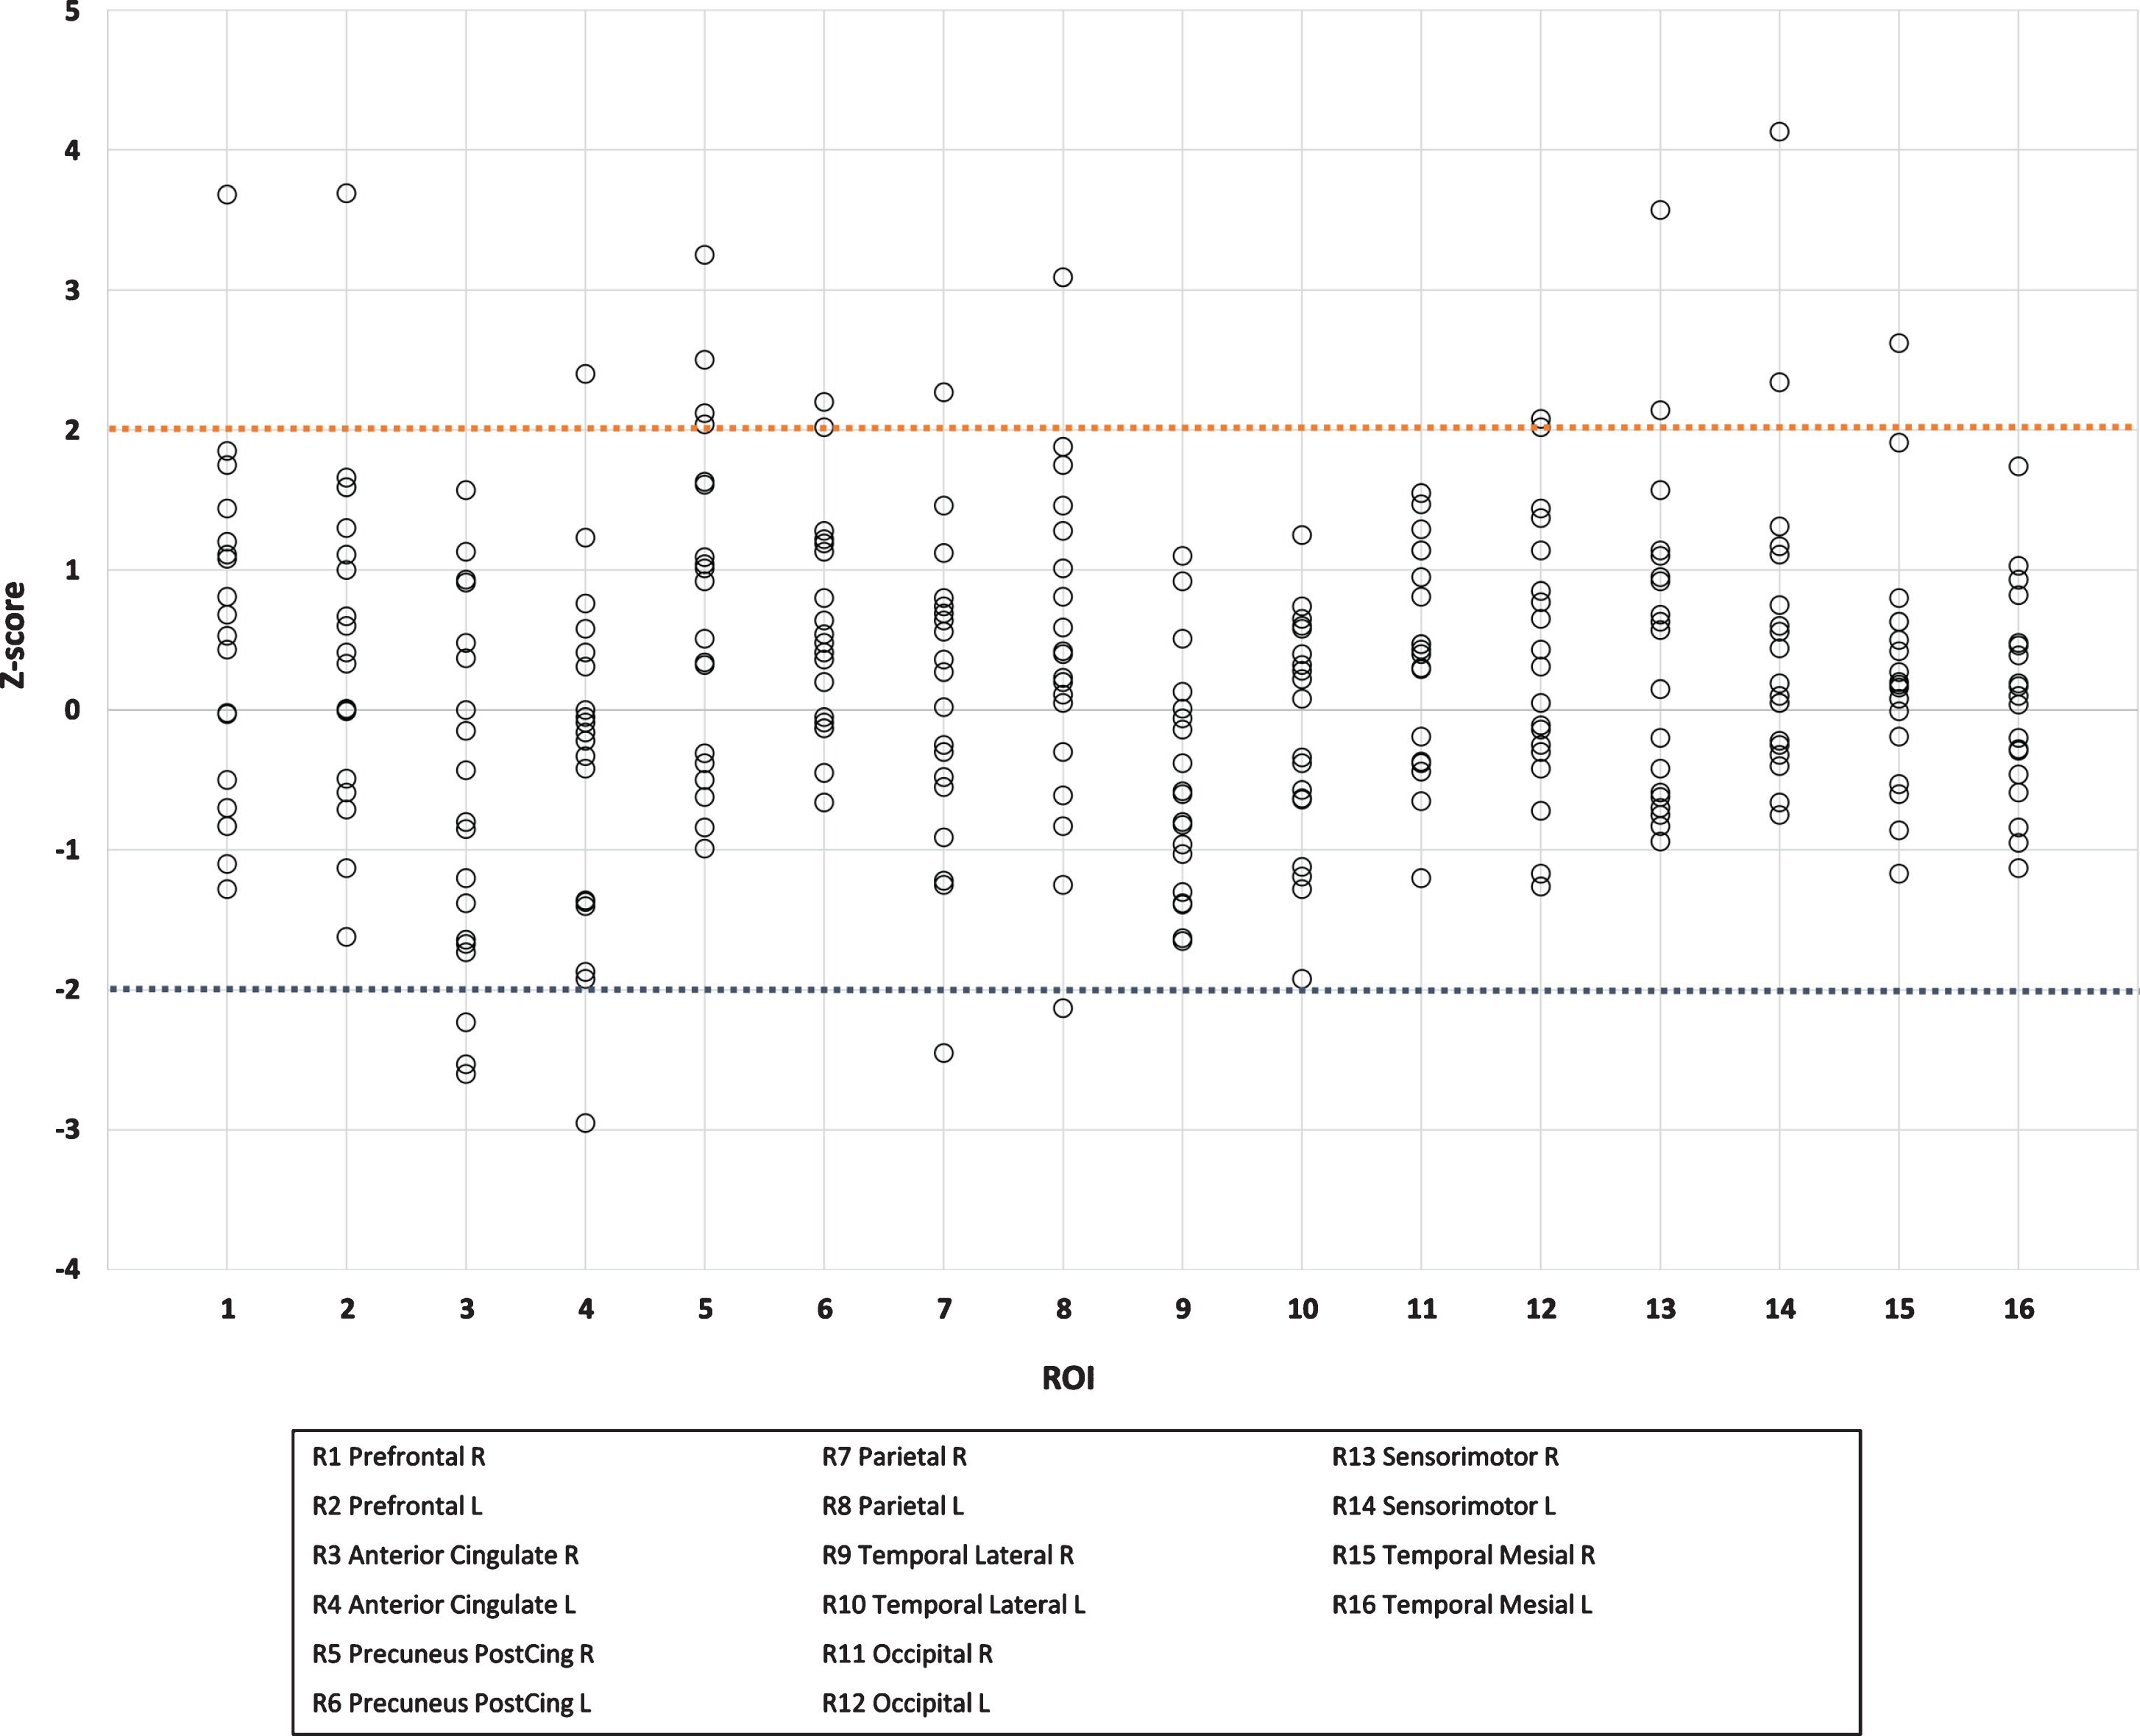
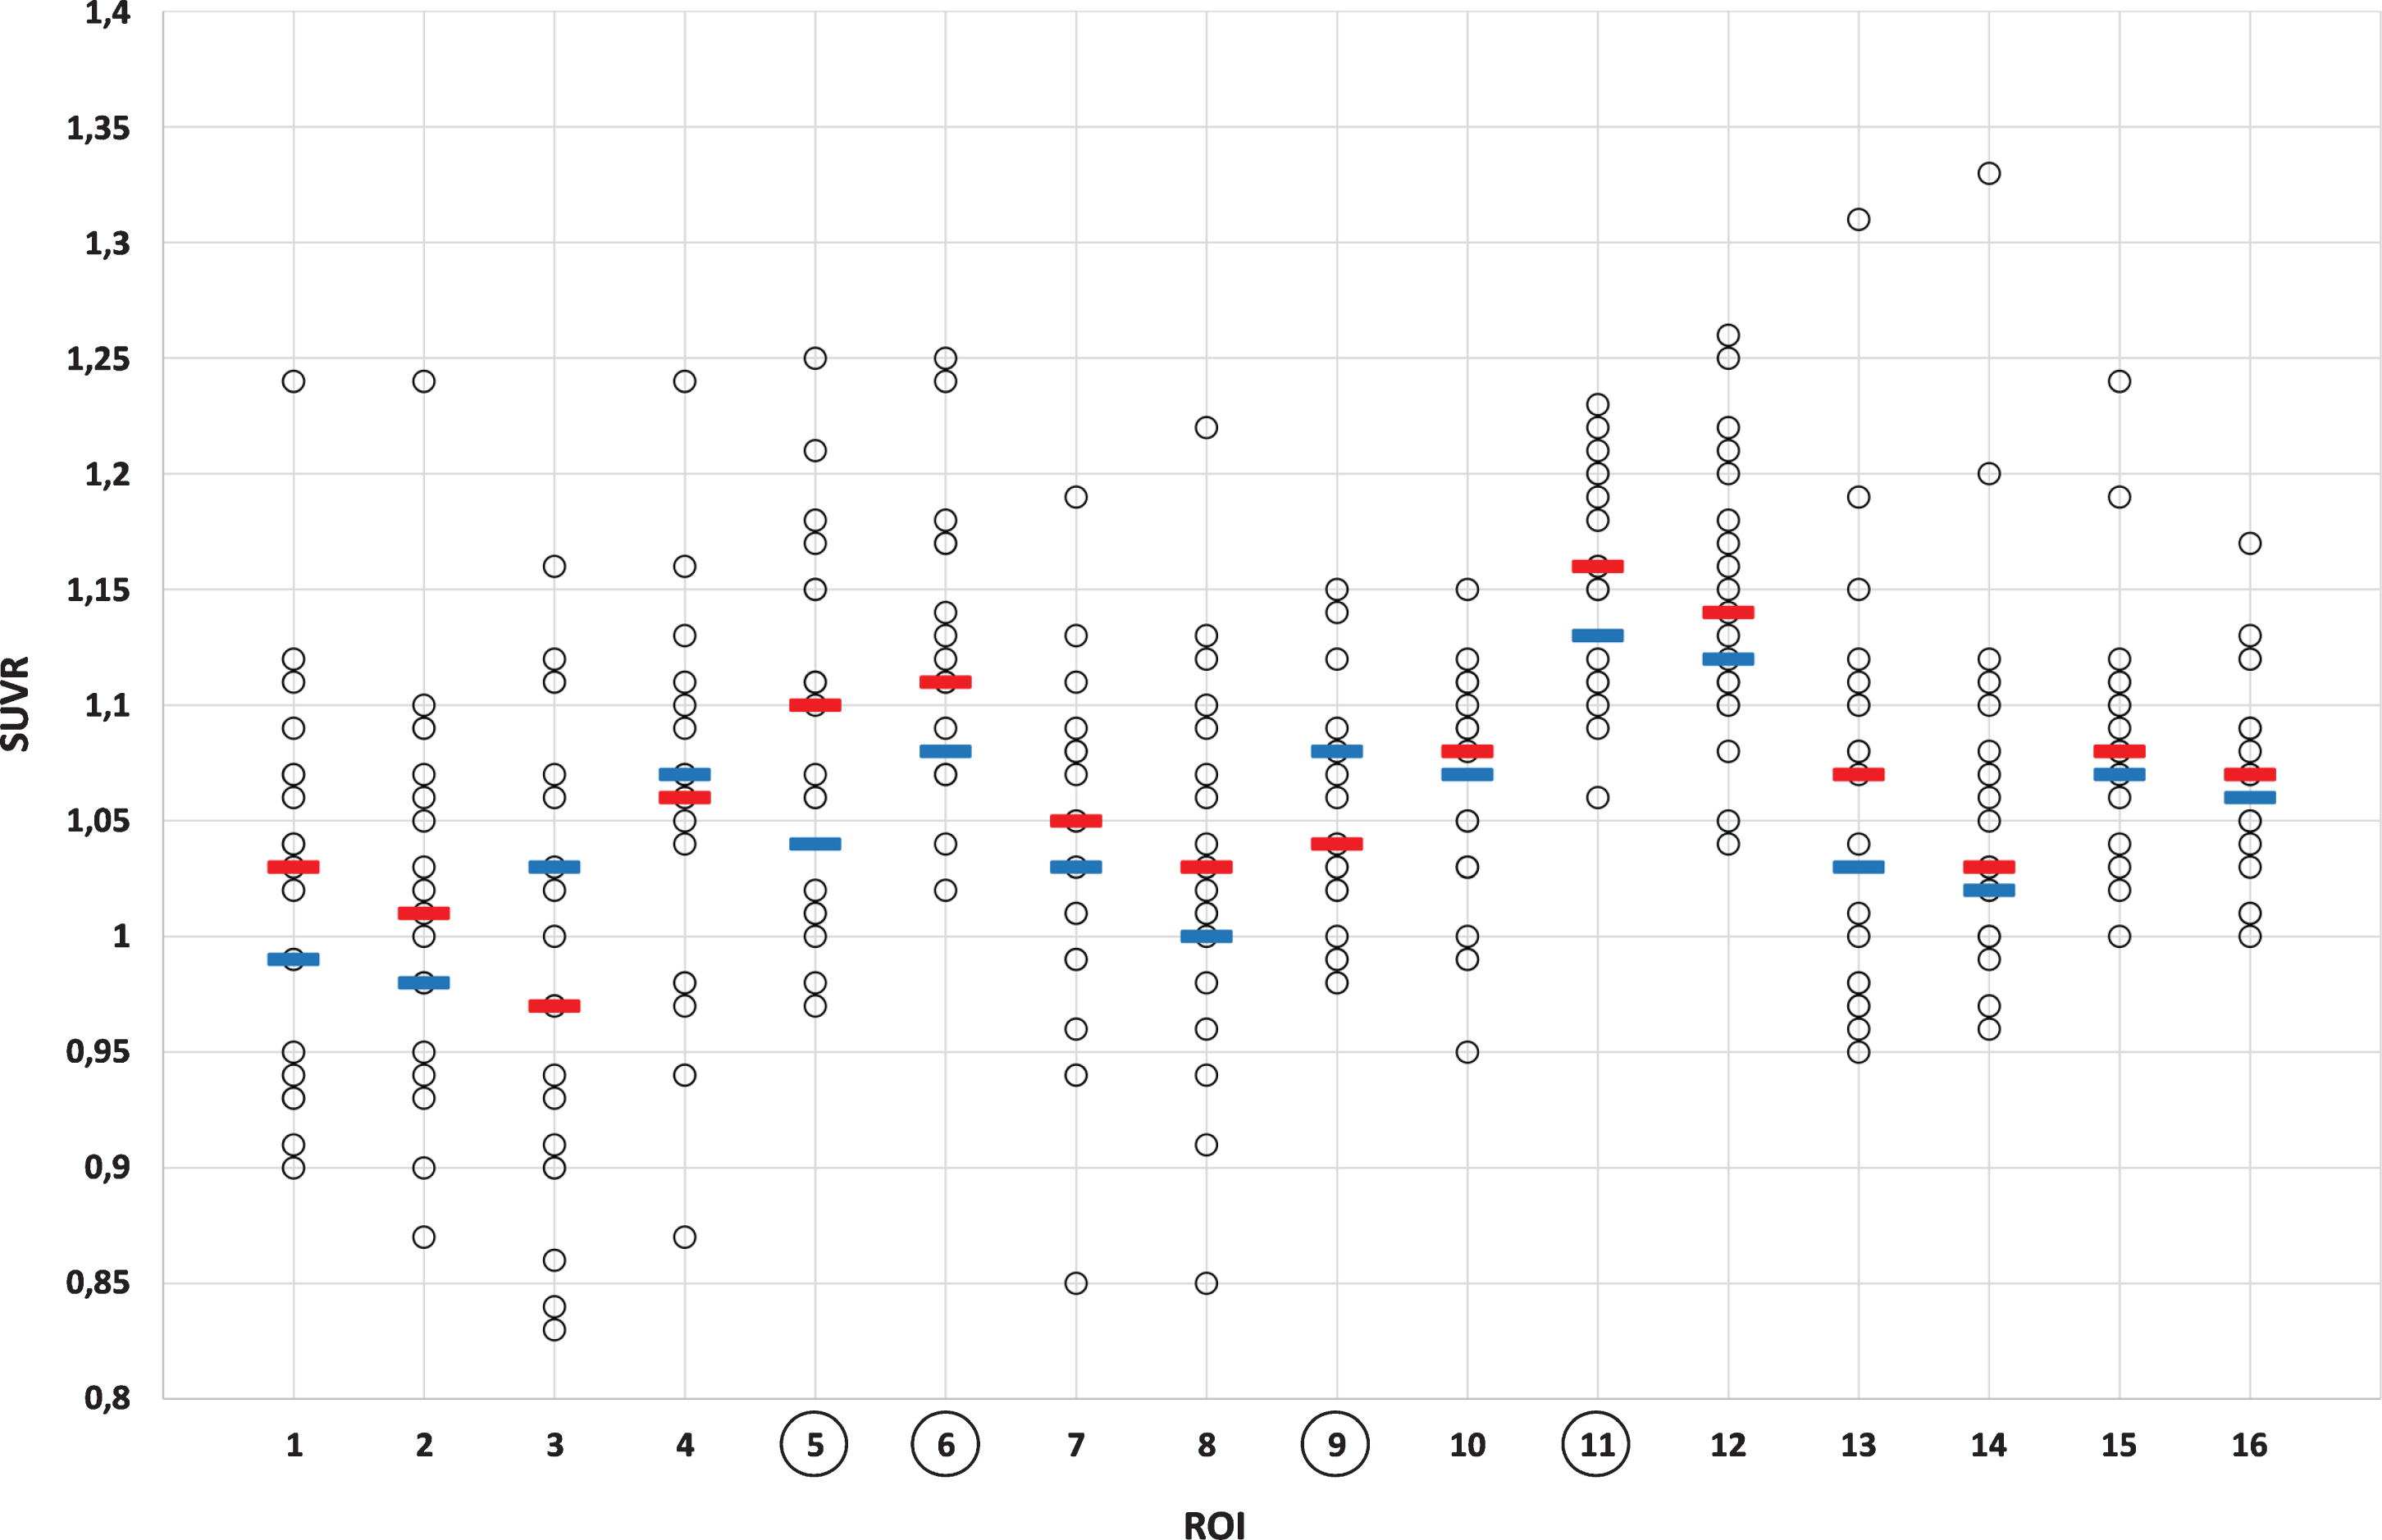
Increased Aβ uptake was considered present if the Z-score was greater than two. Moreover, relative standard uptake values (SUVR, cerebellum as a reference region) were obtained from CortexID Suite from the same regions. With cerebral glucose metabolism, a Z-score value lower than –2 was considered to represent regional hypometabolism. Exposure to radiation in PET imaging was: effective equivalent dose for [11C]-PiB 2.9 mSv and for [18F]-FDG-PET 5.8 mSv, respectively.
Structural imaging (MRI)
A 3.0T MRI scanner (Philips Achieva TX 3T; Best, The Netherlands) and an 8 channel head coil were used for structural imaging that included a 3D T1-weighted sequence (sagittal scan, 1.0 mm isotropic voxel), transaxial T2-weighted images (slice thickness of 3.0 mm, in plane resolution of 0.45 mm×0.45 mm), 3D fluid-attenuated inversion recovery (FLAIR) images (sagittal scan, 1.0 mm isotropic voxel), and susceptibility-weighted imaging (SWI; slice thickness of 1.0 mm, in plane resolution of 0.45 mm×0.45 mm). The high-resolution 3D T1-weighted images were also used as reference images for PET.
An experienced neuroradiologist evaluated all MR images for any abnormalities. The presence and severity of possible cortical or medial temporal lobe atrophy were evaluated from T1-weighted images according to a visual rating scale [18]. Presence of any periventricular or deep white matter lesions were assessed from FLAIR images using a semi-quantitative visual rating scale [19]. SWI was used to evaluate the presence of microbleeds.
Statistical analyses
Statistical significances in regional SUVR values were calculated using IBM© SPSS© Statistics, Version 26 (IBM Corporation, 2019) one sample t-test with regional expected value for the test value. p < 0.05 was considered statistically significant. The considerations on cohort sample size was based on recent studies with comparable sample sizes [20, 21].
Data availability
Data that support the findings of this study are available upon reasonable request from Imaging Center at Kuopio University Hospital, Finland.
RESULTS
Clinical and neuropsychological evaluation
The mean AHI at the time of OSA diagnosis was 54.2 h–1 (SD 19.7) and 31.6 h–1 (SD 23.2) at the time of imaging studies. The mean BMI was 35.9 kg/m2 (SD 8.7), and 13 of 19 patients received continuous positive airway pressure treatment (CPAP) after their diagnosis of OSA. The mean subjective estimation of the duration of sleep was 6.9 h/night (SD 0.95 h, range 4 to 9 h). In 4 of 19 patients APOE genotyping showed one ɛ4 risk allele and none of them had two ɛ4 alleles. All subjects had normal results in the CERAD-NB evaluation.
Functional imaging
[11C]-PiB-PET revealed evidence of statistically significant (p < 0.05) increased Aβ uptake in a sub-stantial number of patients. When assessed individually, increased cortical [11C]-PiB uptake (Z-score >2 in any of the regions of interest, ROIs) was found in 6 out of the 19 patients (Figs. 1 and 2, Table 1). Two of these 6 patients showed Z-scores above 3. Four of these 6 patients were treated with CPAP. The increased Aβ uptake was seen individually in precuneus/posterior cingulum regions (5/6), sensorimotor regions (2/6), and prefrontal, temporal mesial, anterior cingulum, and occipital regions (1/6 in all, respectively) (see Table 1). In four brain regions, the values of [11C]-PiB-PET Aβ uptake (SUVR) statistically significantly exceeded the expected values based on reference data (precuneus/posterior cingulum (right; p = 0.014, left; p = 0.008), temporal lateral right (p = 0.015), occipital right (p = 0.029), Fig. 3).
Individual Z-scores in amyloid-β positive patients in different brain regions
Six “amyloid-β positive” patients (uppermost horizontal row, patients 1 to 6) and their individual Z-score values of [11C]-PiB-PET in different brain regions (ROIs 1 to 16, vertical column). The Z-score values exceeding 2 indicate elevated uptake of tracer which also reflects higher amyloid-β burden in these brain regions. These values are bolded.
[18F]-FDG-PET showed evidence of regional hy-pometabolism in primary visual cortices in two patients, but no other cortical regions of hypo-metabolism were detected. When assessed individually, the regions of increased Aβ uptake (i.e., Z-score >2) and regions of hypometabolism were not the same. [18F]-FDG findings showed hypometabolism only in one patient with increased Aβ uptake.
Structural imaging (MRI)
In one, the MRI revealed moderately dilated lateral ventricles of probable congenital etiology, and one patient had a small (1.6 cm) arachnoid cyst. Two patients had small infarctions, one in the pons (6 mm) and one in the cerebellum (6 mm). Four patients had small punctate foci in deep WM (Fazekas Gradus 1), while the remaining 15 patients had no WM lesions or signs of microhemorrhages. None of the patients had signs of cortical or medial temporal lobe atrophy suggestive of AD-related types of structural abnormalities.
DISCUSSION
To the best of our knowledge, there are no previous studies at an individual level that demonstrate statistically significant regional cortical Aβ accumulation in a substantial number (∼32%) of cognitively intact middle-aged OSA patients. Our findings of increased [11C]-PiB uptake were, in general, slight and regional as compared with pronounced and widespread Aβ burden which is typically seen in AD. Most importantly, our results obtained with middle-aged OSA patients are in line with a very recent report in cognitively unimpaired older adults with OSA [13]. Thus, the present findings suggest that severe OSA itself may predispose to cerebral Aβ burden already in younger subjects. Also, our multimodal imaging revealed that Aβ depositions could be detected without simultaneous evidence of metabolic or structural alterations, since no significant glucose metabolism or structural changes that could be attributable to Aβ uptake findings were seen.
Aβ burden may be reversible [22, 23] and successful treatment of OSA may alleviate the Aβ burden [24, 25]. Recently, few PET studies have focused on Aβ burden in OSA [13, 27]. [11C]-PiB is known to have a strong binding to Aβ42 fibrils, but it also has one of the strongest bindings to soluble forms of Aβ among available Aβ tracers [28]. [11C]-PiB-PET studies in OSA are surprisingly sparse [20, 27]. Yun et al. [20] found in 19 subjects (mean age 58 years), as a group, higher [11C]-PiB deposition in the right posterior and temporal cortex; however, the number of [11C]-PiB positive individuals was not provided. Sharma et al. [27] showed mostly by CSF Aβ and in a subpopulation by [11C]-PiB-PET that OSA in cognitively normal subjects (aged from 55 to 90 years) was associated with longitudinal Aβ burden. Information on the number of [11C]-PiB-positive subjects at baseline was not provided. Handa et al. [21] found abnormal cortical Aβ accumulation in only 1 of their 14 OSA patients (mean age 65 years, range 50–86 years). Very recently, André et al. [13] showed with [18F]-Florbetapir-PET in cognitively unimpaired older adults (mean age 69.1 years) that as a group, those with OSA included greater amyloid depositions in the posterior cingulate and precuneus than those without OSA.
There is recent evidence on the dynamics of the evolving Aβ burden [29]. The first stages of amyloidosis (i.e., Aβ deposition) are shown to initially accumulate in the temporobasal and frontomedial brain areas, thereafter in associative neocortical regions, and finally at the striatum [30]. The authors suggested that this highly consistent hierarchy may be suitable to predict a regional sequence of Aβ deposition and thereby possibly be used as an individual marker of Aβ pathology [30]. They also emphasized a better Aβ deposition detection when more localized SUVR are used in contrast to global cortical SUVR. Accordingly, in addition to an individual assessment of increased Aβ uptake (i.e., Z-score values >2), we also calculated the patients’ Z-score values in group level in several predefined anatomical regions and compared these with reference data (CortexID Suite) of healthy controls. This was carried out to examine possible mean shifts in local Aβ uptake, where the individual Z-score values still remained below the level of 2. We did not obtain signs of Aβ uptake in temporobasal or frontomedial regions, but regional Aβ uptakes were most often seen in precuneus/posterior cingulum. These anatomical regions are the same where amyloid depositions have been observed in older adults using [18F]-Florbetapir-PET [13].
Our study cohort differed significantly from those in these previous studies. We specifically aimed to study middle-aged (mean age 44.2 years, range 31–50 years) patients with severe OSA (mean Apnea-Hypopnea Index 54.2 h–1), that were neurologically intact and did not exhibit any memory complaints or evidence of cognitive decline, excluding possible confounding/explaining factors that could generate or promote possible Aβ burden, such as increased age or impaired cognition. Furthermore, the APOE ɛ4 genotype was determined since it is the greatest genetic risk factor to AD. Four of our 19 patients had one ɛ4 risk allele. Based on this study one ɛ4 allele seems not to be a significant risk factor to Aβ accumulation at young age, since only one out of four patients with one ɛ4 allele showed an increased Aβ uptake. This was in line with evidence showing that APOE has variable effects on Aβ dynamics and deposition [31]. Unexpectedly, a significant amount (∼32%) of our patients showed statistically significant regional gray matter Aβ depositions as defined by Z-scores higher than 2. More importantly, it is not yet clear if proper and effective treatment of severe OSA may postpone the development of later Aβ burden. Interestingly, there were no differences in the appearance of Aβ depositions whether these patients were treated with CPAP (4/6) or not.
The association between body mass index (BMI) and OSA is well known which is also clearly visible in our study cohort. Mean BMI was 35.9 kg/m2 in the whole cohort and 43.2 kg/m2 in Aβ positive population. Both obesity (high BMI) and OSA are individual risk factors to developing AD [8, 11]. The BMI has a biphasic relationship: earlier in the course of the disease, high BMI is found to be a risk factor for late development of dementia, but within 10 years of diagnosis of dementia BMI is inversely correlated with Aβ. Whether OSA or BMI has bigger influence to later AD is unknown and needs further investigation [32–34].
In previous [18F]-FDG-PET studies of OSA, reduced cerebral/cortical metabolism has been described bilaterally and prefrontally in, for example, the precentral gyrus and cingulate cortex [35]. The cortical hypometabolism has also been associated with areas with structural gray matter loss [36]. Contrary to these previous studies, most of our patients did not show any hypometabolic areas, as evidence of occipital hypometabolism was seen in only two patients. Our patients were younger and had a slighter Aβ burden compared with older patients in the cited studies. However, the seemingly intact glucose metabolism in cognitively intact middle-aged OSA patients with evidence of increased Aβ uptake is important to acknowledge.
Limitations
Our patient population was relatively small. How-ever, it was comparable to similar previous [11C]-PiB-PET studies of Yun et al. [20] (N = 19) and Handa et al. [21] (N = 14), thus in our opinion the current results are representative. CERAD is commonly used for neuropsychological evaluation in older persons (age >60). It is a validated screening method for detecting early cognitive disturbances especially in AD, and it is more sensitive than the Mini-Mental State Exam. Using CERAD in this age group for neuropsychological evaluation was considered adequate and sufficient.
Conclusion
The current study adds significant new data on the current concept of the dynamics and sequelae of Aβ deposition in OSA. Most importantly, the present findings of increased cortical amyloid uptake were obtained with younger and healthier patients than in previous similar studies. The increased amyloid depositions are located in the same AD-sensitive anatomical regions where they can be seen in much older adults. The current study supports the recently described anatomical locations for amyloid uptake in OSA and extends further these observations by emphasizing that such findings can exist already in significantly younger subjects.
DISCLOSURE STATEMENT
Authors’ disclosures available online (https://www.j-alz.com/manuscript-disclosures/20-0736r1).