
Abstract
Background:
Fluid intelligence (FI) involves abstract problem-solving without prior knowledge. Greater age-related FI decline increases Alzheimer’s disease (AD) risk, and recent studies suggest that certain dietary regimens may influence rates of decline. However, it is uncertain how long-term food consumption affects FI among adults with or without familial history of AD (FH) or APOE4 (ɛ4).
Objective:
Observe how the total diet is associated with long-term cognition among mid- to late-life populations at-risk and not-at-risk for AD.
Methods:
Among 1,787 mid-to-late-aged adult UK Biobank participants, 10-year FI trajectories were modeled and regressed onto the total diet based on self-reported intake of 49 whole foods from a Food Frequency Questionnaire (FFQ).
Results:
Daily cheese intake strongly predicted better FIT scores over time (FH-: β= 0.207, p < 0.001; ɛ4–: β= 0.073, p = 0.008; ɛ4+: β= 0.162, p = 0.001). Alcohol of any type daily also appeared beneficial (ɛ4+: β= 0.101, p = 0.022) and red wine was sometimes additionally protective (FH+: β= 0.100, p = 0.014; ɛ4–: β= 0.59, p = 0.039). Consuming lamb weekly was associated with improved outcomes (FH-: β= 0.066, p = 0.008; ɛ4+: β= 0.097, p = 0.044). Among at risk groups, added salt correlated with decreased performance (FH+: β= –0.114, p = 0.004; ɛ4+: β= –0.121, p = 0.009).
Conclusion:
Modifying meal plans may help minimize cognitive decline. We observed that added salt may put at-risk individuals at greater risk, but did not observe similar interactions among FH- and AD- individuals. Observations further suggest in risk status-dependent manners that adding cheese and red wine to the diet daily, and lamb on a weekly basis, may also improve long-term cognitive outcomes.
Keywords
INTRODUCTION
Normal aging is characterized by relatively modest loss in verbal memory and crystallized intelligence, which encompasses facts, experiences, and use of prior experience to inform actions. By contrast, progressive decline occurs in raw processing speed and higher-order cognitive domains, such as executive function [1]. Executive function consists of distinctive, multi-component processes such as response inhibition, attention, judgment, and regulation of other cognitive domains [2], which typically peaks in the late teens and shows decline in mid- and late life [3, 4]. The most adversely affected executive function by age is arguably fluid intelligence (FI), which is the capacity for abstract reasoning and problem-solving without background information [5].
Alzheimer’s disease (AD) is a global public health concern [6] in part because executive function deficits often occur in concert with progressive learning and memory deficits [7]. Additionally, otherwise asymptomatic carriers of AD genetic risk factors like apolipoprotein E ɛ4 allele (APOE4), or a parental family history (FH) of AD, tend to show neural changes and cognitive decline [8–11]. Observing changes in executive function over time in normal aging versus genetically at-risk adults may offer valuable insight into subtle cognitive impairments that may serve as early cognitive markers of AD [12]. Likewise, examining modifiable lifestyle factors that impact FI would be useful for future hypothesis testing.
Recently, lifestyle modification therapies, such as the Mediterranean-Dietary Approaches to Stop Hypertension Intervention for Neurodegenerative Delay (MIND) diet, have been associated with slower cognitive decline and reduced incidence of AD [13, 14]. More cortical thickness in temporal and frontal areas relevant to AD is also seen in non-demented adults who maintain a higher adherence to a Mediterranean diet, which is rich in plant foods and sources of healthy fats, and low in red meats that are not lean [15]. Thus, improving one’s dietary practices in mid- or late-life may be beneficial for preserving cognition [16]. Importantly, APOE4 status or parental FH of AD may modify how a food is related to cognition over time. For example, semi-weekly consumption of fatty fish was more protective against dementia among non-APOE4 carriers [17]. Until we have an effective therapeutic strategy to modulate AD [18], targeting specific aspects of one’s diet may be a potential preventative strategy to consider in the meantime.
Our main objectives in this study were to examine: 1) associations between 10-year FI score trajectories and self-reported whole food intake within a holistic context of the entire diet, in contrast to modeling a priori-defined dietary patterns or individual nutrients and 2) how genetic risk factors (APOE4+ versus APOE4–; FH+ versus FH–) could moderate those associations. We considered FI over other cognitive domains because a factor analytic study using UK Biobank demonstrated that FI was the best performing measure to describe prefrontal cortex-related variation in cognition [19].
METHODS
Cohort
Participants were a part of the UK Biobank study [20]. This prospective cohort study collected baseline data in a half million individuals from 22 assessment centers located in the United Kingdom, starting in 2006. As noted in Supplementary Figure 1, a total sample of 1,929 participants were available. Each participant had baseline measurements taken between 2006 and 2010, when genetic, cognitive, and dietary data were collected. A visit to the assessment center involved six consecutive steps: 1) consent, 2) touchscreen questionnaire, 3) verbal interview, 4) eye measures, 5) physical measures, and 6) blood/urine sample collection. The touchscreen questionnaire collected sociodemographic, lifestyle, cognitive function, and family history of illness data. Informed consent to participate was given at baseline. Longitudinal assessments are ongoing in a subset of participants, as illustrated in Supplementary Figure 2. The UK Biobank protocol was approved by the North West MultiCentre Research Ethics Committee. Participants were aged 46 to 77 years old at the completion of this study.
Longitudinal measurement of fluid intelligence
Participants completed the Fluid Intelligence Test (FIT) as part of a touchscreen questionnaire at baseline and two follow-up assessments (2006–2010, 2012–2013, and 2015–2016). The FIT score is quantified by how many numeric, logic, and syntactic questions (out of 13 total questions) that participants were able to answer correctly within two minutes [19].
Assessment of long-term total diet consumption
Participants answered questions about their food and alcohol consumption as part of a touchscreen questionnaire at baseline and two follow-up assessments (2006–2010, 2012–2013, and 2014). Our methodology is focused on the entire diet because we do not consume individual nutrients or foods in isolation. Modeling the total diet captures the multidimensionality of what we eat while also bypassing problems associated with multiple testing and correlations that exist among different foods. By modeling the entire diet, we also avoid bias associated with methods of scoring predefined dietary patterns [21].
The Food Frequency Questionnaire inquired about their intake of fresh fruit, dried fruit, raw vegetables and salad, cooked vegetables, oily fish, lean fish, processed meat, poultry, beef, lamb, pork, cheese, bread, cereal, tea and coffee, beer and cider, red wine, white wine and champagne, and liquor. Bread, cereal, fruit, and vegetable responses were recorded in integer units (slices per week, bowls per week, pieces per day, and tablespoons per day, respectively). Intakes of meat, fish, and cheese responses were recorded as dichotomous variables (“less than once a week”, “once a week”, “two to four times a week”, “five or six times a week”, “once or more daily”, “never”). Alcohol consumption responses were recorded by type as an average weekly intake (in pints for beer and cider, glasses for red and white wine and champagne, and measures for liquor). Frequency of alcohol intake was also recorded as dichotomous variables (“daily or almost daily”, “three or four times a week”, “once or twice a week”, “special occasions only or never”). Tea and coffee intake were recorded in integer units of cups per day, and did not distinguish between caffeinated or decaffeinated coffee, nor black or green tea. Bread and cereal intake categories were combined to estimate total grain intake. Fresh and dried fruit intake categories were combined to estimate total fruit intake. Raw and cooked vegetable intake categories were combined to estimate total vegetable intake.
Considerations of medical exclusion criteria
Many conditions, particularly in midlife to late-life adults with obesity, are related to chronic systemic inflammation, which may influence cognitive function. Consequently, to explore if these conditions influenced initial model fitting, we excluded participants with International Classification of Diseases, Tenth Revision (ICD-10) codes reflecting a systemic inflammatory condition in their medical record since 2007. Examples included most diseases of the digestive system (XI), such as ulcerative colitis (K51) or diverticulitis (K57); chronic lower respiratory diseases (J40–J47); and malignant neoplasms of the digestive organs (C15–C26). However, because our results did not significantly differ based on these exclusion criteria, data from these participants were included in our final models. We also initially excluded participants who had any cerebrovascular disease (I60–I69) or disorder of the nervous system (G00–G99). However, our pattern of results did not significantly differ based on these excluded participants. Consequently, data from these participants were included in the final models as well.
Genetic factors: APOE and AD family history
All UK Biobank genome-wide association study (GWAS) data have been processed as previously described [20]. Briefly, APOE haplotype was determined using allele variation on rs429358 and rs7412 [22]. APOE was further stratified as whether participant has at least one ɛ4 allele (ɛ2/ɛ4, ɛ3/ɛ4, and ɛ4/ɛ4) or not at all (ɛ2/ɛ2, ɛ2/ɛ3, and ɛ3/ɛ3). AD family history was classified according to the participants’ self-report responses of the presence or absence of AD in their family history on the touchscreen questionnaire. Specifically, participants were queried about family history via the question, “Has/did your father/mother ever suffer from:”, followed by a list of chronic diseases, including ‘Alzheimer’s disease/dementia.’
Covariates
To account for confounding demographics and other lifestyle variables, models controlled for education, sex, social-economic stratification as defined by Townsend Deprivation Index, body mass index (BMI), and tobacco use. Education was separated into three dichotomous variables and coded as whether they had the following or not: college or higher qualifications; post-secondary or vocational; and secondary. Townsend Deprivation Index is a standardized score that reflects poverty as measured by material deprivation in a population per zip code [23]. Tobacco smoking indicated who has never smoked, used to smoke, and who is currently a smoker.
Longitudinal modeling
For FIT, we used difference equations to compute each individual’s linear change over time (velocity) to enhance model fit [24]. FIT baseline values and velocity were modeled together as a cognitive trajectory outcome using structural equation modeling (SEM) to test how dietary parameters influence the trajectory of cognitive decline throughout the range of age observed here. For dietary predictors, a mean was computed among the three observations to estimate the total amount consumed for each product [25]. These methods have demonstrated superior goodness-of-fit, increasing testing power, and elucidating relationships between variables more robust by capturing both within- and between-subject variation over time [26–29].
Outlier analysis
To ensure that these models were generalizable to at least 99% of the sample population, 1% quantiles were computed for each variable, and 604 participants beyond 99% of the sample distribution of the mean among any variable were removed from further analysis.
Group-stratified structural equation models
SEM was conducted using lavaan package from R 3.4.1 (R Foundation for Statistical Programming, Vienna, Austria) [30]. Graphs were prepared in ggplot2 3.1.1 [31]. Four separate SEMs were built to identify differences in the associations between cognitive trajectory and diet: 1) Family History Negative; 2) Family History Positive, 3) APOE4 Negative, and 4) APOE4 Positive participants.
Variable selection
An empirical model-building approach was employed to select the most salient variables that predicted FI for each subgroup. In this backward elimination approach a full, “all variables in” model was built, and the least significant variable was removed one at a time until all variables remaining reached p < 0.10.
SEM parameter estimation, ANOVA, and uncertainty analysis
Standardized parameter estimates (β), which were interpreted as the change in outcome variable per standard deviation change in the predictor, were estimated using maximum likelihood. ANOVA was reported as the overall portion of variation in FI trajectory scores that is explained (R2). Uncertainty analysis relied upon standard errors and p-value estimates, where results were considered statistically significant at p < 0.001 (***), p < 0.01 (**), and p < 0.05 (*) and trending up to p = 0.010 (#). Only participants with at least two observations for FIT scores, and one observation for diet and covariates, were considered for analysis. To maintain an empirical and data-driven analysis, no missingness imputation was utilized.
Post-hoc analysis of influential observations
To assess whether any observations were driving the results, the Cook’s Distance was calculated for each model (APOE4–, APOE4+, FH–, and FH+). The largest values were 0.04, 0.037, 0.041, and 0.036, respectively. As no values >1.0 were noted, we made no further adjustments to the models.
Post-hoc sensitivity analysis
Given the sample size and number of predictors (as recorded in Supplementary Table 1), and no a priori hypotheses (“two-tails”), GPower 3.1 estimated the smallest effect which could be detected, while minimizing type I error to α= 0.05, and type II error to β= 0.10, β= 0.05, and β= 0.01.
RESULTS
Demographics and data summaries
The demographics for APOE and FH subgroups were presented in Table 1. There was slight male majority across all four subgroups. Across groups, most participants were highly educated. We did not observe major differences between groups in BMI, FI score at baseline, nor Townsend Deprivation Index.
Data summary stratified by APOE subgroups and Family History Factors
The values are mean±SD unless stated otherwise. y, years; BMI, body mass index
Covariate effects on fluid intelligence scores
We examined differences of dietary effect on FI based on APOE haplotype (ɛ4 carriage versus non-carriage) or family history of AD. Aside from food, those who attended college or post-college consistently had strong positive significant association with FI at baseline regardless of APOE4 status, as well as family history (p < 0.001).
Associations with diet by genetic factors subgroups
The standardized beta estimates are presented in Table 2. For APOE4 status, both non-carriers (APOE4–) and especially carriers (APOE4+) showed increased baseline levels of FI with daily cheese (APOE4–: p = 0.008; APOE4+: p = 0.001) at baseline, but no relation was observed over time (see Fig. 1). Though among APOE4+ only, there was a positive association between FI and weekly cheese over time (p = 0.025). Daily alcohol consumption was related to greater FI at baseline among only APOE4+ (p = 0.023) (see Fig. 2). Greater red wine consumption was related to increased FI at baseline in APOE4–(p = 0.039). Conversely, decreased FI was seen in APOE4–with daily vegetable consumption (p = 0.023) over time, while for APOE4+ usually salting showed worse FI scores (p = 0.009) over time (see Fig. 3).
Standardized Estimates of predictors on fluid intelligence by APOE4 status
*p < 0.05, **p < 0.01, ***p < 0.001.
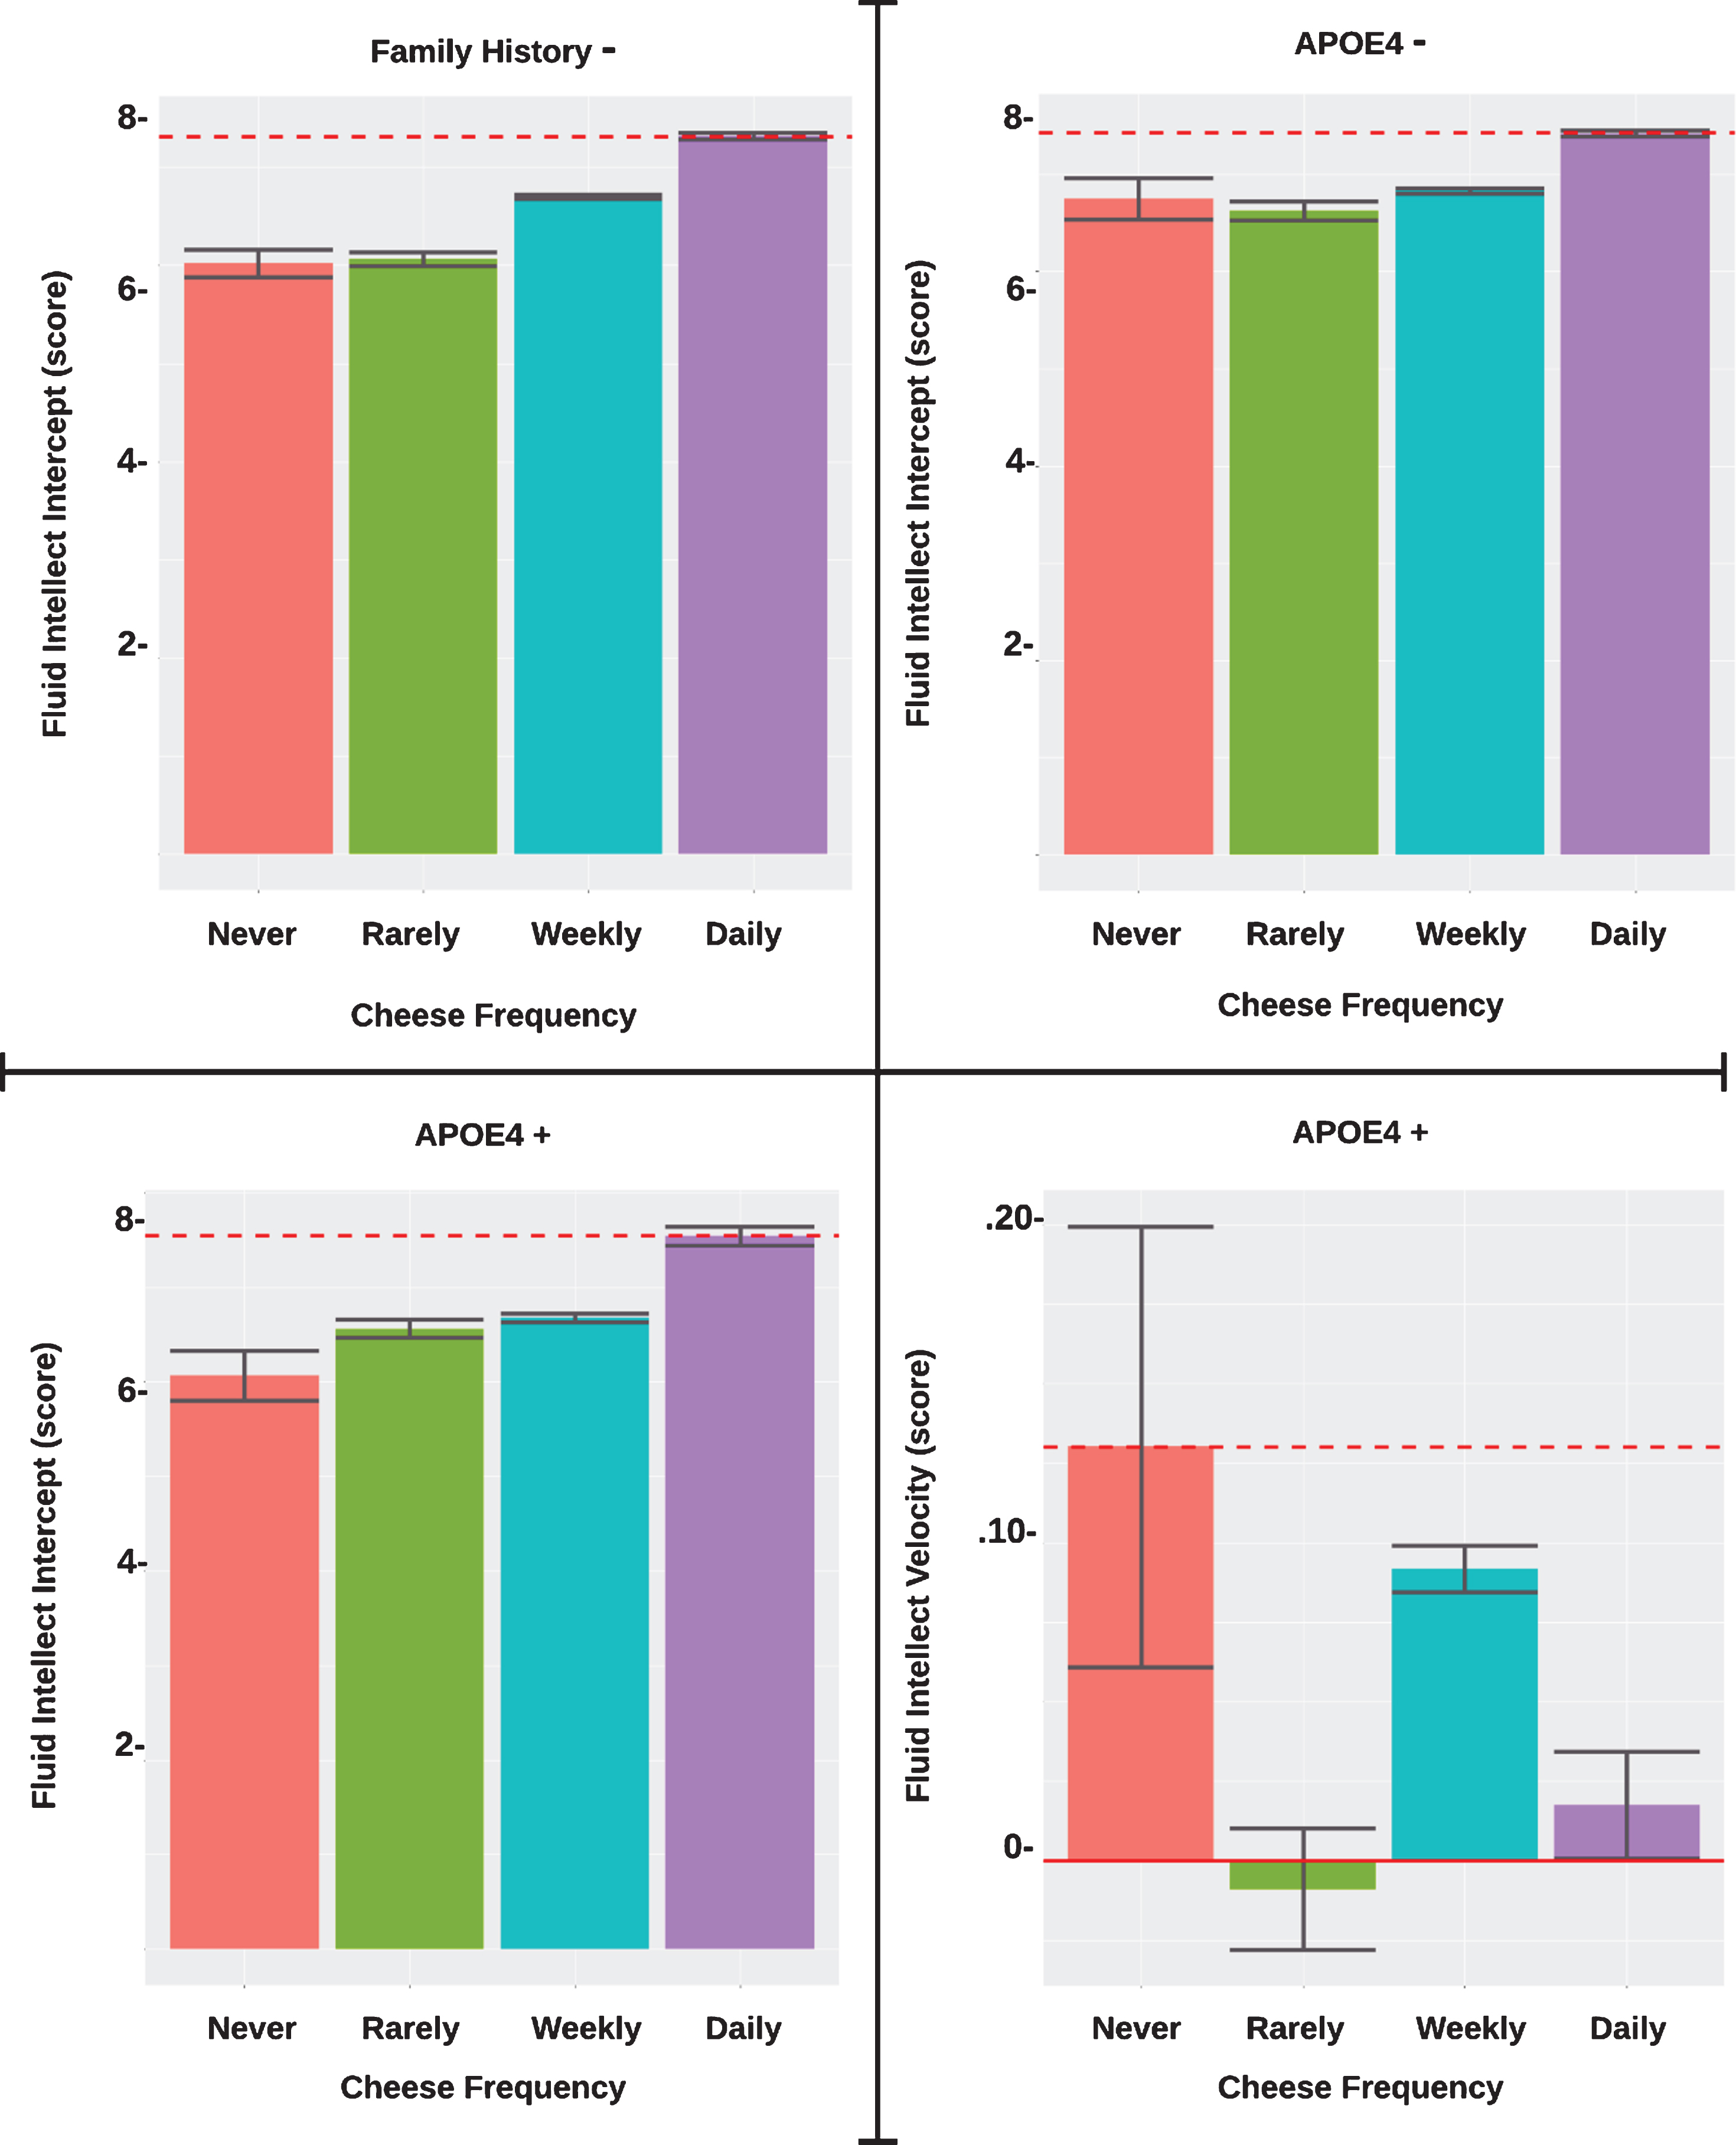
Association of cheese frequency on fluid intellect by FH and APOE4 subgroup. Velocity is linear change over time. In the barplots, the red dotted lines represent the group with best performing fluid intellect score at baseline or change-over-time, and the error bars represent the 95% confidence interval.
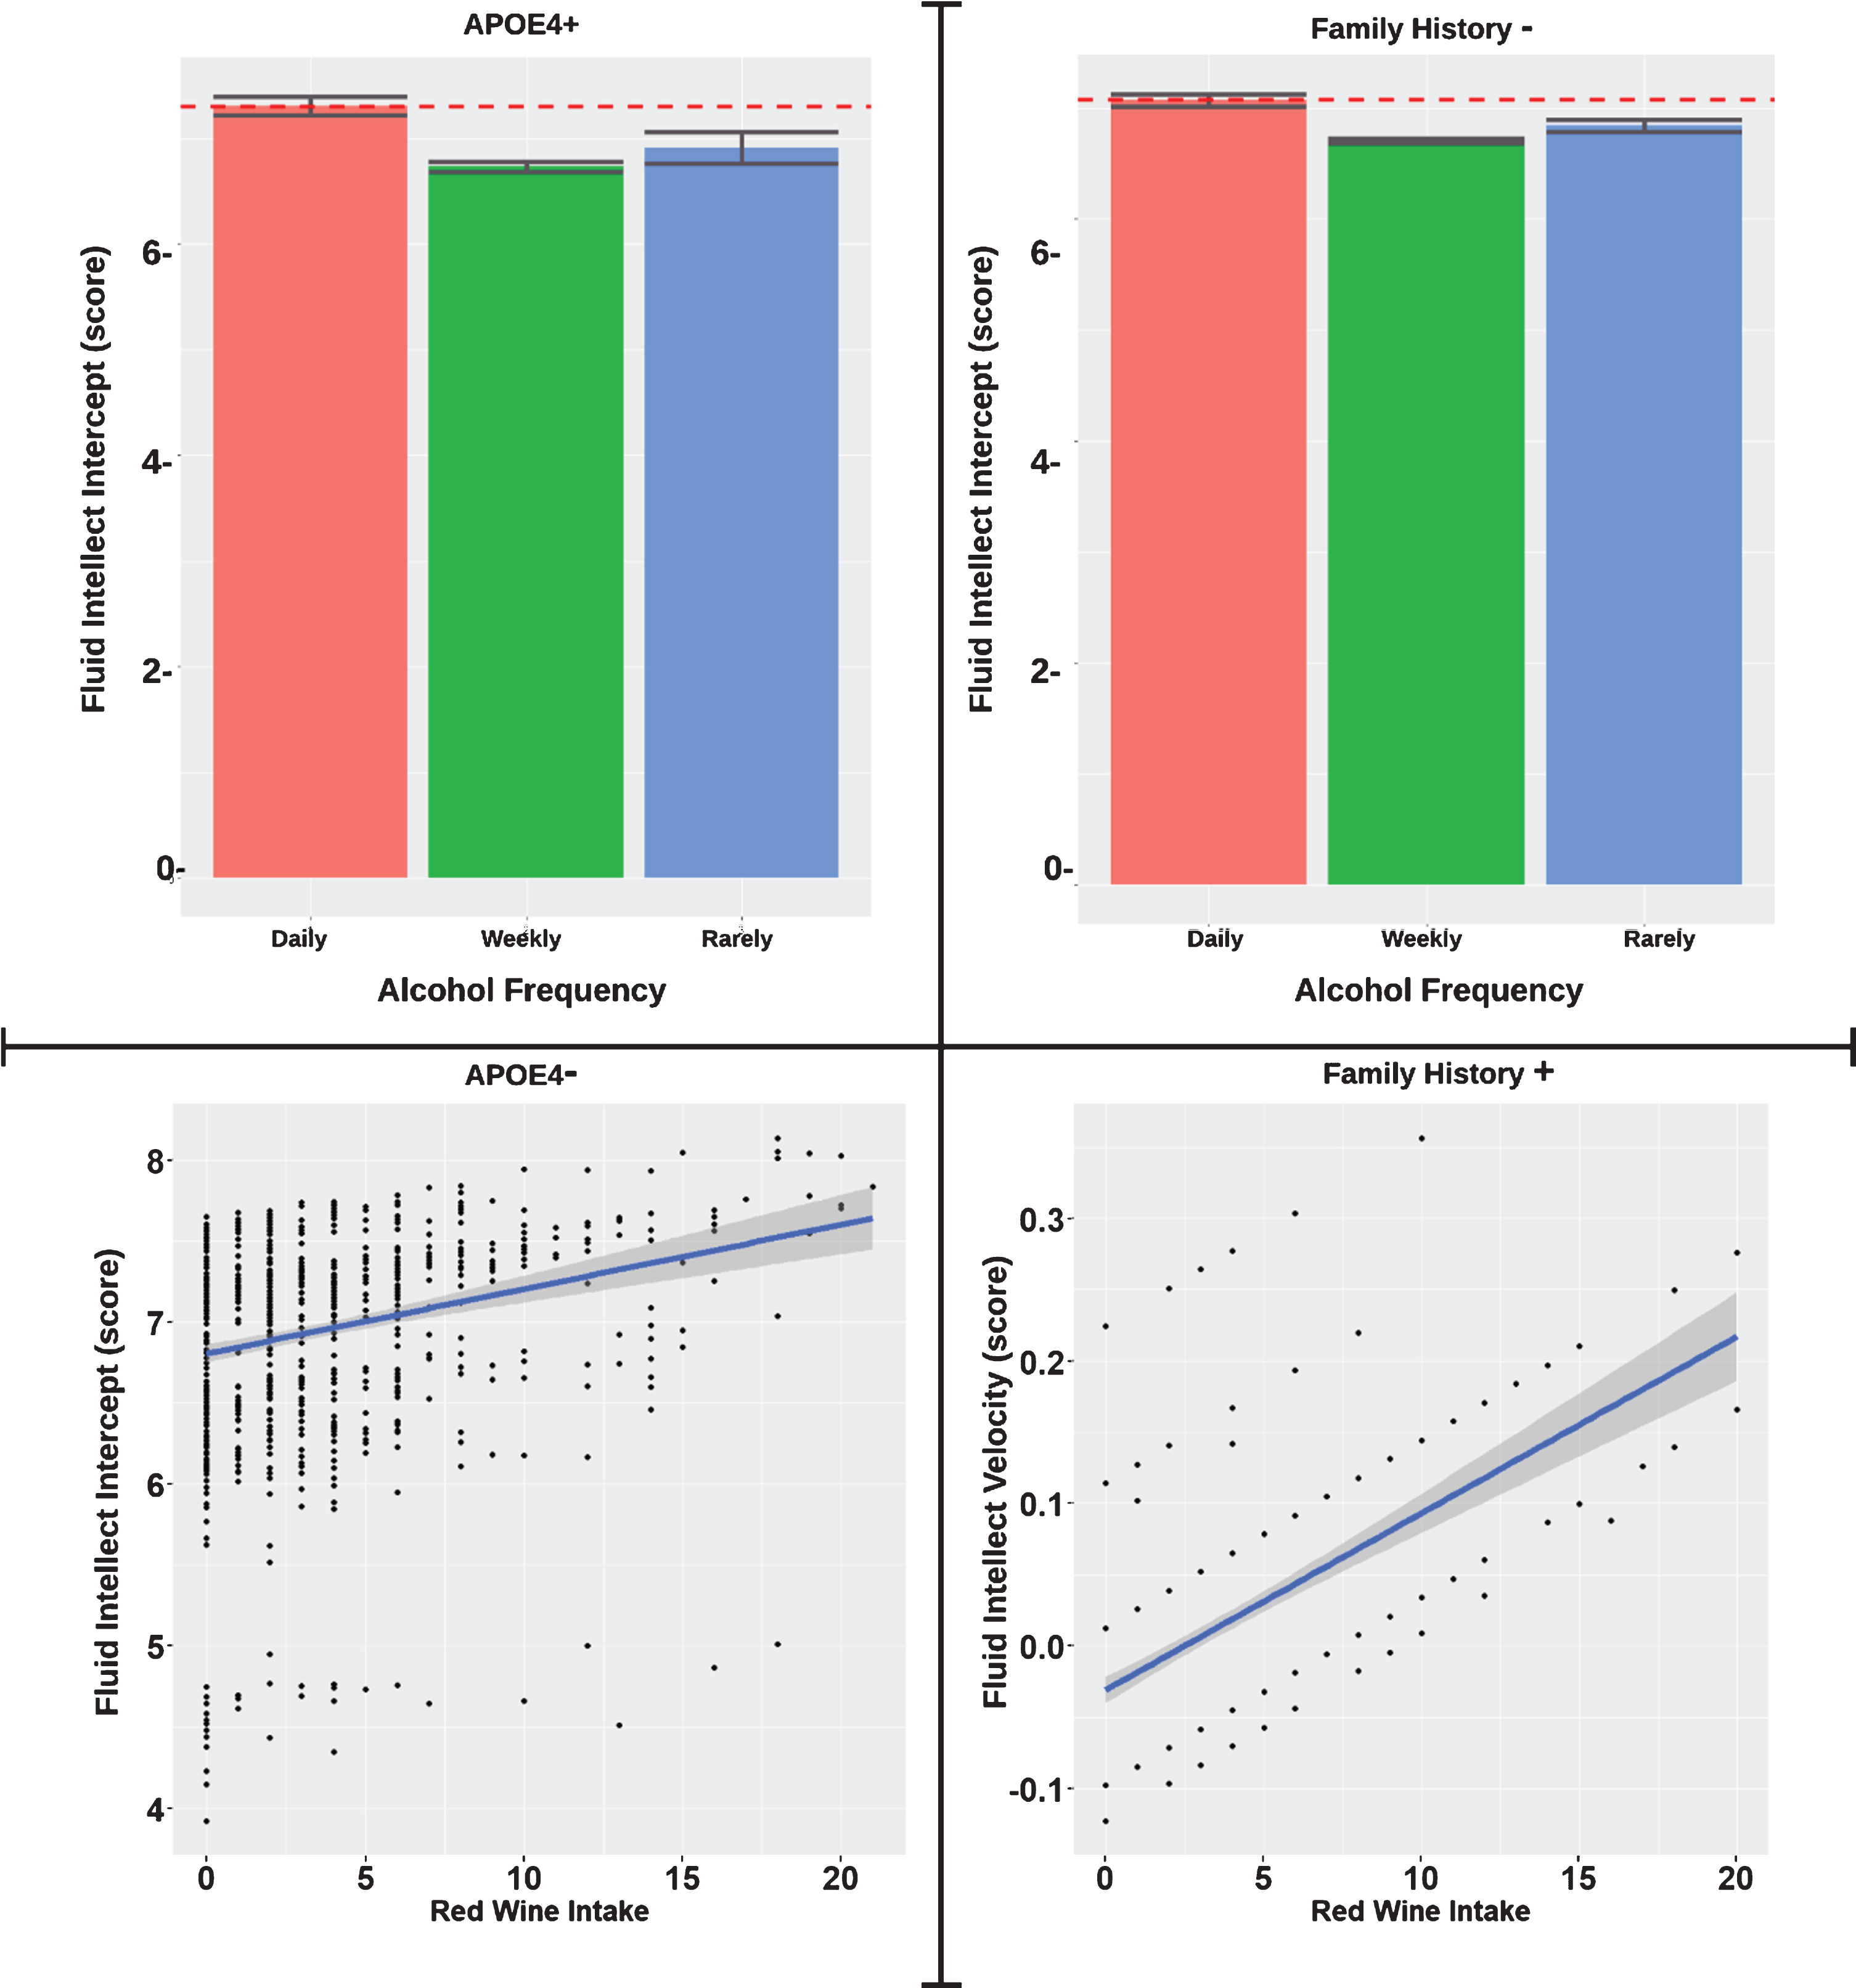
Association of alcohol frequency and type on fluid intellect stratified by FH and APOE4 subgroup were significant associations were observed. Velocity is linear change over time. In the barplots, the red dotted lines represent the group with best performing fluid intellect score at baseline or change-over-time, and the error bars represent the 95% confidence interval. The gray shaded regions in the scatterplots illustrate marginal standard errors.
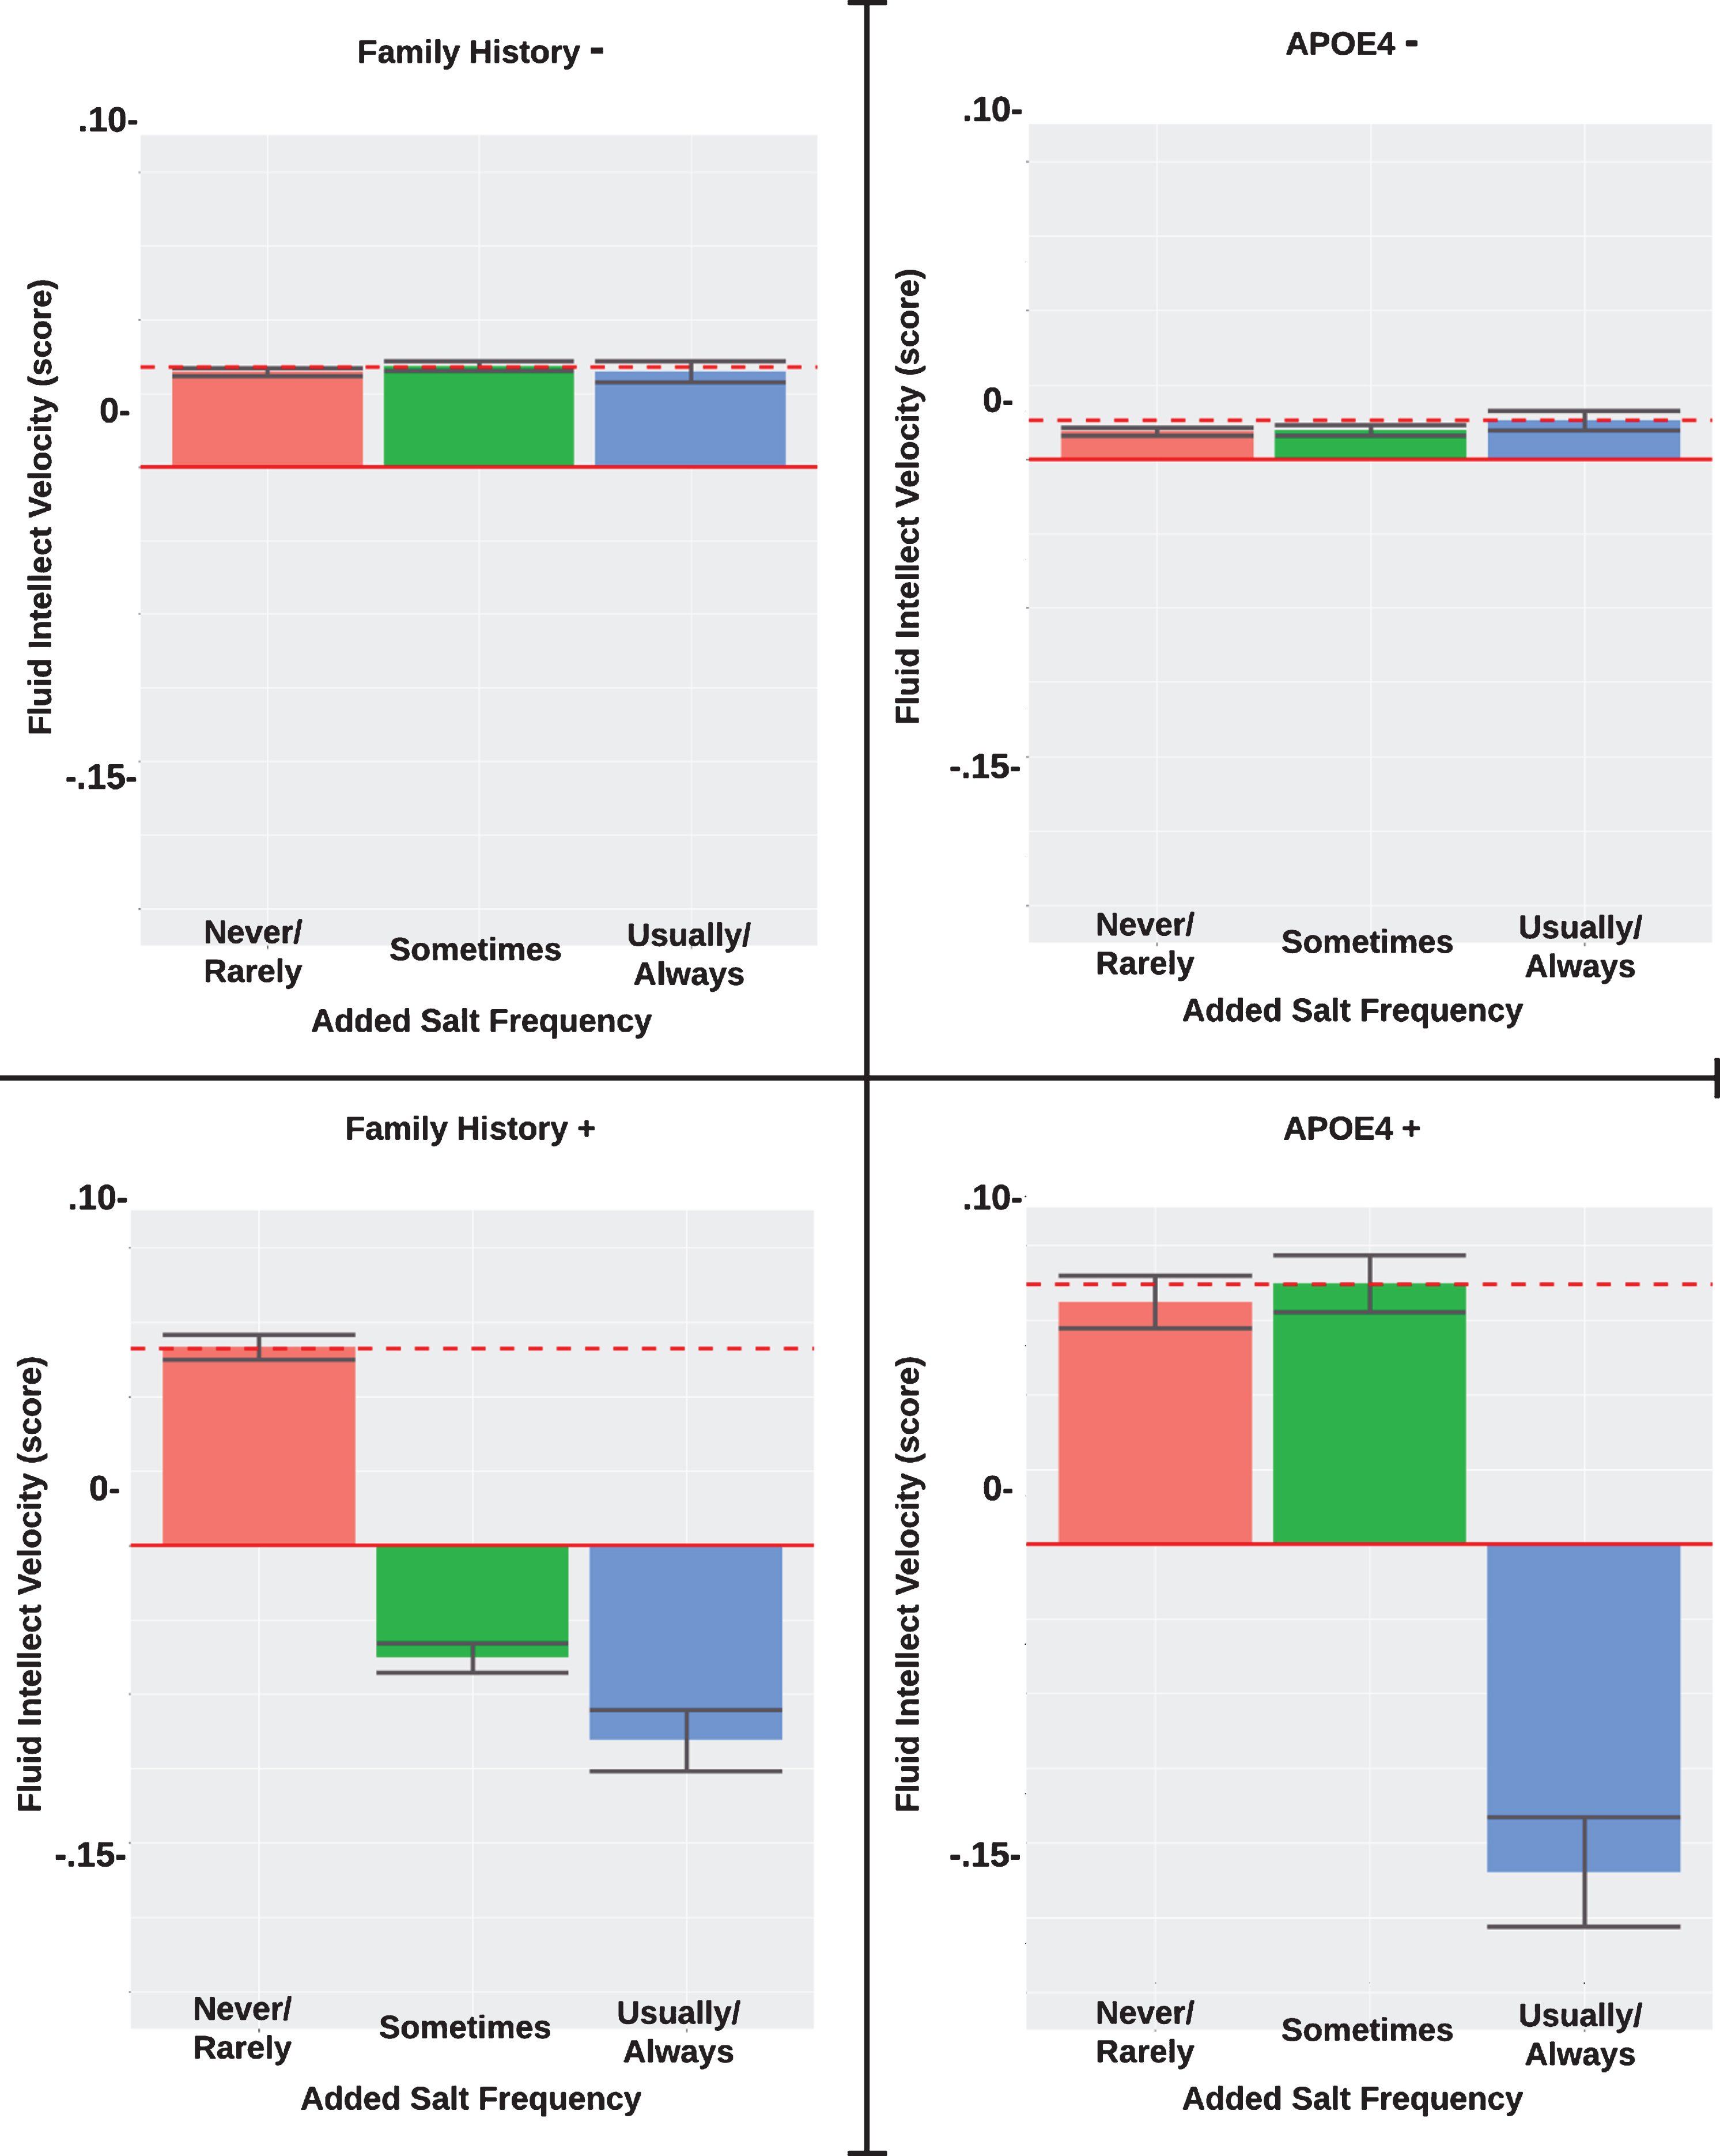
Association of added salt frequency on fluid intellect by FH and APOE4 subgroup. Velocity is linear change over time. In the barplots, the red dotted lines represent the group with best performing fluid intellect score at baseline or change-over-time, and the error bars represent the 95% confidence interval.
Associations with diet by familial history subgroups
The standardized beta estimates are presented in Table 3. For adults without family history, increased FI was related to daily cheese intake (p < 0.001) at baseline, while daily poultry (p = 0.003) or vegetable (p = 0.005) consumption was associated with more rapid decline at baseline. Significant associations of these variables and changes in FI over time were not observed. For adults with AD family history, daily whole grain (p = 0.035) at baseline and red wine (p = 0.014) consumption predicted higher FI levels over time. FI had a negative association with tea intake (p = 0.015) and processed meat intake (p = 0.006) at baseline. More sporadic intake of poultry and salt were also associated with worse FI scores. Figure 3 illustrated the association of frequency of added salt on change in fluid intellect.
Standardized Estimates of predictors on fluid intelligence by Family History status
Values are standardized betas. *p < 0.05, **p < 0.01, ***p < 0.001.
DISCUSSION
The objective of this study was to better understand the relationships between whole-foods within the holistic context of an individual’s entire diet and their long-term executive function, among participants stratified by APOE4 carriage status or family history status. Our results suggested that whole-foods could affect FI both cross-sectionally and longitudinally. However, differences are present between subgroups for APOE and FH. Additionally, there are variables that appeared influential at baseline but not over time and vice-versa.
We observed among E4–, E4+, and FH–individuals that greater cheese consumption was associated with healthier cognitive trajectories; however, we did not observe associations between cheese and executive function among those who were FH+. Greater dairy intake has been associated with declining memory in older adults who have heart failure, possibly due the type of fat contained in the product. For instance, the proportion of conjugated linoleic acid and unsaturated fats increases if the ruminants had plenty of grass in their diet [32]. Those differences in fat content may be related to whether or not improvements in spatial working memory are observed [33]. Yet, dairy products among some cohorts have been associated with alteration in blood pressure, consequently affecting memory [34]. On the other hand, dairy consumption may prevent cognitive decline in men without cardiovascular disease, in part due to calcium and vitamin B12, independent of genetic and family environmental factors [35]. Thus, dairy consumption may be beneficial in other ways. Including for example, lactopeptides may improve cognition in older adults [36], and probiotics may attenuate depression [37].
Government recommendations on how to drink alcohol state maximum of one or two standard drinks daily, and these recommendations do not distinguish between alcohol types nor their consumption patterns [38]. A recent report from the U.S. 2020 Dietary Guidelines Advisory Committee recommended lowering the threshold to one drink daily across the board, which could imply that drinking is only for getting drunk, by targeting modest consumers in an effort to combat alcoholism and binge drinking. Here, we found that when distinguishing amount, type, and frequency of drinking alcohol, greater red wine consumption over time was related to better FIT scores, and consistent alcohol consumption daily, but not weekly or monthly consumption, may further improve score performance. We further observed that up to a bottle a day of red wine could be beneficial, under the right conditions. We could not explicitly model some parameters suggested by prior research, and therefore offer caution interpreting these findings until more quality-related parameters can be clarified.
Prior research has also elucidated several parameters meaningful for how to drink alcohol, many of which have been replicated conjointly and within a holistic dietary context here for the first time. Consuming alcohol slowly lowers peak blood alcohol levels [39]. Because the stomach is very effective at metabolizing alcohol, how long alcohol stays in the stomach is a major factor governing its rate of absorption. Therefore, drinking with or after a meal improves alcohol metabolism [40]. Among cognitively normal aged adults, low, but not moderate or heavy consumption of wine, has been associated with improved cognitive performance, white matter integrity, and cerebral blood flow [41]. Another observational study found that, in contrast to abstainers, light to moderate beer consumption was associated with a higher risk of dementia, while light to moderate wine consumption was associated with a significantly lower risk [42]. This is consistent with our findings of a link between the type, amount, and frequency of alcohol intake and cognitive function. Interestingly, a large, 1,624-participant observational cohort study found that individuals consuming alcohol regularly but at a moderate pace had improved cognitive function in comparison to abstainers of alcohol, supporting that proper alcohol intake is unlikely to result in adverse effects in the geriatric population [43]. When assessed by APOE status, the study found no significant difference between APOE genotype and the alcohol-cognition relationship; however, we found beneficial associations among ɛ4–and ɛ4;+ individuals, particularly if red wine was consumed. Other research has shown that alcohol used in moderation may be anti-inflammatory, while increasing high-density lipoprotein, but decreasing blood pressure, which, in turn, may result in better cognitive function [44, 45]. The alcohol-cognitive link may also be explained by prior evidence suggesting that alcohol could be directly mediated by certain neuroprotective factors, including the reduction of neuroinflammation, oxidative stress, and apoptosis [46, 47]. However, more research is needed to elucidate the biological underpinnings of the qualities of alcohol and their effects on cognition.
It is important to note that some studies failed to differentiate between the types of alcohol consumed (wine, beer, and liquor) in the results. This is noteworthy, as prior literature has shown that a benefit is more pronounced with wine consumption than with beer or liquor consumption [48, 49]. Although alcohol induces oxidative stress in tissues it may reach if it passes through the stomach, the polyphenolic content of red wine may actually be anti-inflammatory [50, 51]. Furthermore, we did observe a significant association between red wine and higher FI in our data, but only in those with an APOE4–genotype or a family history of AD. Those who were APOE4+ or had no family history of AD, on the other hand, showed no such association.
Although red meat consumption is often tied to worse health outcomes [52], we discovered a unique beneficial relationship among some lamb consumers. Among FH–and ɛ4+ individuals, we noted a positive association with the 10-year cognitive trajectory when lamb was consumed about once a week on average. Prior studies suggest that a diet high in grass among meat-providing ruminants increases meat content of omega-3s and other unsaturated fats, and decreases saturated fat [53]. Another study suggest that compared to beef, lamb meat may contain more than twice the amount of oleic fatty acid content, the type most prevalent in olive oil [54]. Lamb is also high in taurine, carnosine, coenzyme Q10, and creatine [55].
Our data supports that excess dietary salt intake appears to harm cognition, but we only noted this observation for individuals with the presence of FH or APOE4. Prior research has shown a link between salt-rich diets and cognitive decline. For example, an experimental study using mice who were fed either eight-fold or sixteen-fold over the recommended amount of dietary salt in a mouse’s daily diet that after approximately eight to 12 weeks of following this diet, the mice began manifesting cognitive decline and memory difficulties [56]. For instance, they have increasing difficulty with differentiating new versus familiar objects, completing mazes, and building nests. Although the mechanisms behind how salt negatively affects brain health are not fully understood, the authors purported that physiological disturbances such as hinderance of resting cerebral blood flow and endothelial function caused by excess salt intake is likely to be applicable to humans as well.
However, the studies examining associations between dietary salt consumption and cognition appear to be inconclusive in humans [57]. Distinguishing between AD risk factors, such as done in our study, potentially elucidated some prior inconsistencies. For instance, we found that FI scores were consistent regardless of the amount of salt consumed for participants lacking either FH AD or APOE4, but adding salt to food appeared to be detrimental for participants who were found to have either aforementioned AD risk factor. Individuals with FH of AD, specifically maternal, who were cognitively unimpaired were shown to have reduced brain glucose metabolism [58]. Thus, this predisposition may not handle high salt intake and therefore impair cognition. However, more research is needed to elucidate the mechanisms that may be involved in the correlation between dietary salt intake and cognition in humans.
FH is a unique risk factor that may reflect developmental and or environmental influences, such as dietary habits, which could modulate neurodegeneration [59]. Although Donix and colleagues found that subjects with FH had lower baseline scores in general cognitive performance, no significant decline were detected longitudinally. However, the difference in findings may be due to the length of time with their study having one follow-up assessments over a period of approximately two years versus ours having two follow-up assessments over a period of six years. Gut microbiota and the brain conjunctively form an axis and have interlinked health outcomes via vagal afferents [60,61, 60,61]. Greater diversity in the microbiome has been associated with reduced risk of AD [62] and better ability to digest nutrients [63]. Not only does the intestinal microbiome affect absorption potential, but diet can also impact the diversity and metabolic capacity of gut flora and alter body composition [64]. A FH of AD may modify how the brain utilizes β-carotene and may be related to other beneficial effects, such as higher regional glucose metabolism in AD-sensitive brain areas [65]. In other words, FH of AD may moderate how diet and cognition are related because it reflects inter-individual differences in the ability to harbor a healthy diversity of gut bacteria, which alters how food is metabolized and which nutrients are extracted.
There are several limitations that should be considered in our study. Although we utilized longitudinal data for predictors and outcomes, this is an observational study and the direction of causality cannot be inferred. Our study had nevertheless several strengths worth noting. First, unlike cross-sectional self-reporting of food intake studies, which may underestimate or overestimate consumption, we accounted for individual variation and reduced error variance by considering dietary recall at three time-points over ten years. In addition, we also used agnostic statistical analyses to parse which food groups were related to FIT scores, rather than derive scores for adherence to a specific diet type. By identifying effects from individual food categories, Mediterranean and MIND diet recommendations could be further improved and personalized.
In summary, our findings suggest that weekly cheese intake over six years is associated with better fluid intelligence performance for APOE4+ adults. Though daily cheese intake appeared beneficial regardless of APOE4 carrier status at baseline. The association between FI and certain food may differ between people stratified by AD family history and between people stratified by APOE4 carrier status. Thus, meal plans may need to be modified to meet individual needs to potentially minimize cognitive decline. Future work may examine how other cognitive domains (i.e., perception, processing speed), brain volume and white matter microstructure are affected by whole food dietary components.
Footnotes
ACKNOWLEDGMENTS
This research has been conducted using the UK Biobank Resource under Application Number 25057. This work was also supported by Iowa State University, National Institutes of Health (NIH) R00 AG047282, National Institute of Aging (NIA) P30AG10161, and Alzheimer’s Association Research Grant to Promote Diversity (AARG-D)-17-529552. Funding sources had no influence on the development or conduct of this report.