
Abstract
Background:
Individuals with subjective cognitive decline (SCD), defined by self-reported memory complaints but normal performance in objective neuropsychological tests, may be at higher risk of worsening or more frequent memory loss until conversion to Alzheimer’s disease (AD) or related dementia. Asymmetry in two hemispheres is a cardinal character of human brain’s structure and function, and altered brain asymmetry has also been connected with AD.
Objective:
This study aimed to determine whether the asymmetry of subcortical structures in individuals with SCD and amnestic mild cognitive impairment (aMCI) and AD patients are altered compared with normal controls (NC).
Methods:
We investigated neuroanatomical alterations in 35 SCD, 43 aMCI, and 41 AD subjects compared with 42 NC, focusing on asymmetrical changes in subcortical structures based on structural magnetic resonance images (sMRI). General linear model was conducted to test group differences, and partial correlation was used to model the interaction between asymmetry measurements and cognitive tests.
Results:
Individuals with SCD (lateral ventricle and cerebellum-WM), aMCI patients (lateral ventricle, pallidum, hippocampus, amygdala, accumbens, and ventral DC), and AD patients (lateral-ventricle, cerebellum-cortical pallidum, thalamus, hippocampus, amygdala, accumbens, and ventral DC) exhibited significant altered neuroanatomical asymmetries of volume, surface area, and shape compared with NC. Significant associations between shape asymmetry and neuropsychological examinations were found in the hippocampus and accumbens.
Conclusion:
Altered neuroanatomical asymmetries of subcortical structures were significantly detected in SCD individuals and aMCI patients as well AD patients, and these specific asymmetry alterations are potential to be used as neuroimaging markers and for monitoring disease progression.
INTRODUCTION
Alzheimer’s disease (AD) is considered as an irreversible neurodegenerative disorder and is characterized by a gradual decline in cognitive ability lasting for several years and a long preclinical period [1]. Identifying an inchoate stage of AD will be very helpful for delaying the onset of its clinical symptoms by early interventions. Individuals with subjective cognitive decline (SCD) of preclinical AD are characterized by self-complaints of memory decline (rather than other domains of cognition) in the elderly, without abnormal clinical neuropsychological scores [2]. In addition, substantial evidence provides that the SCD occurs at the preclinical AD stage [3] has the potential to represent the first symptomatic manifestation of AD [2]. Currently, various studies have clarified that populations with SCD are at increasing risk of progression to AD [4, 5], but the relevance of abnormal anatomical brain structures between SCD and AD-related patients still needs to be explored. Aberrant neuroanatomical structures based on structural magnetic resonance imaging (sMRI) are recommended biomarkers in clinical research for early AD diagnosis, where atrophy of grey matter can be found, typically including the hippocampus, the amygdala, parahippocampal gyrus, and the subcortical nuclei [1, 6]. The asymmetry analysis mainly concentrated on cortical structures has been widely used in AD [7 –9], and the asymmetry alterations in SCD subjects are mostly unknown [10].
Brain atrophy in medial temporal lobe and hippocampal formation, characterized by sMRI, associated with neuronal loss and memory decline is one of the important clinical neuroimaging biomarkers for AD diagnosis [3 , 12]. Volume reduction of brain structures are typically in subcortical regions or/and the structures adjacent with the subcortical structure, such as the entorhinal cortex, hippocampus, and amygdala, in SCD subjects [4 , 13–16] compared with that in normal controls (NC). Abnormal tau pathology, one of key biomarkers of AD, may begin in selected subcortical nuclei which send aberrant signals to the cortical nerve cells [17]. The subcortical structures such as hippocampal formation, play an intermediary role of signal transformation in limbic circuit, where exteroceptive data are conveyed from high order sensory association zones to the prefrontal cortex [18]. There is increasing evidence that, at preclinical stage of AD, subcortico-cortical pathway of tau should be under consideration, especially for hippocampal formation and entorhinal regions [18]. In a time-to-progression study for MCI and AD based on neuroimaging, the hippocampal atrophy may indicate the degree of neurodegeneration, and predict its progress to AD [19].
Although the two hemispheres of human brain are highly symmetrical in anatomical and functional level, there are subtle and distinct neuroanatomical differences between them [20, 21]. In a population level study, researchers mapped the brains of 17,141 healthy individuals, showing population-level cortical thickness and surface area asymmetry, and suggested that asymmetry analysis has potential to study the abnormal brain asymmetry in cognitive and psychiatric disorders [22]. Although previous studies based on autopsy reported that brain lesions in AD were bilateral symmetric [23 –25], abnormal asymmetries in AD were confirmed by multiple studies based on biological and imaging AD-biomarkers (e.g., amyloid deposition, tau, and brain atrophy) [8 , 26–29]. Recently, increased neuroanatomical asymmetries have been found in the hippocampus and amygdala of dementia patients through a novel approach called “Brainprint”, making asymmetry analysis as a promising method to predict dementia [30, 31]. Furthermore, a longitudinal imaging and genetics study investigated genetic influence on brain asymmetry in AD patients based on “Brainprint”, which has consolidated the biological basis of asymmetry changes in AD progression [32]. These studies imply that brain asymmetry analysis based on “Brainprint” is a novel and effective way to study dementia diseases. However, the asymmetric changes in the brain subcortical structures of the AD continuum including SCD population are still little known.
In this study, an asymmetry approach, combined with the volume, surface area, and “Brainprint” of the corresponding structures in the left and right hemispheres, was used to explore whether brain asymmetry changes in the three cognitive decline groups, with a particular focus on SCD subjects. Additionally, we examined the associations between neuropsychological scores and asymmetric measurements of all cognitive decline participants to explore whether there are similar trends. As previous studies have shown, dementia patients exhibited extensive brain structure alterations and varying neuroanatomical asymmetry in AD-related regions. Thus, we hypothesized that aberrated neuroanatomical asymmetries in subcortical structures can be detected in SCD individuals and aMCI and AD patients.
METHODS
Participants
In this study, we used a dataset of 161 subjects from Xuanwu Hospital of Capital Medical University in China containing 119 volunteers (35 SCD individuals, 43 aMCI patients, and 41 AD patients) from the memory clinic of the Neurology Department, Xuanwu Hospital, Capital Medical University, and 42 control subjects from local communities in Beijing (all participants were right-handed and of Chinese Han nationality). This study was performed in accordance with the rule of ethics of the Medical Research Ethics Committee in Xuanwu Hospital, and every subject gave their written informed consent to participate. A neuropsychological test battery was used to screen the subjects, which included the Montreal Cognitive Assessment (MoCA, Beijing version) [33], Auditory Verbal Learning Test (AVLT) (include three memory tests: AVLT-immediate recall (AVLT-I), AVLT-delayed recall (AVLT-D), and AVLT-recognition (AVLT-R)) [34], Clinical Dementia Rating (CDR), Hamilton Depression Rating Scale (HAMD), Activities of Daily Living (ADL) scale, Hachinski ischemic scale, and the Center for Epidemiologic Studies depression scale. Moreover, the volunteers received a neuropsychological assessment from two neurologists (worked independent and made consensus decisions), each with more than two years of clinical experience in neurology. The main demographics and neuropsychological characteristics of all subjects are summarized in Table 1.
Demographic characteristics of the participants during the course of the study
NC, normal controls; aMCI, amnestic mild cognitive impairment; SCD, subjective cognitive decline; AD, Alzheimer’s disease; MoCA, Montreal Cognitive Assessment (Beijing version); AVLT, auditory verbal learning test. All scores were from the baseline interview and are represented as the mean±standard deviation. Statistical analysis of group differences was conducted by one-way analysis of variance (ANOVA) with Bonferroni post hoc analysis for age, education year, MoCA, and AVLT scores; the chi-square test was used to examine the differences in sex distribution for group comparisons. $ denotes the significant difference between the NC group and other groups ($ p < 0.05, $$ p < 0.01, $$$ p < 0.001), *indicates the significant difference between the SCD group and the other groups (* p < 0.05, ** p < 0.01, *** p < 0.001), and #represents the significant difference between the aMCI group and other groups (# p < 0.05, ## p < 0.01, ### p < 0.001).
The inclusion criteria of all participants are: 1) HAMD score equal or lower than 24, and the score of Center for Epidemiologic Studies depression scale equal or lower than 21; 2) Hachinski ischemic scale equal or lower than 4; 3) right handedness; 4) without visual or auditory impaired; 5) Mandarin-speaking and Chinese Han nationality. The exclusion criteria for participation in this study are: 1) subjects with cognitive decline due to no-AD neurological diseases (e.g., brain tumor, brain injury, Parkinson’s disease, encephalitis, normal pressure hydrocephalus, multiple sclerosis or epilepsy); 2) subjects with a history of stroke; 3) subjects with a history of alcohol or drug abuse/addiction within the last two years (DSM-IV); 4) subjects with any other systemic diseases or uncertainty prevents the completion of the project; 5) subjects with frequent head motion which may influence the quality of MRI. Also, detailed reports were carried out in our previous studies [35, 36].
The diagnostic criteria for the subjects were as follows: 1) For normal controls, (a) NC had no reported memory complaints or impairment, and the MoCA (the threshold was determined according to different levels of education, with 19 points for those with primary school experience and illiterate subjects, 22 points for those with secondary schooling, and 24 points for persons with a university education), AVLT and CDR scores were normal; (b) without a history of diabetes; 2) The inclusion criteria for individuals with SCD were based on a conceptual framework defined by the Subjective Cognitive Decline Initiative (SCD-I) [2], which included (a) self-reported memory decline, rather than other domains of cognition within the previous five years; (b) performed worse than an age-matched group; (c) the MoCA score was in the normal range; (d) only one of the two memory tests (AVLT-D and AVLT-R) was abnormal (decline one standard deviation (SD) compared with NC); and (e) the CDR was 0; (f) individuals diagnosed with aMCI, prodromal AD, or dementia were excluded; 3) The Petersen criteria [37] were used to diagnose aMCI patients, (a) self-experienced memory decline and confirmation by a qualified informant; (b) the MoCA score was in abnormal range; (c) CDR score is 0.5; (d) failure to reach the standard of dementia; (e) both two memory tests (AVLT-D and AVLT-R) were lower (decline one SD compared with NC) than the normal range; (f) exclude the subjects with vascular MCI; 4) AD patients were diagnosed by the criteria of National Institute of Aging-Alzheimer’s Association (NIA-AA) for AD-Clinical [1], described as follows: (a) symptoms were consistent with the diagnostic criteria for dementia; (b) there was progressive and/or gradual onset lasting more than 6 months instead of a sudden onset of symptoms; (c) brain atrophy was found in the hippocampus based on sMRI; and (d) CDR scores were equal to one or higher. The exclusion and diagnostic criteria were described in our previous studies [35 , 38–40].
MRI protocol
All images were acquired from a 3.0T MRI system (Magnetom Trio Tim; Siemens, Erlangen, Germany) by using a sagittal magnetization-prepared rapid gradient echo (MP-RAGE) three-dimensional (3D) T1-weighted sequence (Department of Radiology, Xuanwu Hospital, Capital Medical University). The main acquisition parameters were as follows: repetition time (TR)/time to echo (TE)/inversion time (TI)=1900/2.2/900 ms; flip angle = 9°; field of view (FOV)=224× 256 mm2; matrix size = 448× 512; number of slices = 176; and slice thickness = 1 mm.
The shape-DNA of the brain
The “shape-DNA” is defined as a discriminative geometrical descriptor that can characterize the subtle and comprehensive morphological information from 2D surfaces [41]. The “shape-DNA” extracted from triangular surfaces of anatomical structures can capture the high dimensional intrinsic shape features called “Brainprint”, which has been applied to the asymmetry analysis of neuroanatomical structures [42]. First, the calculation of the “Brainprint” depended on automatic segmentation of the neuroanatomical structures with FreeSurfer (version 6.0) without manual correction [43
–46]. Then, after the pipeline, the 2D closed meshes (marching cubes algorithm; Dirichlet boundary condition) of subcortical structures were built [41, 42]. Finally, the volume, surface area and “Brainprint” of all structures were computed by the shapeDNA-tria 1.3 package (http://reuter.mit.edu/software/shapedna/) [42]. Because the “Brainprint” is a shape representation of a closed surface, our research mainly concentrated on the structures of subcortical of the brain. In addition, the “shape-DNA” relies on the eigenvalues of the Laplace-Beltrami operator Δ, which can be calculated by using finite element analysis by solving the Laplacian eigenvalue problem (iterative Lanczos algorithm in ARPACK package [47]) on the given geometrical shape:
The solution consists of eigenvalue
Brain asymmetry analysis
Substantial neuroanatomical structures are identified in the FreeSurfer segmentation pipeline, such as the hippocampus, amygdala, and accumbens in the two hemispheres, and “Brainprint” can represent them. In this study, we computed the asymmetry in the volume and surface area of structure l directly:
Statistical analysis
Group differences in demographic, clinical, and biological measurements were assessed by analysis of variance (ANOVA) for age, education year, intracranial volume, MoCA and AVLT scores with one four-level (group) factor; the chi-square test was used for sex distribution (Table 1). When the main effect of group was significant (p < 0.05), Bonferroni post hoc analysis was performed using SPSS software (v22.0, IBM, Armonk, NY, USA).
A general linear model based on the general linear mixed effects models (GLMMs) framework was used to study cross-sectional effects in brain asymmetry measures [32, 42]. When Y
i
denoted the brain asymmetry measures of individual i, A
i
, S
i
, E
i
, D
i
, and V
i
represented the age, sex, education year, diagnostic status and intracranial volume for participant i.
RESULTS
Background characteristics of the participants
The NC, SCD, aMCI, and AD groups were not significantly different in age, sex, education year, and intracranial volume. The AD and aMCI groups had significantly lower cognitive scores than the other two groups, and the aMCI group had significantly higher cognitive scores than the AD group (p < 0.05). Additionally, the SCD group performed worse than the NC group in delayed recall of the AVLT (p < 0.05). These results were summarized in Table 1.
Asymmetry analysis
We computed the volume asymmetry (Table 2) and surface area asymmetry (Table 3) based on equation (4). Significant differences between NC group and SCD group was only detected in the surface area asymmetry of lateral ventricle (p < 0.05). For the volume asymmetry, the linear increasing trends along NC-SCD-aMCI-AD were found in striatum, cerebellum-cortex, accumbens, and ventral DC. The structures of volume asymmetry which can discriminate NC group and AD group significantly were lateral-ventricle, cerebellum-cortex, pallidum, amygdala, accumbens and ventral DC (p < 0.05). Moreover, significant volume asymmetry differences between NC group and aMCI group were found in pallidum, amygdala, accumbens, and ventral DC (p < 0.05). In addition, the linear increasing trends along NC-SCD-aMCI-AD of surface area asymmetry were found in lateral ventricle and thalamus. For surface area asymmetry, significant difference between NC group and aMCI group was only detected in lateral ventricle (p < 0.05). Furthermore, the surface area asymmetries of lateral ventricle, thalamus, hippocampus, and amygdala (p < 0.05) were significant between NC group and AD group. However, no significant differences between aMCI group and AD group were found in volume asymmetry and surface area asymmetry.
Standardized regression coefficients and p-values (Fisher’s least significant difference was used for multiple comparisons at p = 0.05) for the analysis of volume asymmetry with the linear mixed effects model
NC, normal controls; aMCI, amnestic mild cognitive impairment; SCD, subjective cognitive decline; AD, Alzheimer’s disease. The coefficient
Standardized regression coefficients and p-values (Fisher’s least significant difference was used for multiple comparisons at p = 0.05) for the analysis of surface area asymmetry with the linear mixed effects model
NC, normal controls; aMCI, amnestic mild cognitive impairment; SCD, subjective cognitive decline; AD, Alzheimer’s disease. The coefficient
The shape asymmetry marked by the Mahalanobis distance was computed by equation (5) and is shown in Table 4. There were no significant differences in the shape asymmetry in the neuroanatomical structures that could effectively divide the four groups. Specifically, the NC group and SCD group significantly differed in cerebellar WM shape asymmetry (p < 0.05). However, the shape asymmetry of putamen, hippocampus and accumbens exhibited increasing trends according to the order of NC-SCD-aMCI-AD. The structures showing significant differences in shape asymmetry between adjacent groups were the cerebellum-WM, cerebellum-cortex, pallidum, hippocampus, and amygdala (p < 0.05). Then, the shape asymmetry of hippocampus and accumbens can discriminate NC group and aMCI group as well AD group. In addition, the shape asymmetry of cerebellum-cortical, pallidum and hippocampus showed significant differences between aMCI group and AD group.
Standardized regression coefficients and p-values (p = 0.05) for the analysis of shape asymmetry with GLMMs model
NC, normal control; aMCI, amnestic mild cognitive impairment; SCD, subjective cognitive decline; AD, Alzheimer’s disease; WM, white matter; COR, cortex. Bold text indicates significant differences from the statistical analysis (p < 0.05). The diagnostic label
Figure 1 displays the estimated interindividual change in shape asymmetries in the putamen, hippocampus and accumbens across ages. Along the trajectory from NC-SCD-aMCI-AD, the lateral distance became larger. The increasing asymmetry in the hippocampus has been confirmed as a new biomarker for AD diagnosis [25 , 28], and we found a similar increasing pattern in individuals with SCD.

Cross-sectional analysis of standardized lateral asymmetry measures of the putamen (A), hippocampus (B), and accumbens (C). The global age effect is shown by the slope of the lines, and the group effect is the offset describing the increase in shape asymmetry across the trajectory of NC-SCD -aMCI-AD. A higher lateral distance indicates that the brain asymmetry is larger. The diagnostic groups are shown in color plots as indicated in the legend (AD, Alzheimer’s disease; aMCI, amnestic mild cognitive impairment; SCD, subjective cognitive decline; NC, normal control).
The results of volume and surface area were shown in Supplementary Tables 1 and 2.
Association of morphology measurements with cognitive scores
We used partial correlations to model the relationship between the asymmetry measurements and the neuropsychological characteristics, which have been considered to be one of the most important references for clinical diagnosis. To study the holistic correlation, we ruled out the effects of sex, age, education year, intracranial volume, and diagnosis group.
The results of correlation between the volume (Supplementary Table 3), surface area (Supplementary Table 4) of asymmetries, and the cognitive scores are listed in the Supplementary Material. We put the asymmetry of lateral-ventricle, hippocampus, amygdala, and accumbens in the partial correlation model, which showed substantial significant differences in asymmetry of volume and asymmetry of surface area between groups. But no significant relationships between the asymmetries of the selected structures and the neuropsychological scores were found, because our study mainly focuses on AVLT delayed recall and AVLT recognition. The partial correlation results between shape asymmetries and neuropsychological scores are shown in Supplementary Table 5. Correlation of the asymmetry in the hippocampus and the accumbens with cognitive scores across groups are shown in Fig. 2A and B, and significant results are only found in aMCI and AD group. Figure 2C displays the correlations across groups, and the shape asymmetry of hippocampus is significantly correlated with scores on all four tests (AVLT-immediate recall (r = –0.184, p = 0.025), AVLT-delayed recall (r = –0.170 p = 0.035), AVLT-recognition (r = –0.213, p = 0.011), and MoCA (r = –0.212, p = 0.012)). Additionally, the correlation between the MoCA (Beijing version) (r = –0.197, p = 0.018), AVLT-immediate recall scores (r = –0.183, p = 0.026) and the shape asymmetries in the accumbens are significant (Fig. 2C).
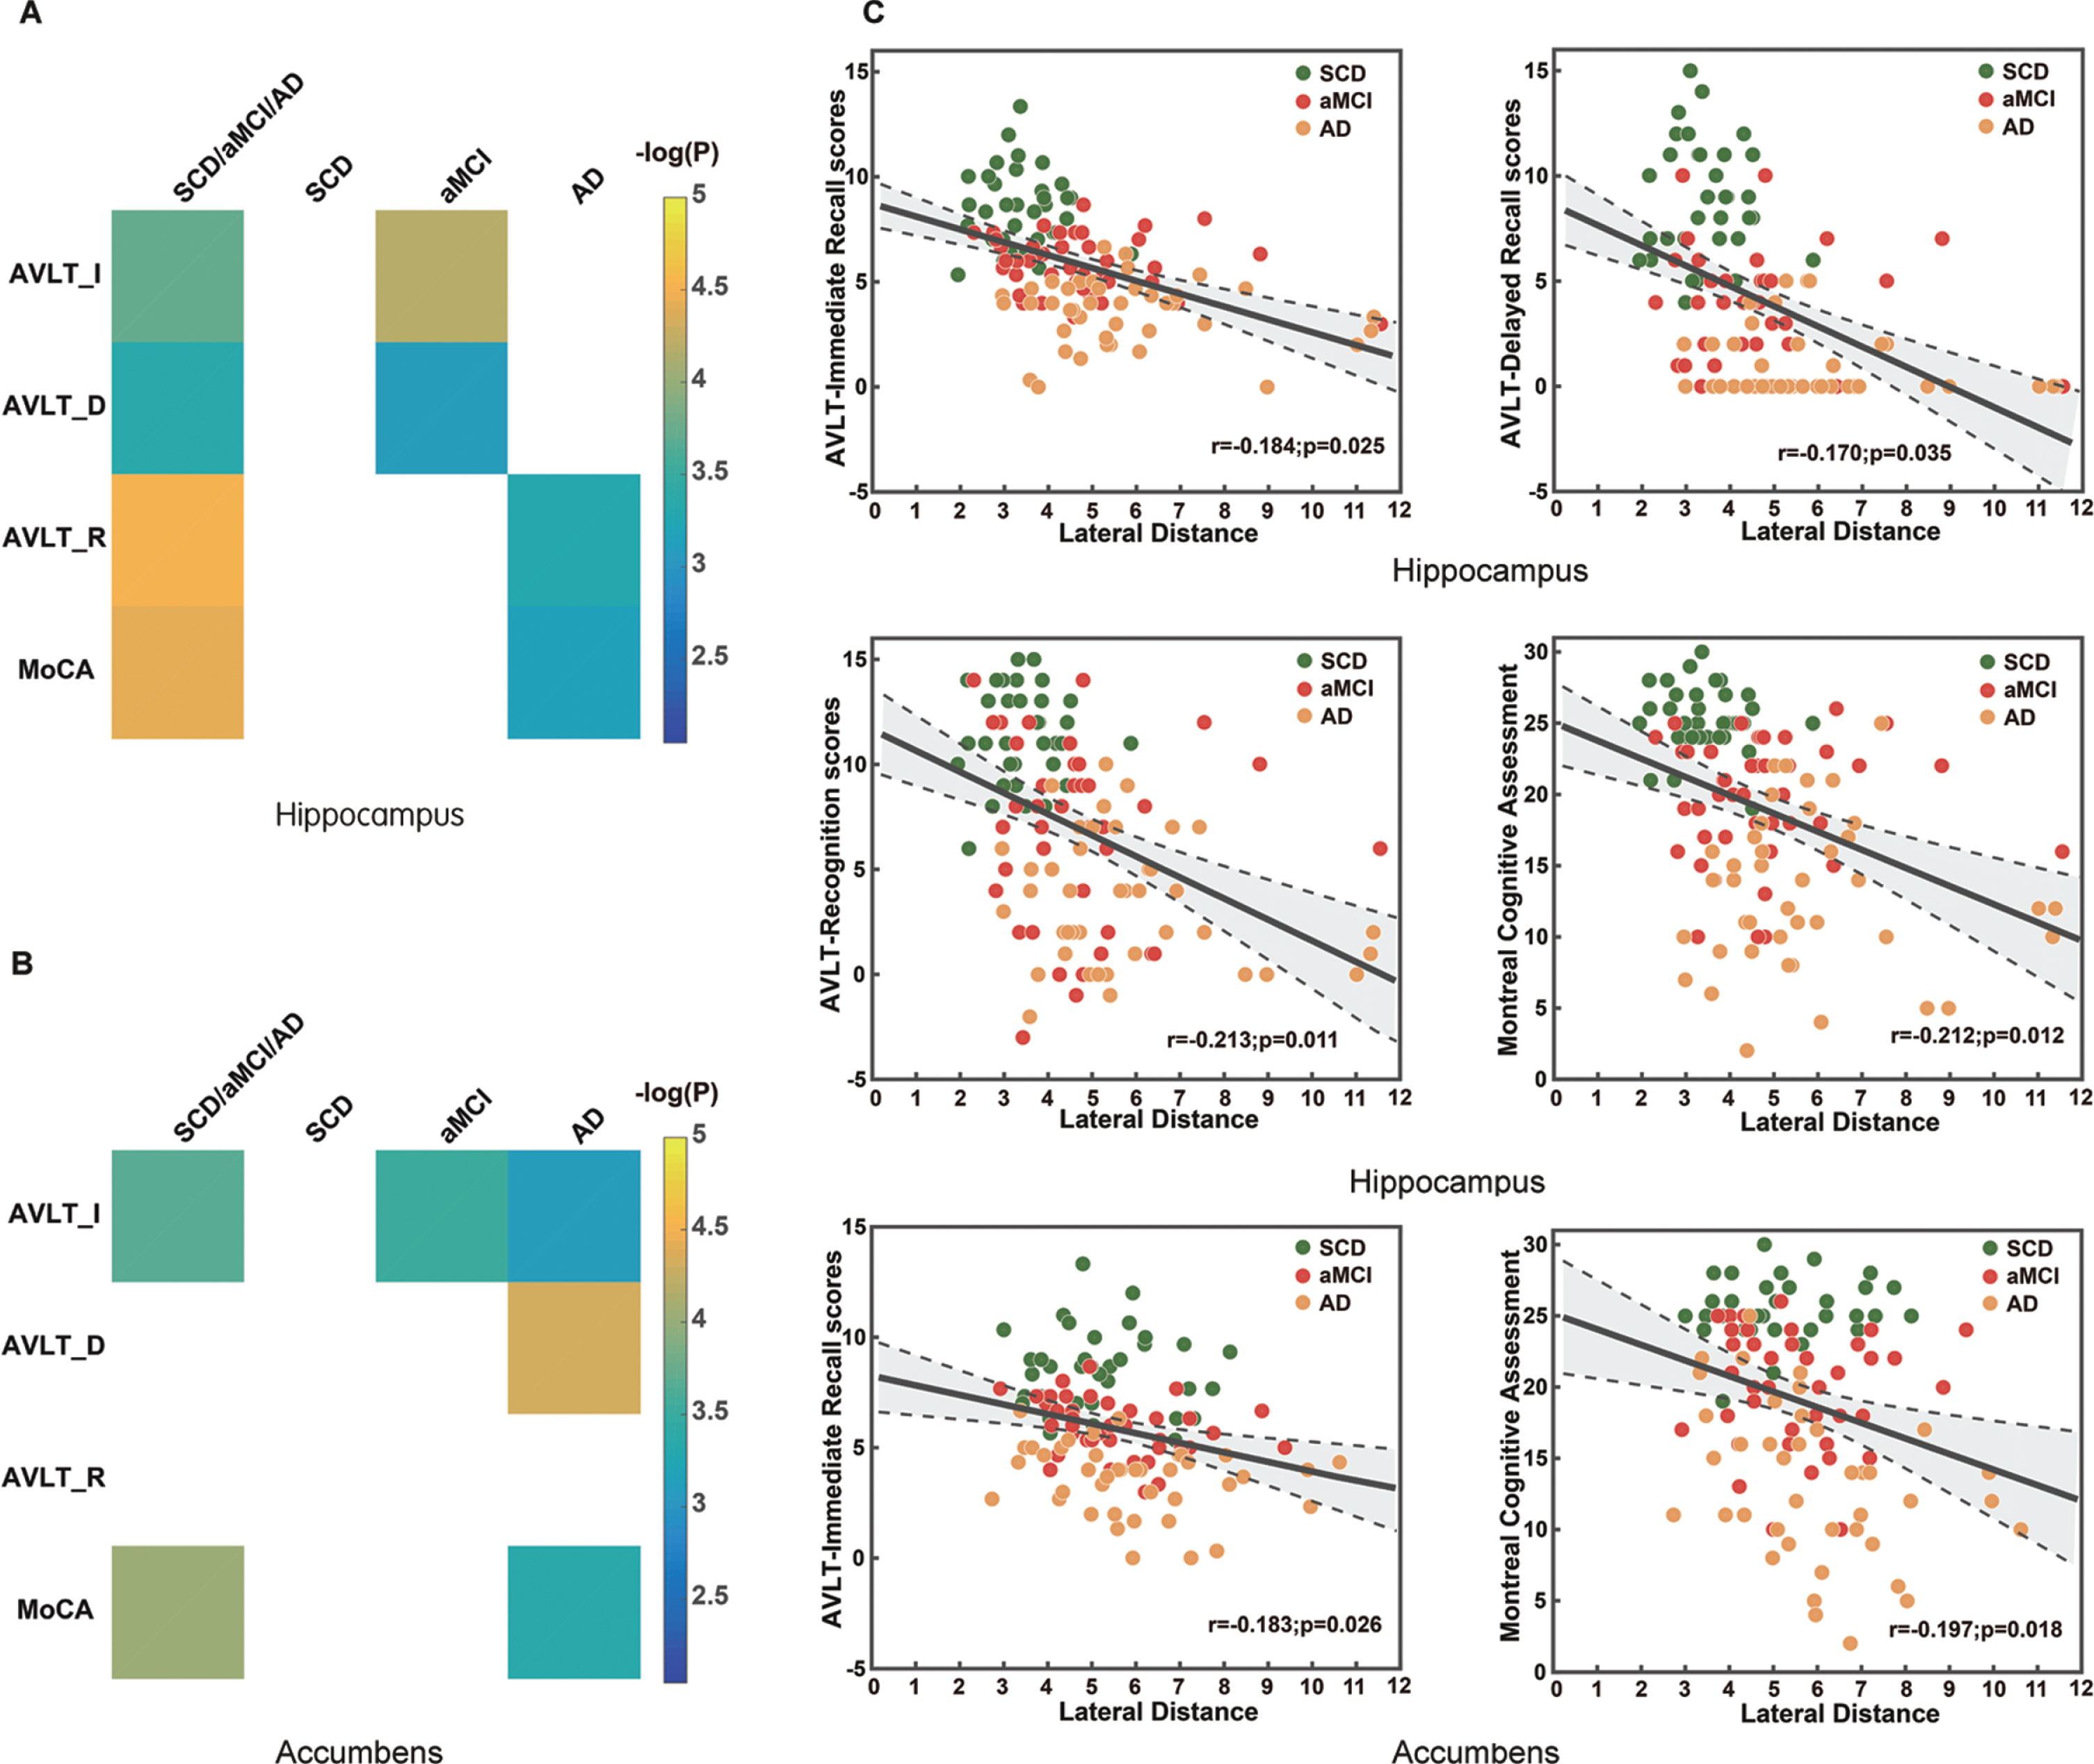
Significant partial correlation analyses between shape asymmetry and neuropsychological test scores. A) The correlation between shape asymmetry of hippocampus and cognitive scores across all cognitive decline subjects and for each group separately. B) The correlation between shape asymmetry of accumbens and cognitive scores across all cognitive decline subjects and for each group separately. C) Scatterplots illustrate the significant correlations across groups. The values in color bar represent -log(P). Higher scores indicate better performance in the cognitive tests. All of the partial correlation models eliminated the effects of age, sex, years of education and diagnostic group. The area between two dotted lines represent 95% confidence intervals.
DISCUSSION
The goal of our research was to evaluate the altered asymmetries in individuals with SCD and aMCI and AD patients. We investigated differences between individuals with SCD, patients with aMCI, patients with AD, and NC, regarding the aberrant neuroanatomical asymmetries in a cross-sectional manner. Our results demonstrated that individuals with SCD showed significant aberrant neuroanatomical asymmetries of subcortical structures in lateral ventricle and cerebellum-WM compared with NC. Then, patients with aMCI exhibited altered subcortical asymmetries in lateral ventricle pallidum, hippocampus, amygdala, accumbens, and ventral DC compared with NC group. Moreover, the asymmetry of lateral-ventricle, cerebellum-cortical pallidum, thalamus, hippocampus, amygdala, accumbens, and ventral DC were significantly different in AD patients compared with NC individuals. In addition, correlations between neuroanatomical asymmetry measures and neuropsychological scores of all cognitive decline subjects were examined in our study. We found that hippocampus and accumbens had a significant correlation with AVLT and MoCA scores in shape asymmetry.
The progression of AD was not symmetrical in the two hemispheres [8, 26], and understanding the asymmetric changes in the progression of AD will help to better understand the pathological process of AD. SCD was defined in preclinical AD stage at high risk of progression to AD [2], and it was a strategy to detect early disease and for dementia prevention. A good understanding of the changes for neuroanatomical asymmetry in SCD population was crucial, meaningful, and cannot be overlooked. In this study, we found that the volume asymmetries of lateral-ventricle, cerebellum-cortical pallidum, amygdala, accumbens and ventral DC were significant different between NC group and AD group. Moreover, significant volume asymmetry differences between NC group and aMCI group were found in pallidum, amygdala, accumbens and ventral DC. For surface area asymmetry, the asymmetry of lateral ventricle was altered in aMCI group compared with NC group. Besides, the asymmetries of surface area in lateral ventricle, thalamus, hippocampus, and amygdala were different between NC group and AD group. These results were concordant with previous volume and asymmetry analysis [1 , 16]. In addition, the results of volume asymmetry had discrepancies with a previous study [30], where the volume asymmetries of hippocampus and caudate in AD patients were significantly different with controls. However, the volume asymmetries of lateral-ventricle, cerebellum-cortex, pallidum, amygdala, accumbens, and ventral DC were found in this study. In our opinion, the different of MRI protocols, MRI systems, and image preprocessing methods are the main reasons to explain the discrepancy. However, differences in statistical models (longitudinal analysis), number of participants, and diagnostic criteria cannot be ignored. Interestingly, the enlarged ventricles were found in MCI [50, 51] and AD patients [52]; our study found that the surface area asymmetry of lateral ventricle altered in individuals with SCD and aMCI patients as well patients with AD compared with NC subjects. In our opinion, the surface area asymmetry of lateral ventricle may become a good predictor for cognitive decline.
Shape-DNA is a novel technique that can characterize complicated geometrical information of neuroanatomical structures. Recently, studies on the analysis of dementia using neuroanatomical shape asymmetry measures have exhibited explosive growth, but the asymmetry changes in the brain in individuals with SCD remain unknown. A previous study with shape-DNA as a shape descriptor demonstrated that the neurodegeneration of subcortical structures in AD-like disease was not symmetrical [30]. Christian et al. [32] demonstrated that AD-related increases in shape asymmetry were of particular interest for some genotypes, which provided biological evidence that brain asymmetry has the potential to become a new biomarker for AD. In our research, shape asymmetry increased along the trajectory of NC-SCD-aMCI-AD in the hippocampus, putamen, and accumbens, but there was no significant difference between each of the diagnostic groups. Specifically, the results in the hippocampus, which can discriminate the NC, aMCI, and AD groups, were similar to those from a previous study [30]. In addition, the significant differences of shape asymmetries in cerebellum WM between NC group and SCD group were found in our study. The volume of cerebellar was associated with cognitive decline in MCI and AD [53], and our results indicated that the shape asymmetry of cerebellum may be used as neuroimaging marker for SCD detection in the future. However, the shape asymmetry in hippocampus cannot effectively discriminate the four groups. In our opinion, sample size and cross-section dataset maybe a limitation. It is worth noting that the shape asymmetry may not be acquired directly by conventional volumetric methods employed clinically.
Abnormal tau lesions (non-argyrophilic pretangle material, argyrophilic neuropil threads, neurofibrillary tangles) in selected types of neurons were crucial for the pathogenesis of sporadic AD [18]. Previous study of sporadic AD provided that AD-related tau changes were seen in hippocampus and amygdala in early stages of AD [18]. Our results found that asymmetry of hippocampus and amygdala can be used to differentiate NC group and aMCI group as well AD group. In sMRI based studies, subcortical volume reductions in hippocampus and amygdala were typically showed in AD patients [6]. Collectively, the abnormality of hippocampus and amygdala showed in sMRI is still an effective predictor in AD preclinical stage.
Clinical neuropsychological testing is a conventional method for memory examinations and disease-assisted diagnoses. Our research contained two classic tests, the AVLT and MoCA (Beijing version). Furthermore, the AVLT consists of three subtests involving examination of immediate memory, delayed memory and recognition. Interestingly, in the partial correlation analyses between shape asymmetry and neuropsychological scores, shape asymmetries in the hippocampus, and accumbens were negatively correlated with the test scores. The lower the test scores were, the larger the shape asymmetry was. In addition, the correlation analysis for each group separately showed that the aMCI group had a greater association with cognitive scores than SCD and AD group. One of two potential reasons is that the cognitive decline is slight in SCD group but serious in AD group, therefore, the cognitive scores of SCD individuals and AD patients have less difference within the group; the other is that the heterogeneity in aMCI group is stronger than those in SCD group and AD group. According to clinical diagnostic criteria, neuropsychological scores gradually decrease along the trajectory of NC-SCD-aMCI-AD. Therefore, we considered that the morphology measurements used in our research had a good concordance with the neuropsychological scores, which were reliable, accurate, and remarkable.
Although our results are persuasive, there are several limitations in our research. The sample size was sufficient to study the significant differences in morphological metrics; however, a larger sample size may further guarantee the reliability of the results. In addition, the diagnosis of SCD is a rigorous process, resulting in high time and labor costs. More samples will be collected for our future research. Datasets with only cross-sectional samples can also be considered a limitation. Besides, very limited neuropsychological battery adopted was always a limitation. Finally, more biomarkers should be acquired to make a biological verification for our results in future. However, our results are in good agreement with previous studies, and adding a longitudinal analysis may reveal additional discoveries.
In conclusion, our study indicated that altered neuroanatomical asymmetries of subcortical structures were exhibited in individuals with SCD, aMCI, and AD patients compared with NC subjects. These results suggested that subcortical asymmetry in structural MRI analysis are sensitive to identify these aberrant neuroanatomical alterations.
Footnotes
ACKNOWLEDGMENTS
The authors thank colleagues at the School of Biological Science & Medical Engineering, Beihang University, Debin Zeng, Siyu Ma, Qiongling Li, for their help with the data sorting and managing. This work was supported by the National Key Research and Development Program of China (2016YFC1306300), the National Natural Science Foundation of China (Grant No. 81972160, 81622025, 61633018 and 81471731), Beijing Municipal Commission of Health and Family Planning (PXM2019_026283_000002).