
Abstract
Background:
Advantages of digital clock drawing metrics for dementia subtype classification needs examination.
Objective:
To assess how well kinematic, time-based, and visuospatial features extracted from the digital Clock Drawing Test (dCDT) can classify a combined group of Alzheimer’s disease/Vascular Dementia patients versus healthy controls (HC), and classify dementia patients with Alzheimer’s disease (AD) versus vascular dementia (VaD).
Methods:
Healthy, community-dwelling control participants (n = 175), patients diagnosed clinically with Alzheimer’s disease (n = 29), and vascular dementia (n = 27) completed the dCDT to command and copy clock drawing conditions. Thirty-seven dCDT command and 37 copy dCDT features were extracted and used with Random Forest classification models.
Results:
When HC participants were compared to participants with dementia, optimal area under the curve was achieved using models that combined both command and copy dCDT features (AUC = 91.52%). Similarly, when AD versus VaD participants were compared, optimal area under the curve was, achieved with models that combined both command and copy features (AUC = 76.94%). Subsequent follow-up analyses of a corpus of 10 variables of interest determined using a Gini Index found that groups could be dissociated based on kinematic, time-based, and visuospatial features.
Conclusion:
The dCDT is able to operationally define graphomotor output that cannot be measured using traditional paper and pencil test administration in older health controls and participants with dementia. These data suggest that kinematic, time-based, and visuospatial behavior obtained using the dCDT may provide additional neurocognitive biomarkers that may be able to identify and tract dementia syndromes.
Keywords
INTRODUCTION
Alzheimer’s disease (AD) and vascular dementia (VaD) are two common types of dementia. Current diagnostic studies for the diagnosis and classification of AD and VaD include cerebrospinal fluid assays, neuroimaging studies of degenerative alterations, and comprehensive neuropsychological testing. Yet, these methods can be expensive, invasive, and time-consuming, which limits their potential utility of widespread screening for neurodegenerative disease [1, 2]. A short, noninvasive test that can identify and screen patients at risk for neuropsychological impairment associated with these dementia disorders could help with diagnostic decision-making; and may be useful for treatment planning as disease-modifying medication becomes available.
Previous research has investigated how the Clock Drawing Test (CDT) can detect underlying neurocognitive impairment in dementia [3–6]. The traditional CDT is comprised of two conditions. In the command condition, the patient is asked to “draw the clock face, put in all of the numbers and set the hands to read 10 after 11.” This is followed by the copy condition where patients are asked to copy a model clock [7]. Regarding dementia identification, the standard paper and pencil administration of the clock drawing test has high specificity, but low sensitivity [6, 8]. Recently, Spenciere and colleagues (2017) examined a multitude of paper and pencil clock scoring systems and concluded that many scoring systems are able to distinguish between clinical groups. However, many paper and pencil scoring systems are difficult to operationalize, and there is no consensus regarding optimal clock drawing criteria. This latter observation is illustrated by comparing the scoring systems used by Rouleau et al. [9], Royal et al. [10], and Cosentino et al. [11]. These clock drawing systems differ with respect to administration procedures, scoring criteria, and the clinical groups that were assessed. Nonetheless, all three studies show meaningful between-group differences that are able to define neurocognitive constructs that underlie dementia syndromes [12].
Over the past decade, a digital version of the clock drawing test (dCDT) has been introduced by the Clock Sketch Consortium [13]. Digital clock drawing protocols use inexpensive digital pen technology. This obviates many of the problems associated with traditional pencil and paper clock drawing scoring systems. Moreover, this technology is able to capture a multitude of behaviors that cannot otherwise be extracted using traditional pen and paper tests. For example, all pen strokes are time stamped and latencies between pen strokes are recorded. This results in precise measurement of all constructional elements such as size, length, pen pressure, and drawing velocity throughout the entire test. The richness of this information allows for a very detailed analysis of process and errors [14, 15] that can inform researchers and clinicians regarding the underlying neurocognitive impairment.
While previous studies have evaluated the use of the traditional clock drawing test for the detection and classification of dementia subtypes [9–11], the advantages of the dCDT have yet to be fully explored for this purpose. A previous research study conducted by Muller and colleagues used several digitally-obtained features measuring kinematic behavior such as pen pressure and drawing velocity extracted from digital pen data. Logistic regression analyses were able to differentiate patients with amnestic mild cognitive impairment (MCI) versus mild AD dementia [16]. Subsequent research [17] using machine-learning models were able to differentiate patients with memory impairment, vascular cognitive disorders, and healthy individuals. In a third study, researchers extracted 350 features from digital clock drawings from 163 patients. Neural networks and information theory-based feature selection methods were able to classify 91.42%of AD versus non-MCI patients [18].
In the present study, we evaluated how well machine learning analysis using Random Forest [19] models can differentiate between dementia patients diagnosed with AD, VaD associated with MRI evidence of subcortical white matter alterations, and non-demented elder controls.
METHODS
Participants
Data were acquired from two prospective research investigations approved by the University of Florida’s Institutional Review Board; and, from an investigation conducted at Rowan University. Written informed consent was obtained from all participants with all investigations conducted in accordance with the Declaration of Helsinki.
Healthy control (HC) participants
Inclusion criteria were: age 55 or older, English as primary language, intact instrumental activities of daily living (IADLs), and baseline neuropsychological testing negative for cognitive impairment per Diagnostic and Statistical Manual of Mental Disorders –Fifth Edition [20]. Exclusion criteria were: the presence of neurodegenerative disorders; major medical illness including head trauma or heart disease that could induce encephalopathy; major psychiatric disorders; documented learning disabilities; a seizure disorder or other significant neurological illness; less than a sixth-grade education, and history of substance abuse. The Telephone Interview for Cognitive (TICS) Status [21] was used to screen for dementia. An in-person appointment was completed where neuropsychological and clock drawing protocols were administered along with an assessment of medical comorbidities (Charlson Comorbidity Index [22]). The presence of anxiety, depression, and ADL/IADL abilities were also assessed. Data were reviewed by a licensed clinical neuropsychologist, double scored, and double data entered for accuracy.
Dementia participants
Individuals with dementia were evaluated at the New Jersey Institute for Successful Aging (NJISA), Memory Assessment Program, School of Osteopathic Medicine, Rowan University. Individuals were seen by a neuropsychologist, psychiatrist, and social worker. Inclusion criteria included age 55 and up, with exclusion criteria the same as that for HC participants except neither the TICS nor the Charlson Comorbidity Index were administered. In addition to neuropsychological assessment, all dementia participants were evaluated with the Mini-Mental State Exam (MMSE) [23], serum studies, and an MRI scan of the brain. Additional exclusion criteria included vitamin B12, folate, or thyroid deficiency. Individuals with AD and VaD associated with this study have been described in prior research studies [24]. As described in prior reports [25, 26], these individuals were diagnosed with either AD (n = 29) or VaD (n = 27) using standard diagnostic criteria, respectively.
Digital Clock Drawing Test (dCDT) parameters
The dCDT yields a corpus of over 2,000 variables. In the current research 37 dCDT features were used for classification. This corpus of dCDT variables was chosen based on prior research [18] demonstrating the capacity of these variables to dissociate between clinical groups (Table 1).
Digital Clock Drawing Test feature description
Clock face area was [27] calculated with the formula (pi*(average of two radii)∧2). The presence of anchor digits [28] was determined whether participants initially drew the digits 12, 3, 6, and 9 inside the clock face before drawing the remaining digits. Kinematic parameters included mean pen pressure, and the ratio of mean pen pressure divided by mean drawing velocity. All dCDT features described in Table 1 were extracted from the digitally acquired drawings from both the command and the copy test conditions. When a feature could not be calculated (e.g., the ratio of the hour hand length and minute hand length when a hand is missing) the feature was reported as missing. We handled missing data using Multivariate Imputation by Chained Equations (MICE) [29].
Machine learning analysis
As stated above, our primary goal was to use Random Forest as a classification model to determine how well dCDT features from the three data sets, (1) command, (2) copy, and (3) combined command/copy test conditions), could classify individuals into their respective diagnostic categories based upon two binary classification problems, i.e., (1) all dementia participants versus HC classification, and (2) AD versus VaD classification (Fig. 1). Random Forest is a machine learning algorithm that has shown strong performance for classification tasks in public health studies [30, 31]. Random Forest models generally do not make any assumption about the attribute of distributions and also consider the interactions between the attributes. Unlike logistic regression models, Random Forest models are not limited to learning linear decision boundaries. Additionally, their ensemble and boosted approach can address overfitting.

Analysis flow. The analysis in the study included preprocessing the raw pen movement data, extracting features, and developing and testing classifiers.
We used nested cross-validation for the development of Random Forest classifiers and five-fold cross-validation for both inner and outer folds in classifying dementia versus HC. Due to the modest sample size, we used three-fold cross-validation for both inner and outer folds to classify AD versus VaD. In addition to accuracy, we reported several other performance metrics including area under the ROC curve (AUC), sensitivity, specificity, and the F1 score, since accuracy alone is not sufficient to reflect the performance of the model for imbalanced datasets. We repeated the experiments 50 times and reported confidence intervals for all performance metrics. We also reported the ranking of variables’ importance in the final models in terms of mean decrease in Gini index. The Gini index was used to express the probability that a random element in a data set is randomly and incorrectly labeled according to the distribution of the labels. Thus, the importance of variables are ranked based on how much they each decrease the Gini index in splitting trees in a random forest model.
Descriptive statistics
Chi-Square analyses or t-tests were used to compare groups on demographic and the top-ten clock variables selected using variable importance from Random Forest models. Significance was set at p < 0.05. Bonferroni correction was applied to account for multiple comparisons. All analyses were performed using R version 3.5.2.
RESULTS
Demographic and clinical data
Our final dataset comprised 231 individuals (56 dementia, 175 HC; Table 2). Dementia individuals were older (dementia age = 80.04, HC age =68.37; p < 0.001); had fewer years of education (dementia = 12.75, HC = 16.39, p < 0.001); and scored lower on the MMSE (dementia total = 22.35, HC total = 28.81, p < 0.001). The AD and VaD dementia groups did not differ for age. However, the VaD group was comprised of more female individuals (female/male in VaD: 85.18%, in AD: 51.72%; p < 0.016) with fewer years of education (VaD =11.85 versus AD = 13.61; p < 0.033; Table 3).
Participants demographic/clinical characteristics
Demographic and clinical characteristics of dementia patients
Machine learning analysis: HC versus dementia
None of the participants produced perseverations when drawing digits or drew digits past the number 12, or a single line connecting the numbers 11 and 2 (i.e., the ten-eleven stroke). These errors, along with missing hands and more-than-two hands variables were excluded because they were absent or occurred very infrequently (command = 2.16%and 0.43%; copy = 0%and 1.30%, respectively). Random Forest classifiers were developed using clock features extracted from command clocks, copy clocks, and combining command and copy clocks. All three models performed similarly in detecting dementia versus HC participants. However, models developed using data from both the command and copy test condition performed best; e.g., AUC medians differentiating between HC and dementia were command (89.76%), copy (87.54%), and command/copy (91.52%; Table 4).
Model performance reported for the dementia versus HC classification –AUC: Area under the ROC curve
Machine learning analysis: AD versus VaD
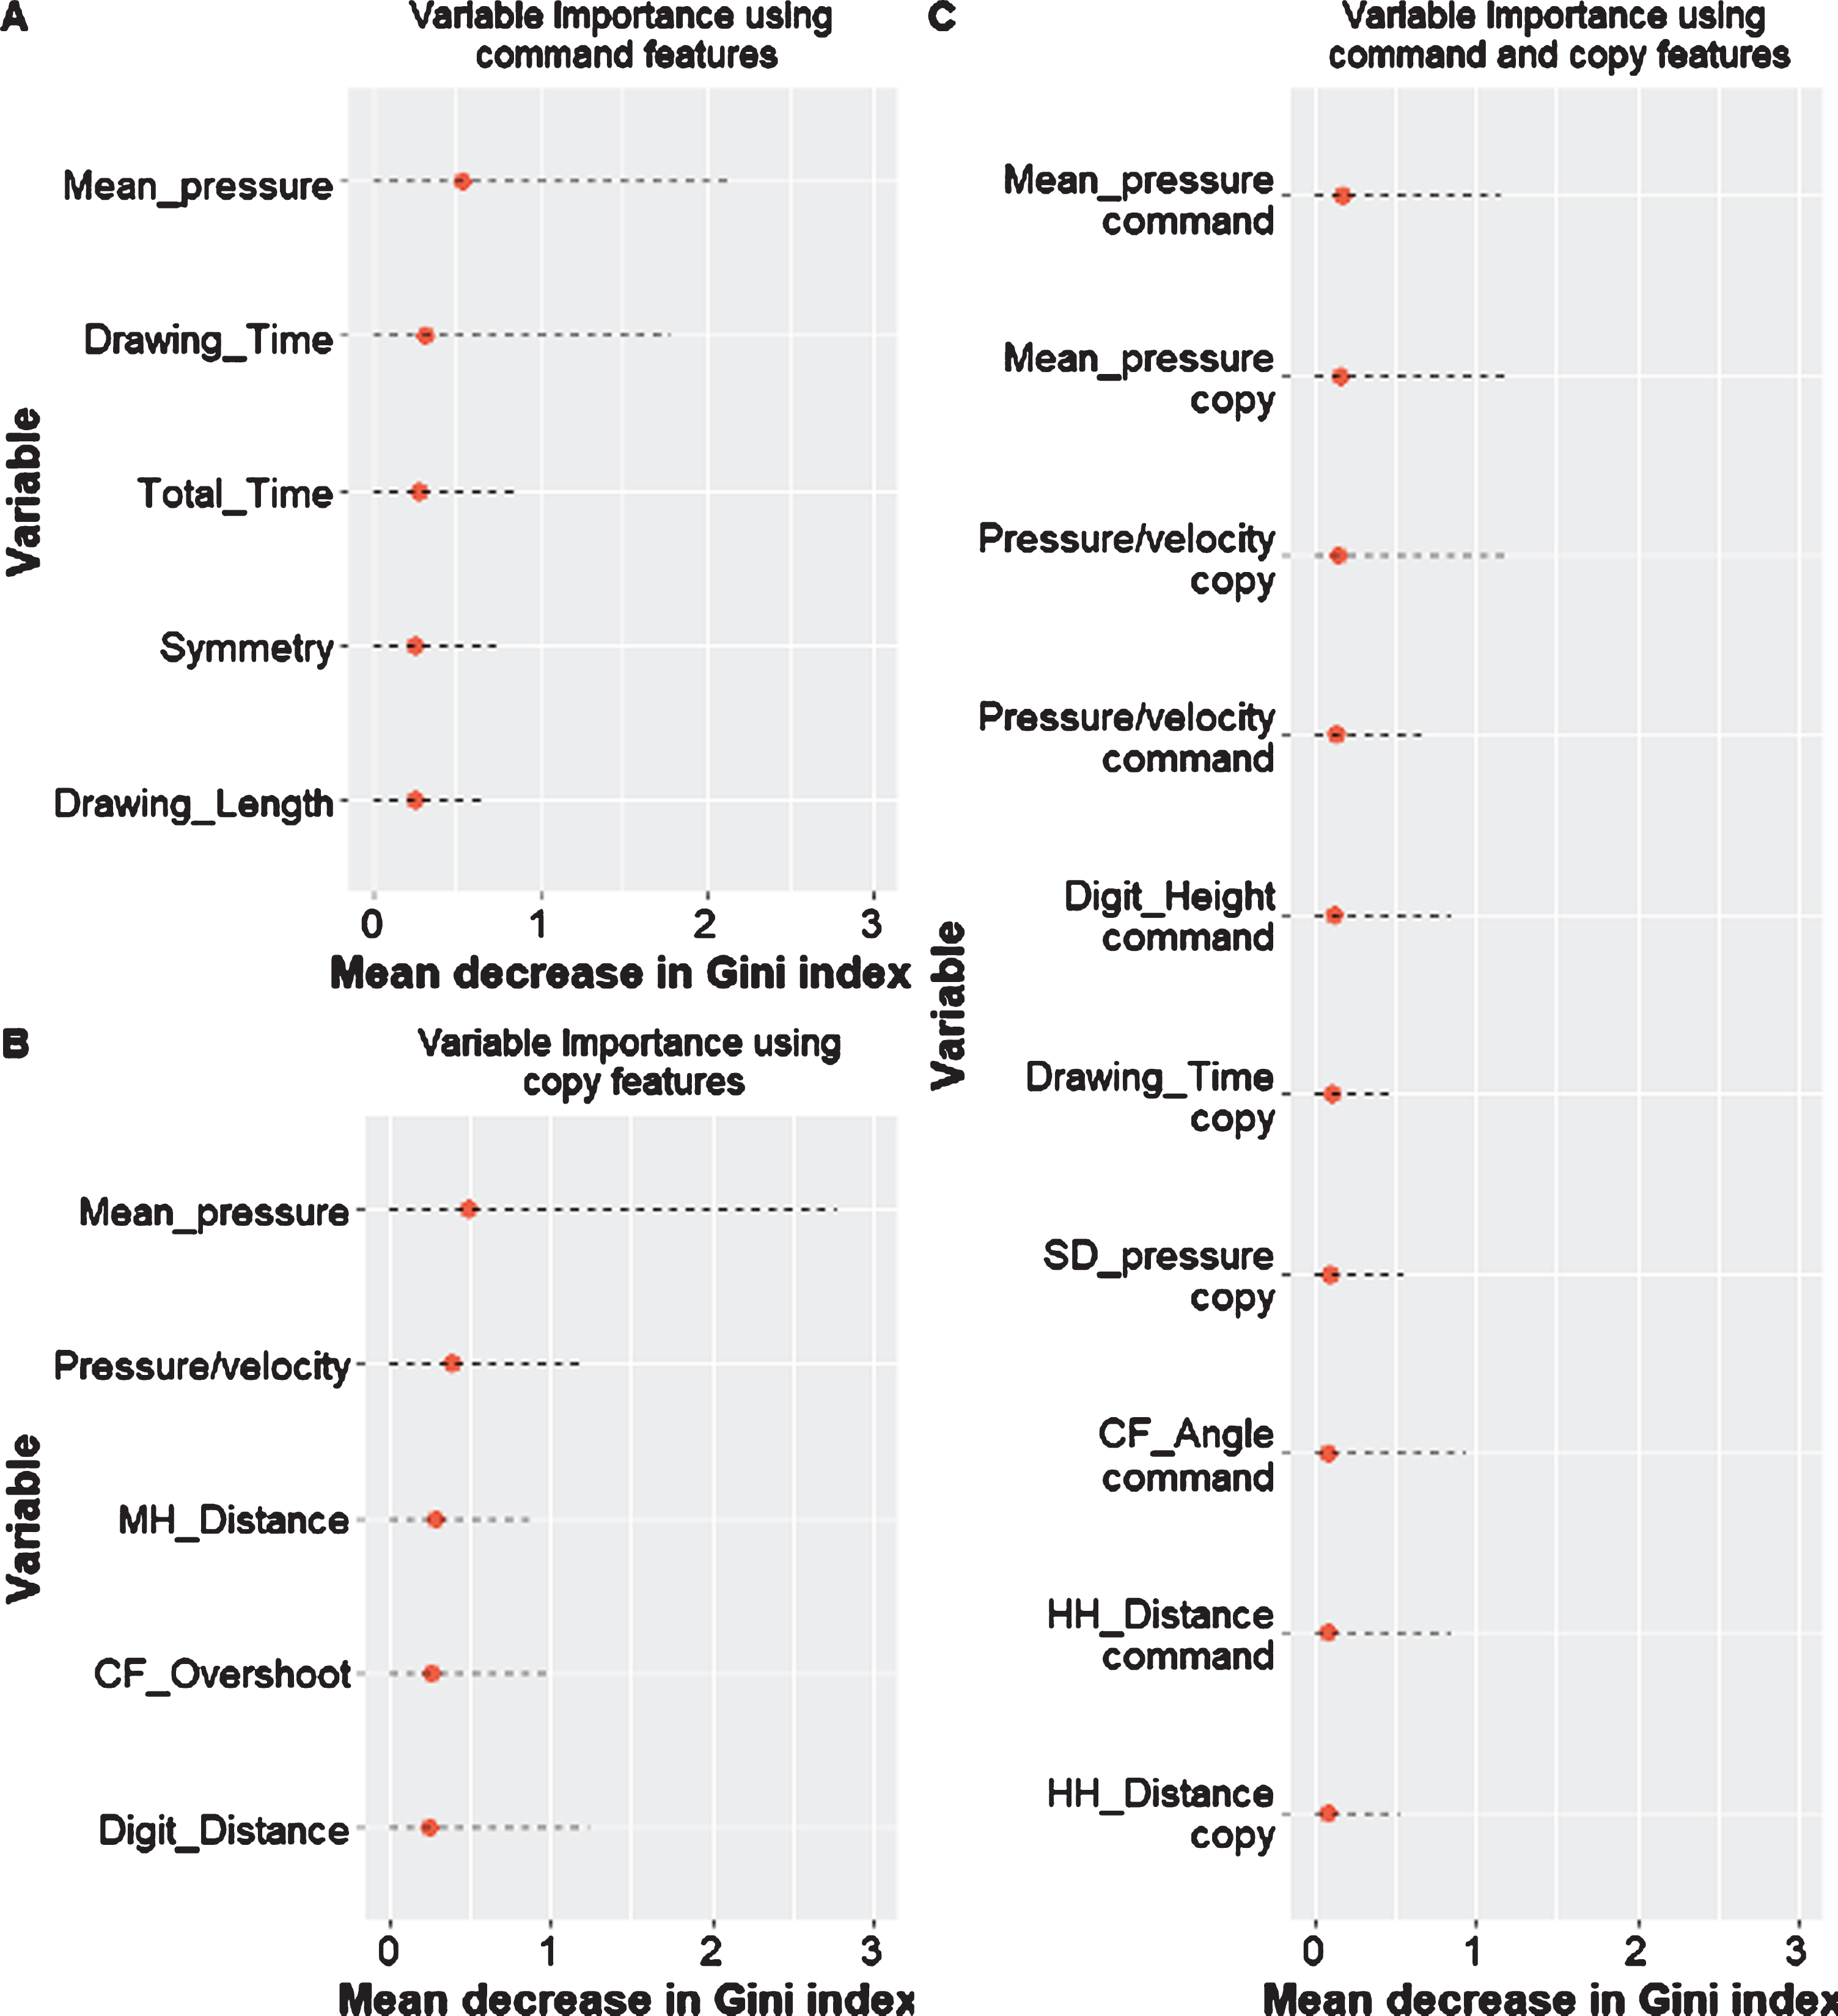
The models performed similarly in classifying AD and VaD patients. Models developed using both the command and copy test conditions performed slightly better than models developed using data from command or copy clocks (AUC medians - command = 74.82%, copy = 73.70%, and command & copy = 76.94%; Table 5). Figures 2 3 show the median and 95%confidence interval of the top five variables for models using a single clock condition; and the top 10 variables for models using both clock conditions according to their Gini index (ranked based on the median value).
Model performance reported for the VaD versus AD subtype classification –AUC: Area under the ROC curve

Ranking of the top ten variables ranked based on their median in 50 runs for Random Forest models for classification of dementia versus HC using A) command data, B) copy data, and C) command and copy data together.
Ranking of the top ten variables ranked based on their median in 50 runs for Random Forest models for classification of dementia subtypes using A) command data, B) copy data, and C) command and copy data together.
Clock features of interest: HC versus dementia
Figure 2 shows the median and 95%confidence interval of the 10 top variables of interest for models using both command and copy features according to their Gini index (ranked based on the median value). Table 6 displays between-group analyses for these 10 variables. Features that statistically differentiated between HC versus all dementia participants were approximately equally represented between the two clock drawing test conditions (command=3; copy=4). As displayed in Table 6, groups were differentiated based on a combination of features measuring kinematic operations, decision-making latency, and the location of features within the clock face. Mean pen pressure (command & copy) was greater for HC compared to dementia. Post-clock face latency was slower for dementia as compared to HC. Finally, precision regarding the location of the hour and minute hands in relation to the clock face center dot was more accurate for HC compared to dementia.
Ranking of the top ten command and copy clocks variables - All dementia patients versus HC participants (means and standard deviations; *signifies variables that remain significant after Bonferroni correction)
Clock features of interest: AD versus VaD.
Figure 3 shows the median and 95%confidence interval of the 10 top variables of interest for models using both clock conditions together according to their Gini index (ranked based on the median value). In this analysis, there were perhaps, more features from the copy as compared to the command test condition that differentiated between groups (copy = 4; command = 2). As displayed in Table 7, groups were differentiated based on a combination of features measuring kinematic operations and drawing speed. Mean pen pressure for both test conditions was greater for VaD compared to AD patients. The ratio of pen pressure and drawing velocity was greater for VaD compared to AD consistent with reduced mean pen pressure in AD patients along with slower drawing speed in VaD patients. Finally, total drawing time was slower for VaD compared to AD in the copy test condition.
Ranking of the top ten command and copy clocks variables comparing AD and VaD participants (mean and standard deviation; *signifies variables that remain significant after Bonferroni correction)
DISCUSSION
The purpose of the current research was to examine how well features from the dCDT used with machine learning models could correctly classify HC versus AD/ VaD dementia patients; and patients diagnosed clinically with AD versus VaD. As symptoms and behavior(s?) suggesting either MCI or dementia emerge decades before sufficient functional and neuropsychological impairment occurs, it is widely believed that they (the symptoms and behaviors) would permit a clinical diagnostic. At such time that disease-modifying medication is available, the putative target population will most certainly be individuals early in the course of their illness. An important question revolves around the neuropsychological methods or techniques that are able to identify emergent AD/ VaD syndromes.
The MMSE and Montreal Cognitive Assessment (MoCA) are commonly administered neuropsychological tests used to screen for neurocognitive impairment. The problems associated with the MMSE and MoCA include the lack of granularity of the behavior that can be assessed and scored. The dCDT obviates this problem. The time necessary to administer the test is very reasonable; and, as shown above, a large corpus of highly nuanced behaviors can be measured. As compared to prior digital clock drawing research, the data described above achieved comparable or better rates of classifying HC versus dementia individuals [15, 25]. Our classification rates are also comparable to prior research comparing HC versus individuals diagnosed with MCI recruited from a memory clinic [18].
Differences between healthy control and dementia participants
From the entire corpus of approximately 2,000 dCDT features, a circumscribed corpus of 37 command/copy dCDT features were selected and assessed with machine learning analyses. Ten variables of interest emerged. The decision to use the corpus of the 37 features described above was guided by the fact that these variables measure very common and necessary behavior for successful test performance.
In the analysis classifying HC versus all dementia individuals, features that were able to dissociate between groups included kinematic parameters that measured command and copy pen pressure. In both clock drawing test conditions, pen pressure was lower when dementia patients were compared to HC participants. These data are consistent with prior clock drawing research [15]. These data are also similar to prior research associating reduced pen pressured among patients with Parkinson’s disease (PD) versus HC [32] when PD patients were asked to draw an Archimedean spiral. Accurate output using a pen requires the production of comparatively gross strokes such as the clock face, and the production of discrete strokes such as digits and the clock hands [33]. The current research opted to only analyze mean pen pressure for the entire drawing. However, it is possible that greater between-group differences would have emerged to the extent pen pressure data could have been obtained from each portion of the drawing (i.e., clock face, number placement, time setting).
Time-based dCDT parameters
In the copy condition only, participants with dementia produced lower Post-Clock Face Latency (PCFL). PCFL is one of a number of decision-making latencies obtained from the dCDT [34] and measures the time necessary to transition from drawing the clock face circumference portion of the test to the next portion of the test. Most often PCFL measures the time between the completion of the clock face and drawing either the center dot or the number 12. Slower PCFL for dementia versus HC participants in the copy test condition might suggest the need for greater scanning back and forth from the clock model to the patient’s drawing. If this is true, then slower copy PCFL suggests that copying a model of a clock might not be as automatized as expected. Concomitant measures of visual scanning behavior while patients are drawing would help disambiguate this issue. Also, in the copy condition only, dementia, as compared to HC individuals were less accurate in drawing both hands in relation to the center dot.
AD versus VaD patients
Many of the variables of interest described above also dissociated AD versus VaD patients. Patients with AD obtained lower scores for command/copy pen pressure compared to VaD. However, participants with VaD, relative to AD, appeared to exert greater pen pressure in the context of slower velocity. VaD patients also produced slow total time to completion in the copy test condition compared to AD patients. Both of these findings are consistent with previous research showing that VaD patients produce less ink output as a function of time [35]. Prior research has argued that the neurocognitive constructs underlying clock drawing to command and copy are complimentary but not identical. These observations are consistent with the data described above showing that optimal classification was achieved using a combination of command and copy features. Finally, a question that needs to be addressed revolves around the practicality of extracting the behavior described above. Does the analysis of nuanced graphomotor output truly offer a clinical advantage? The data described above appears to answer this question in the affirmative. However, we acknowledge that additional research examining other clinical groups needs to be undertaken.
The current research is not without weakness. First, we recognize the need for replication in larger samples and correction for age/education differences between dementia and the HC participants. There is a small but statistically significant group difference in education. It is possible that lower education may negatively impact clock drawing performance; education is considered neuroprotective against the emergence of dementia [36, 37]. There is also an age difference between dementia and HC, with the HC group younger. A post-hoc analysis showed us, however, a similar model (lower AUC, 87.89 for command and copy; 87.24 command; 86.16 copy) for participants age 70 and up (67 HC and 52 dementia). Although dementia groups did not differ for age, this is another factor that can potentially influence clock drawing behavior between and within dementia participants. Second, while we opted to use Random Forest classification models because of their overall strong performance in other health domain studies, the performance of other machine learning models needs to be evaluated. While Random Forest model performance is not affected significantly by collinearity among variables, variable importance will, nonetheless, be impacted; the reported variable importance values need to be interpreted with caution. Because of the modest and unbalanced sample size, weighting the outcome classes and under-sampling/oversampling techniques may also improve the performance of the models. Third, marginally different recruitment procedures were used to recruit healthy control and dementia participants (e.g., the HC group did not complete laboratory measurements examining vitamin B12, folate, or thyroid deficiency, that may have resulted in exclusion). Finally, most of the participants in the current research were white and right-handed, suggesting the need to replicate the findings reported above with participants from other ethnic/demographic communities.
Despite these limitations, the current research has several strengths including data from two common dementia subtypes and the analysis of features that measure kinematic behavior. These data suggest that machine learning analyses of digitally acquired output using the dCDT could provide much needed neuropsychological biomarkers that might be used to identify and monitor changes in cognition over time for dementia syndromes. Future studies need to examine dCDT variables for validity and cross comparison across different test modalities (pen capture versus tablet) and dCDT variables’ values for differentiating HC from neurodegenerative diseases including those with and without dementia (e.g., PD) [36].
Footnotes
ACKNOWLEDGMENTS
We sincerely thank the participants who provided time and effort toward this investigation and allowed us to improve our understanding of clock drawing behaviors. We also sincerely thank Dana Penney, PhD, Director of Neuropsychology, Lahey Hospital, Boston, MA, and Randall Davis, PhD, Professor, Massachusetts Institute of Technology, Cambridge, MA—without whom this study would not have been possible due to their development of the dCDT. Drs. Penney and Davis are the originators of the digital clock drawing software used within the current investigation. We also sincerely thank the research coordinators and administrative staff members who assisted with data collection, Institutional Research Board processing, and administrative funding paperwork.
NIH grants from the National Institutes of Health (R01 AG055337, R01NS082386; R01 NR014810) and National Science Foundation (NSF 13-543). P.R. was supported by CAREER award, NSF-IIS 1750192, from the National Science Foundation (NSF), Division of Information and Intelligent Systems (IIS), NIH NIBIB R21EB027344-01, and by NIH R01AG055337.