
Abstract
Background:
The PRESENILIN genes (PSEN1, PSEN2) encoding for their respective proteins have critical roles in many aspects of Alzheimer’s disease (AD) pathogenesis. The PS2V transcript of PSEN2 encodes a truncated protein and is upregulated in AD brains; however, its relevance to AD and disease progression remains to be determined.
Objective:
Assess transcript levels in postmortem AD and non-AD brain tissue and in lymphocytes collected under the Australian Imaging Biomarker and Lifestyle (AIBL) study.
Methods:
Full length PSEN2 and PS2V transcript levels were assessed by quantitative digital PCR in postmortem brain tissue (frontal cortex and hippocampus) from control, AD, frontotemporal dementia (FTD), and Lewy body dementia (LBD). Transcript levels were also assessed in lymphocytes obtained from the Perth subset of the AIBL study (n = 160). Linear regression analysis was used to assess correlations between transcript copy number and brain volume and neocortical amyloid load.
Results:
PS2V levels increased in AD postmortem brain but PS2V was also present at significant levels in FTD and LBD brains. PS2V transcript was detected in lymphocytes and PS2V/PSEN2 ratios were increased in mild cognitive impairment (p = 0.024) and AD (p = 0.019) groups compared to control group. Increased ratios were significantly correlated with hippocampal volumes only (n = 62, β= –0.269, p = 0.03).
Conclusion:
Taken together, these results suggest that PS2V may be a marker of overall neurodegeneration.
Keywords
INTRODUCTION
The PRESENILIN genes (PSEN1, PSEN2) encoding for their respective Presenilin (PS) proteins (PS1 and PS2) have critical roles in many aspects of Alzheimer’s disease (AD) pathogenesis (reviewed in [1]). Most notable is the catalytic role for PS in the γ-secretase cleavage of the amyloid-β protein precursor (AβPP) to generate the amyloid-β-protein (Aβ). The Aβ peptide is a major constituent of amyloid plaques that accumulates early in the disease process [2–4], and accumulation of this peptide has key contributions to AD pathogenesis. Dysregulated proteolytic processing of AβPP contributes to this accumulation and is a major feature of PSEN1/2 clinical mutations that cause the majority of Autosomal Dominant AD cases (ADAD). Mutations in the PSEN genes and deletions resulting in alternative transcripts are also associated with frontotemporal dementia (FTD) [5–9].
Both PSEN1 and PSEN2 genes contain 10 coding exons. Exclusions/deletions of these exons lead to the generation of normal physiological or pathological alternate PSEN transcripts. Examples include the ADAD associated in-frame deletion of exon 9 (PS19, [10–12] or exon 8 of PS1 (PS18) [13, 14]. PSEN2 transcripts lacking exons 3 and 4 (PS2 exon 3, 4) or 3, 4 and 8 (PS2 exon 3, 4, 8) have been described as naturally occurring in various tissues, including brain [15]. More recently, naturally occurring PSEN2 transcripts lacking part of exon 3 to part of exon 7 have been identified [16]. Whether these transcripts are functional remains to be determined. However there has been consistent evidence for a role for one particular PSEN2 transcript in disease pathogenesis, PS2V, particularly in sporadic AD.
PS2V was originally identified as a transcript of PSEN2 lacking what was then designated exon 5 sequence (exon “V”) [17, 18]. In fact, this exon is currently recognized as exon 6 of the gene [19]. PS2V is upregulated under conditions of hypoxia [18, 20], cholesterol loading [21] and its truncated open reading frame is mimicked by an ADAD mutation (K115Efx10) [19, 23]. The exclusion of exon 6 results in the ligation of exons 5 and 7, introducing a frameshift that results in a premature stop codon terminating the open reading frame in exon 7 resulting in the production of a truncated PS2 protein isoform. This isoform contains 124aa and 1 of the 9 transmembrane domains. Expression of PS2V transcript and protein has been identified in brain and is increased in AD compared to control brain [17, 24] indicating that PS2V formation is a feature of the AD brain. The physiological role of this truncated PSEN2 transcript and its role in AD pathogenesis remains poorly understood. We and others have shown that formation correlates with increased Aβ levels [18, 21], stimulates γ-secretase activity [23] and disrupts the unfolded protein response (UPR) signaling in cells and zebrafish embryos, thereby increasing cell susceptibility to ER stress [18, 23].
Although, PS2V has been shown to be present and upregulated in AD brain, whether similar changes are observed in other neurodegenerative diseases remains to be determined. Quantitation of the PS2V transcript, compared to the full-length PSEN2 transcript in control, AD, and non-AD neurodegenerative samples, becomes important when considering the physiological or pathological relevance of this transcript. Further, to determine if it is a relevant marker in AD progression detection of PS2V transcripts in more accessible samples should be considered to assess whether similar changes are observed in AD or earlier (i.e., mild cognitive impairment, MCI) and if there are associations with brain imaging markers. In previous studies, qualitative/semi-quantitative methods (RT-PCR, Q-PCR, and western immunoblotting) have been used to detect and assess levels of transcript and protein in postmortem human brain tissue [17, 24] or guinea pig brain tissue [21]. Here we use digital PCR to quantitatively determine levels of full length or truncated PSEN2 transcript in the frontal cortex and hippocampus of control, AD, and non-AD (FTD and Lewy body disease [LBD]) samples. To begin to explore the relevance of PS2V transcript in disease progression, we also assessed levels in lymphocyte samples from control, MCI, and AD participants in the Australian Imaging, Biomarker and Lifestyle (AIBL) study.
MATERIALS AND METHODS
Brain tissue
Human brain tissue from controls, AD, and non-AD cases (LBD, FTD) (see Table 1) were obtained from the West Australian and New South Wales bra-nches of the Australian Brain Bank Network (AB-BN). Frontal cortex and hippocampus were obtained from all cases. All tissues used were accessed and used with approval from Curtin University Human Ethics committee (SoBS-02-14) and collected with approval from Hollywood private hospital (HPH264) and Edith Cowan University (ECUMartins3325) ethics committees. All samples were stored at –80°C.
PSEN2 and PS2V levels in frontal cortex (FC) and Hippocampus (Hipp) in control, AD, FTD and LBD brain samples
AIBL participants
This study reports on data collected form the AIBL study, a prospective longitudinal study of aging, which contains samples from Perth and Melbourne. Cognitive, neuroimaging, and laboratory assessments were performed at 18-monthly intervals, with over 7.5 years of data available (0, 18, 36, 54, 72, and 90 months). This cross-sectional study presents 36-month data from the Perth subset of AIBL containing (135 cognitively normal controls (CN), 13 MCI, and 12 AD). Information regarding AIBL study design, enrolment process, neuropsychological assessments, and diagnostic criteria have been previously described [25]. Ethics approval for the AIBL study and all experimental protocols was provided by the ethics committees of Austin Health, St Vincent’s Health, Hollywood Private Hospital, and Edith Cowan University. All experiments and methods were carried out in accordance with the approved guidelines and regulations and all volunteers gave written informed consent before participating in the study.
Lymphocyte fractionation
Blood fractionation of samples collected at the 36-month AIBL collection time point provided the lymphocyte samples utilized in this study. Briefly, the white buffy coat was removed from blood samples and added to equal volumes of phosphate buffered saline (PBS). The white buffy coat layer and PBS was then added to Ficoll-Paque, followed by centrifugation at 300 g, 20°C for 20 min. The lymphocyte layer was then separated, and additional PBS was added. The cell suspension was then removed and spun 800 g, 20°C for 5 min. Finally, the supernatant was discarded, and the cell pellet was re-suspended in deionized H2O and stored in liquid nitrogen.
Extraction of total RNA, conversion to cDNA
Approximately 100 mg of brain tissue sample was stored in RNAlater ICE (#AM7030 ThermoFisher Scientific, Au) at –80°C until RNA extraction was carried out with the RNeasy Lipid Tissue Mini kit (#74804 Qiagen, CA). RNA from lymphocytes was extracted with the Bioline, Isolate II RNA mini kit (BIO-52073). All cDNA was prepared using the Biolone, Tetro cDNA kit (BIO-65043).
Digital PCR analysis of presenilin transcripts
Digital PCR allows direct quantification of cDNA copy numbers [26]. It was carried out based on the assumption of Poisson distribution of copies where the number of template copies originally present in the sample can be recalculated from the number of wells in which amplification has successfully occurred. Digital PCR was performed on a Quant-Studiotrademark 3D Digital PCR System (Life Technologies, Au) using the following preparation; 20μl reaction mixes containing 9μl 1X QuantStudio® 3D digital PCR Master Mix (Life Technologies, Au), 1μl of 20X Sybr® dye in TE buffer, 50 ng cDNA, 200 nM of specific primers (PSEN2 Forward-sequence; 5‘ ACACGCCATTCACTGAGGACA 3’, Reverse-sequence; 5‘ GCCATGGATGAACTTGTA-GCAG 3’ and PS2V Forward-sequence; 5‘ GACAG-CTTTCATCCATGGCTG 3’, Reverse-sequence; 5‘ GGTAGATATAGGTGAAGAGGAACAGC 3’), and 6.3μL of nuclease-free water (#129114 Qiagen, CA). The QuantStudio® 3D Digital PCR Master Mix contains 6-carboxy-X-rhodamine, known as ROX dye, which served as a passive reference. 14.5μl of the reaction mixture was loaded onto a QuantStudiotrademark 3D digital PCR 20 K chip (Life Technologies, Au) using an automatic chip loader (Life Technologies, Au) according to manufacturer’s instructions. The chip is divided into 20,000 consistently sized reaction wells in which the nucleic acid mixture was randomly divided. Loaded chips underwent thermo-cycling on the Gene Amp 9700 PCR system under the following conditions: 96°C for 10 min, 42 cycles of 60°C for 2 min, and at 98°C for 30 s, followed by a final extension step at 60°C for 2 min. After thermo-cycling, the chips were imaged on QuantStudiotrademark 3D instrument, which assesses raw data and calculates the estimated concentration of the nucleic acid sequence targeted by the FAMtrademark dye labelled probes using the Poisson distribution [27, 28]. Final cDNA concentration values were represented as cDNA copy numbers per 50 ng of cDNA.
APOE genotyping
DNA extraction and APOE genotyping of AIBL samples was performed previously [29]. Briefly, QIAmp DNA blood Maxi Kits (Qiagen, Hilden Germany) were used as per manufacturer’s instructions to extract genomic DNA from whole blood. APOE genotype was determined from two separate TaqMan® (Thermo Fisher Scientific, Waltham, MA) genotyping assays for the single nucleotide polymoprhisms rs7412 (assay ID: C____904973_10) and rs429358 (assay ID: C___3084793_20). TaqMan® genotyping assays were performed on a QuantStudio 12 K Flextrademark Real-Time-PCR systems (Thermo Fisher Scientific, Waltham, MA) using the TaqMan® GTXpresstrademark Master Mix (Thermo Fisher Scientific, Waltham, MA) methodology as per manufacturer instructions. APOE carrier status was defined by the presence (1 or 2 copies; ɛ4 +) or absence (0 copies; ɛ4–) of the APOE ɛ4 allele.
Brain imaging
Data were available at the 36-month collection time point for a total of 70 AIBL participants (60 CN, 6 MCI, 4 AD) who underwent Aβ-amyloid imaging with positron emission tomography using either 11C-Pittsburgh Compound B (PiB), 18F-florebetapir or 18F-Flutemetamol as described elsewhere [30–32]. PET standardized uptake value ratios (SUVR) were determined for all tracers using CapAIBL, a web based freely available MR-less methodology [33].
Briefly, SUVs were summed and normalized to either the cerebellar cortex SUV (PiB), whole cere-bellum SUV (florbetapir, FBP), or pons SUV (flute-metamol, FLUTE) to yield the target-region to reference-region SUVR. To allow for the analysis of tracer specific SUVRs as a single continuous variable, a linear regression transformation, termed the “Before the Centiloid Kernel Transformation” (BeCKeT) scale, was applied to FBP and FLUTE SUVR to generate PiB-like SUVR units [34].
Brain volume estimates were available for 62 (54 CN, 5 MCI, 3 AD) AIBL participants at the 36-month collection time point. Grey matter, white matter, ventricular, and hippocampal volumes, were determined through MRI, parameters of which have been previously described [33]. Briefly, participants underwent T1 weighted MRI using CurAIBL [33]. Ventricular volume was calculated as the summed volume of the third and lateral ventricles, and hippocampal volume as the summed volume of grey matter and cerebrospinal fluid. All volumes were corrected for age in years, intracranial volume, and scanner [34].
Statistics
Data obtained from postmortem brain samples were normally distributed (as assessed by Shapiro-Wilk test). A two-way ANOVA with Sidaks post-hoc test was used to compare between groups and brain regions (frontal cortex and hippocampus). All data analysis and graphs for brain analysis were generated using the Graph Pad Prism 8 software (Graph Pad Software, CA).
All statistical analyses for AIBL participant samples were performed using Rstudio (Rstudio Team 2015) Version 1.1.456 for Macintosh. Means, standard deviations and percentages for demographic measures are given for AIBL participants. ANOVA (age, premorbid IQ, depressive symptoms) and chi-squared tests (gender, years of education, APOE ɛ4 + ve, high Aβ burden) were used to determine the significance of differences between AD, MCI, and CN participants. Two-sided partial Pearson correlations were performed to investigate associations between presenilin transcript quantities and measures of brain volume/amyloid burden using the “ppcor” package in R, covarying for age, APOE ɛ4 carrier status, and clinical classification. Additionally, ANOVA, with Bonferroni correction, were used to determine the significance of differences between clinical classifications in terms of presenilin transcript quantities. Finally, a two-sided Pearson correlation was performed to investigate the relationship between the presenilin transcript quantities.
RESULTS
Increased PS2V transcript in brain from dementia cases
Digital PCR was performed to assess copy numbers (per 50 ng of cDNA) of full length PSEN2 and truncated PS2V transcripts (Fig. 1) present in frontal cortex and hippocampus from control, AD, FTD, and LBD cases (Fig. 2, see Table 1 for demographics). Two-way ANOVA revealed a significant difference in full length PSEN2 transcript copy number between groups [F (3, 32) = 13.03; p < 0.0001] but not between regions [F (1, 32) = 0.1310, p = 0.7198]. Post-hoc analysis revealed that compared to control, full length PSEN2 transcript was significantly reduced in frontal cortex of all dementia cases (Fig. 2A). In the hippocampus, no significant changes were observed in either AD or LBD cases compared to controls, whereas a significant reduction was observed in FTD (Fig. 2A).
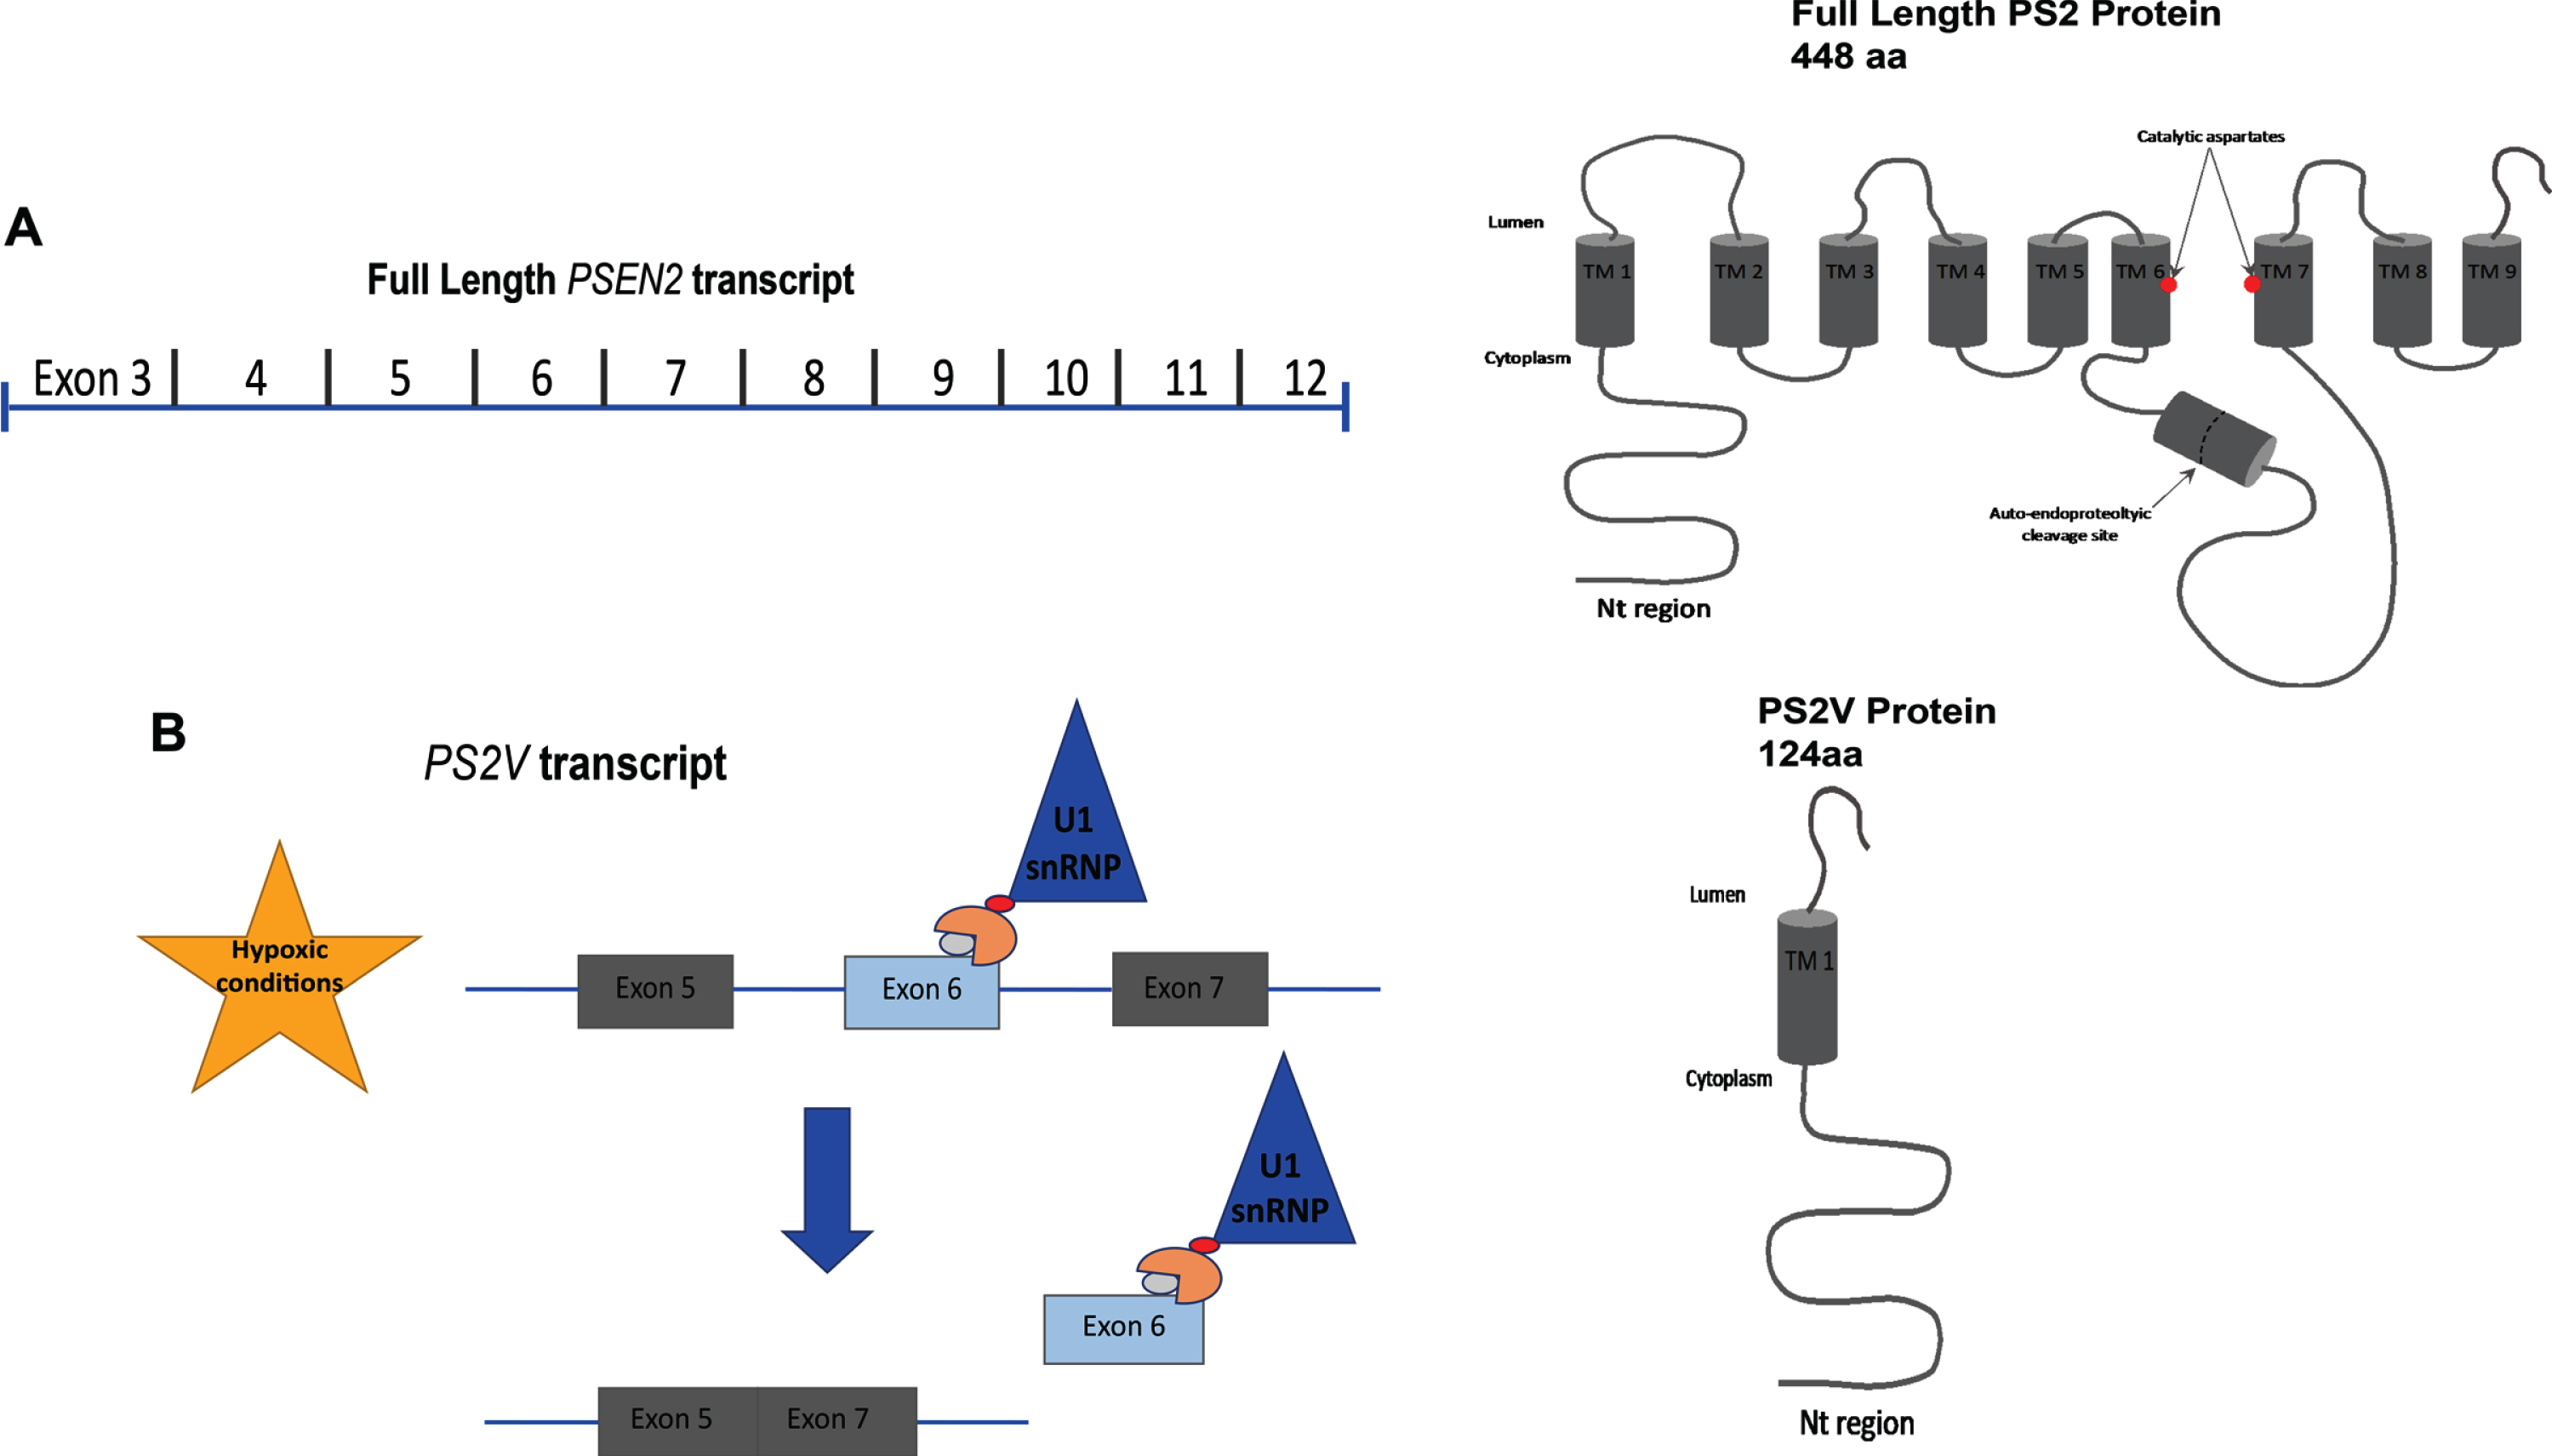
Formation of the PSEN2 truncated variant, PS2V. A schematic representing (A) full length PSEN2 and the relevant exons encoding the protein; (B) induction of truncated PSEN2 (PS2V) under hypoxic conditions where HMGA1a binds to a specific region in the 3’ of exon 6 blocking the binding site of splicing factors, leading to the ligation of exon 5 and 7 thus introducing a frameshift and premature stop codon leading to a predicted translation of truncated PS2 ending in SSMAG.
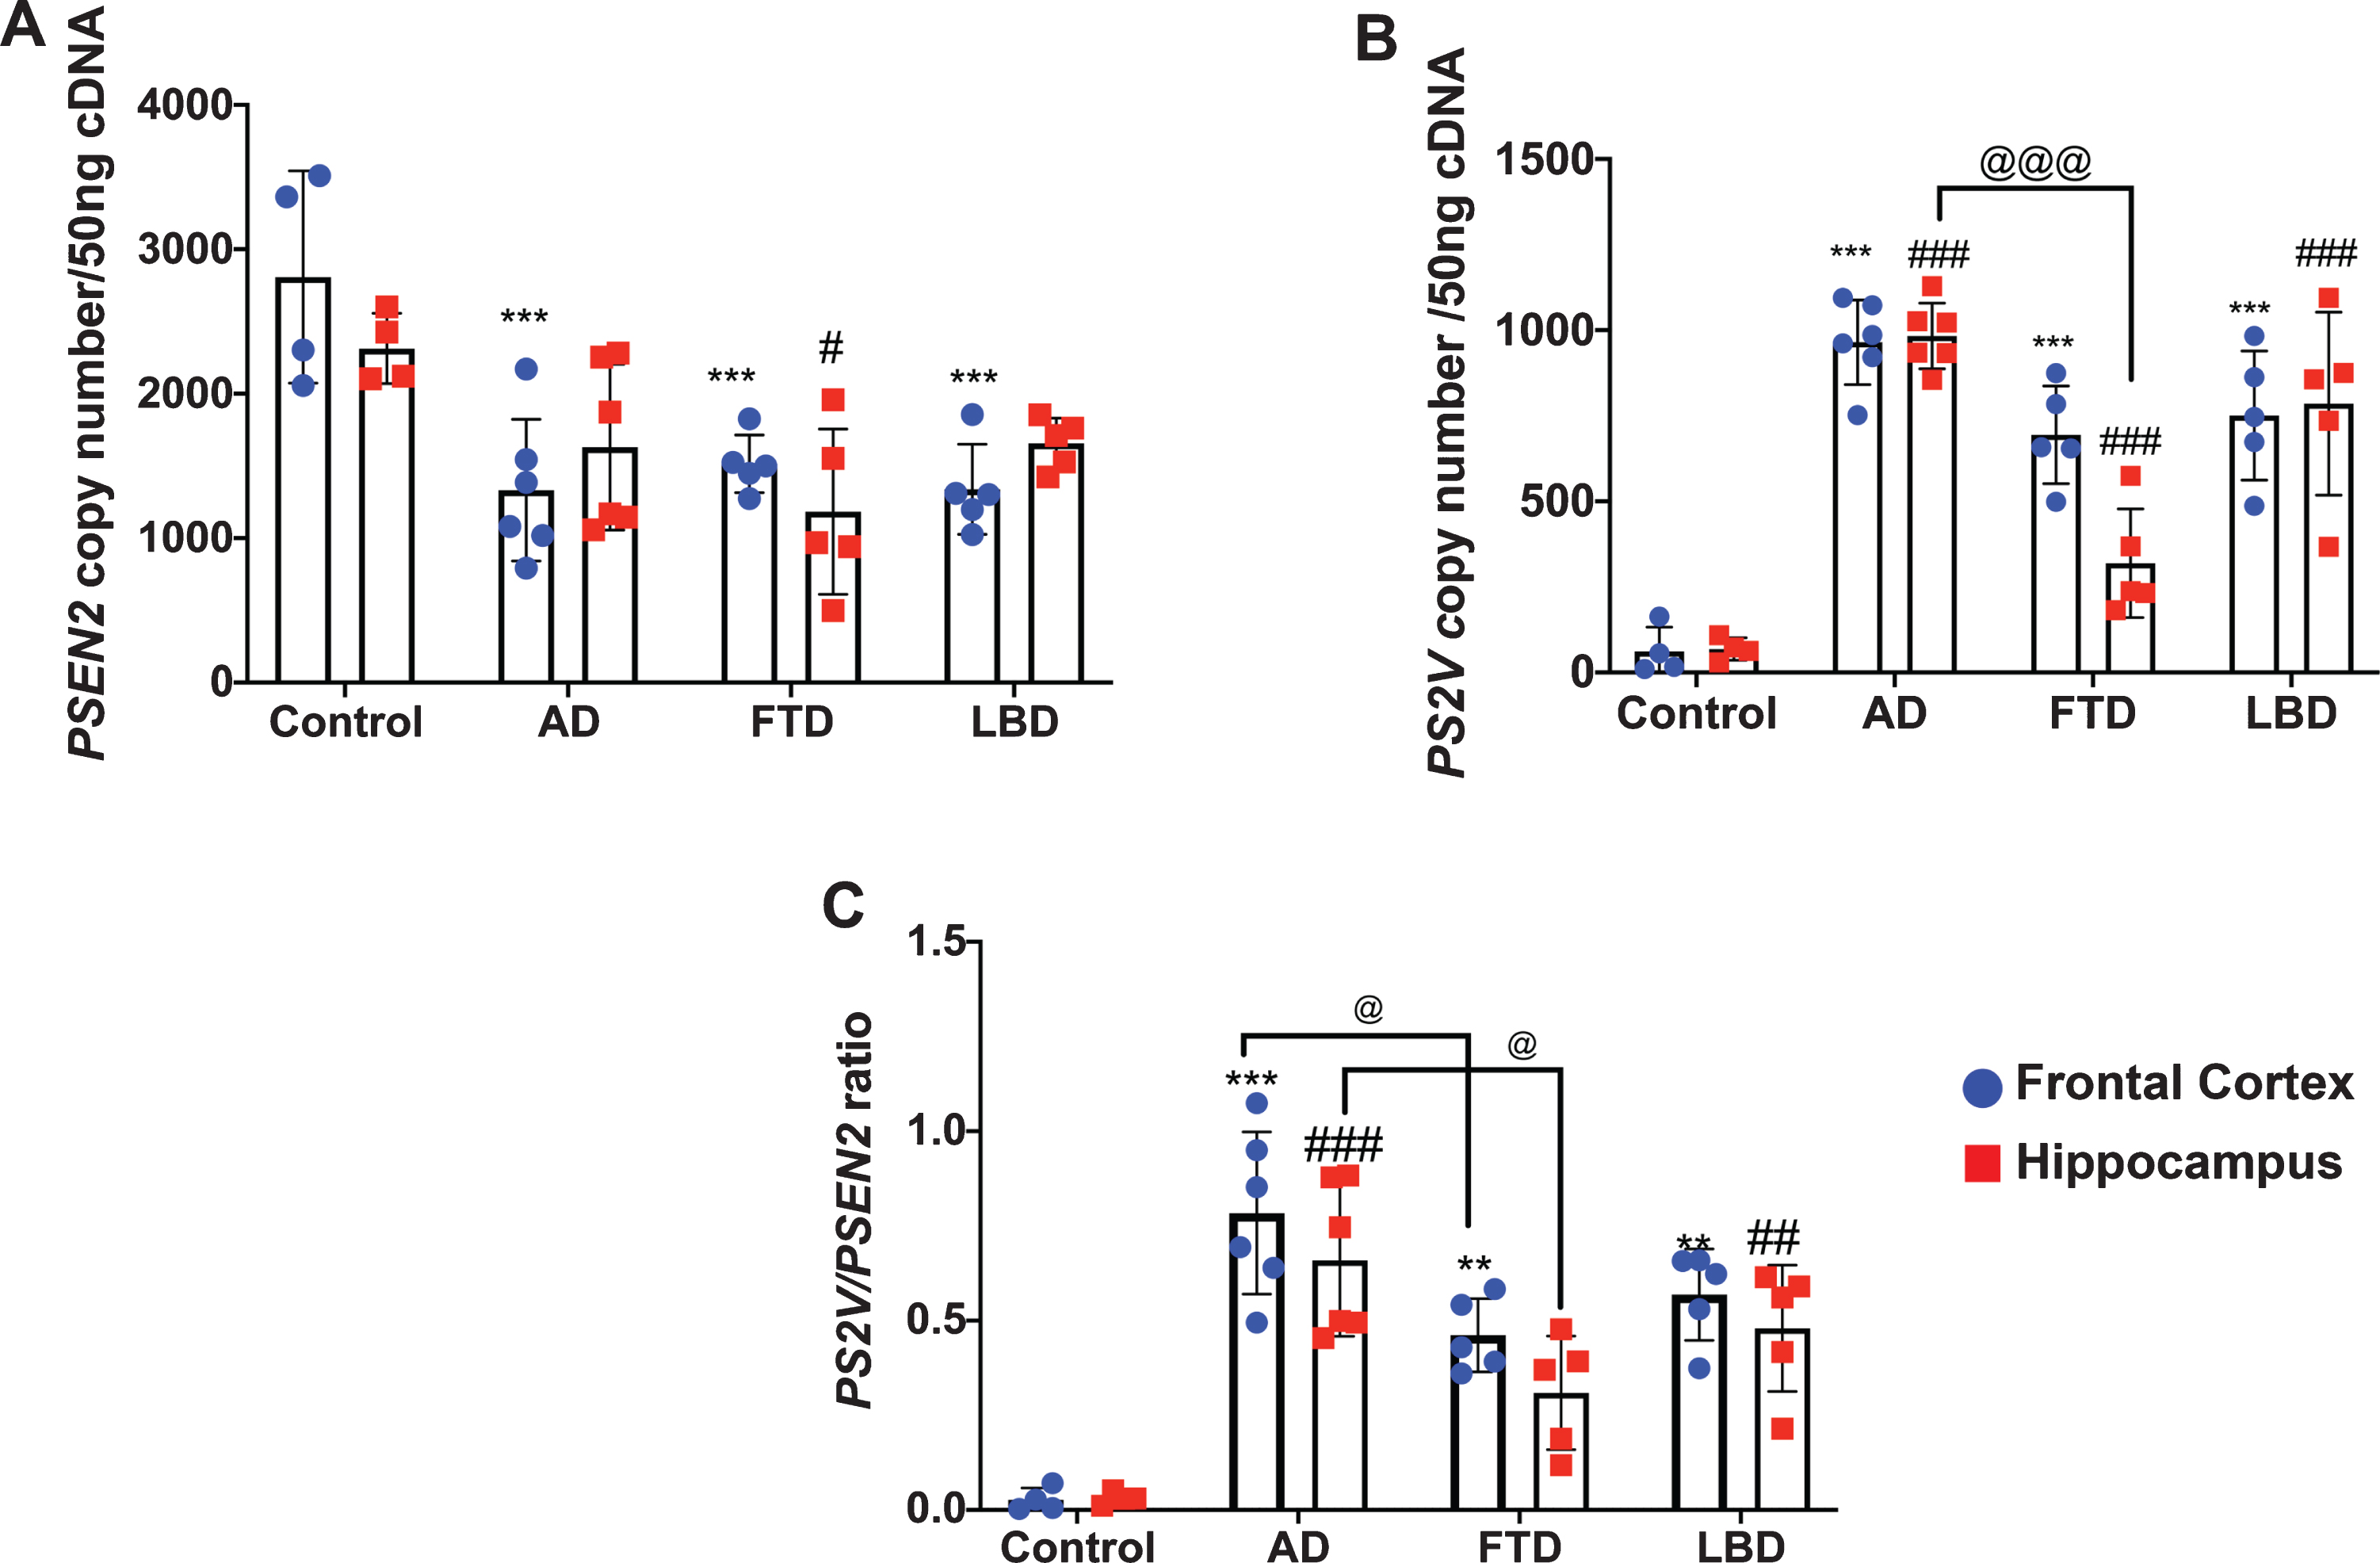
PSEN2 and PS2V transcript levels and PS2V/PSEN2 ratio in frontal cortex and hippocampus from control and neurodegenerative diseases brain tissues. Transcript expression was quantitated by Digital PCR. A, B) Values obtained from frontal cortex (blue dots) and hippocampus (red squares) are represented as copy number per 50 ng cDNA. C) Ratio of PS2V to PSEN2 full length (PSEN2) was also calculated. Compared to control (n = 4), PSEN2 levels were decreased and PS2V levels and ratio increased in both frontal cortex and hippocampus from AD (n = 6), FTD (n = 5), and LBD (n = 5). PS2V levels and ratio were reduced in FTD compared to AD brain. Data is presented as mean+/- SD. Significance was determined by Two-way ANOVA. ***, **Values significantly decreased (PSEN2) or increased (PS2V, ratio) in frontal cortex compared to control (p < 0.001, p < 0.01). ###,##Values significantly decreased (PSEN2) or increased (PS2V, ratio) in hippocampus compared to control (p < 0.001, p < 0.01). @ @ @ , @Values significantly decreased from AD frontal cortex or hippocampus (p < 0.001, p < 0.05).
Very low PS2V transcript copy numbers were detected in the frontal cortex or hippocampus in control samples (∼2-3% of PSEN2 transcript). As shown in Fig. 2B and C, a 10–20-fold increase in PS2V copy number was observed in samples from AD, FTD, and LBD compared to control. Two-way ANOVA revealed a significant change in full length PSEN2 transcript copy number and in the ratio of PS2V/PSEN2 between groups [F (3, 32) = 61.31; p < 0.0001 and F(3, 32) = 32.00; p < 0.0001), respectively], but not between regions [F (1, 32) = 2.583, p = 0.1178 and F(1, 32) = 1.860, p = 0.1821, respectively]. Post-hoc analysis revealed that, compared to control, PS2V transcript levels were significantly increased in both frontal cortex and hippocampus from all dementia cases (Fig. 2B). Compared to AD samples, PS2V transcript levels were reduced in the hippocampus of FTD samples. Similar findings were observed when data was expressed as a ratio of PS2V/PSEN2 transcript, with the exception that a significantly reduced ratio was observed for both frontal cortex and hippocampus (Fig. 2C).
Increased PS2V/PSEN2 transcript ratio is associated with reductions in hippocampal volume
PSEN2 and PS2V transcript copy numbers were assessed by digital PCR on RNA harvested from lymphocytes collected from the Perth subset of the AIBL cohort. Demographics and brain imaging data are shown in Table 2. The PSEN2 and PS2V transcript copy numbers and PS2V/PSEN2 ratio are shown in Fig. 3A-C. For PSEN2 transcript, one-way ANOVA revealed significant differences between groups [F (2, 157) = 4.216, p = 0.01646]. Post-hoc analysis revealed a strong trend (p = 0.055) toward a decrease in the AD group, compared to the CN group. Group differences were also observed in PS2V copy number [F (2, 157) = 5.313, p = 0.0059], when compared to CN group, a trend towards an increase was observed in the MCI group (p = 0.08) and a significant increase observed in the AD group (p = 0.03). Significant increases in the PS2V/PSEN2 ratio were observed in MCI and AD groups compared to the CN group. No significant changes were observed when comparing the MCI to the AD group. Collectively, these results indicate that increases in PS2V are evident in the early stages of cognitive impairment in this cohort, but no further increase was observed in AD.
Demographics of the AIBL cohort
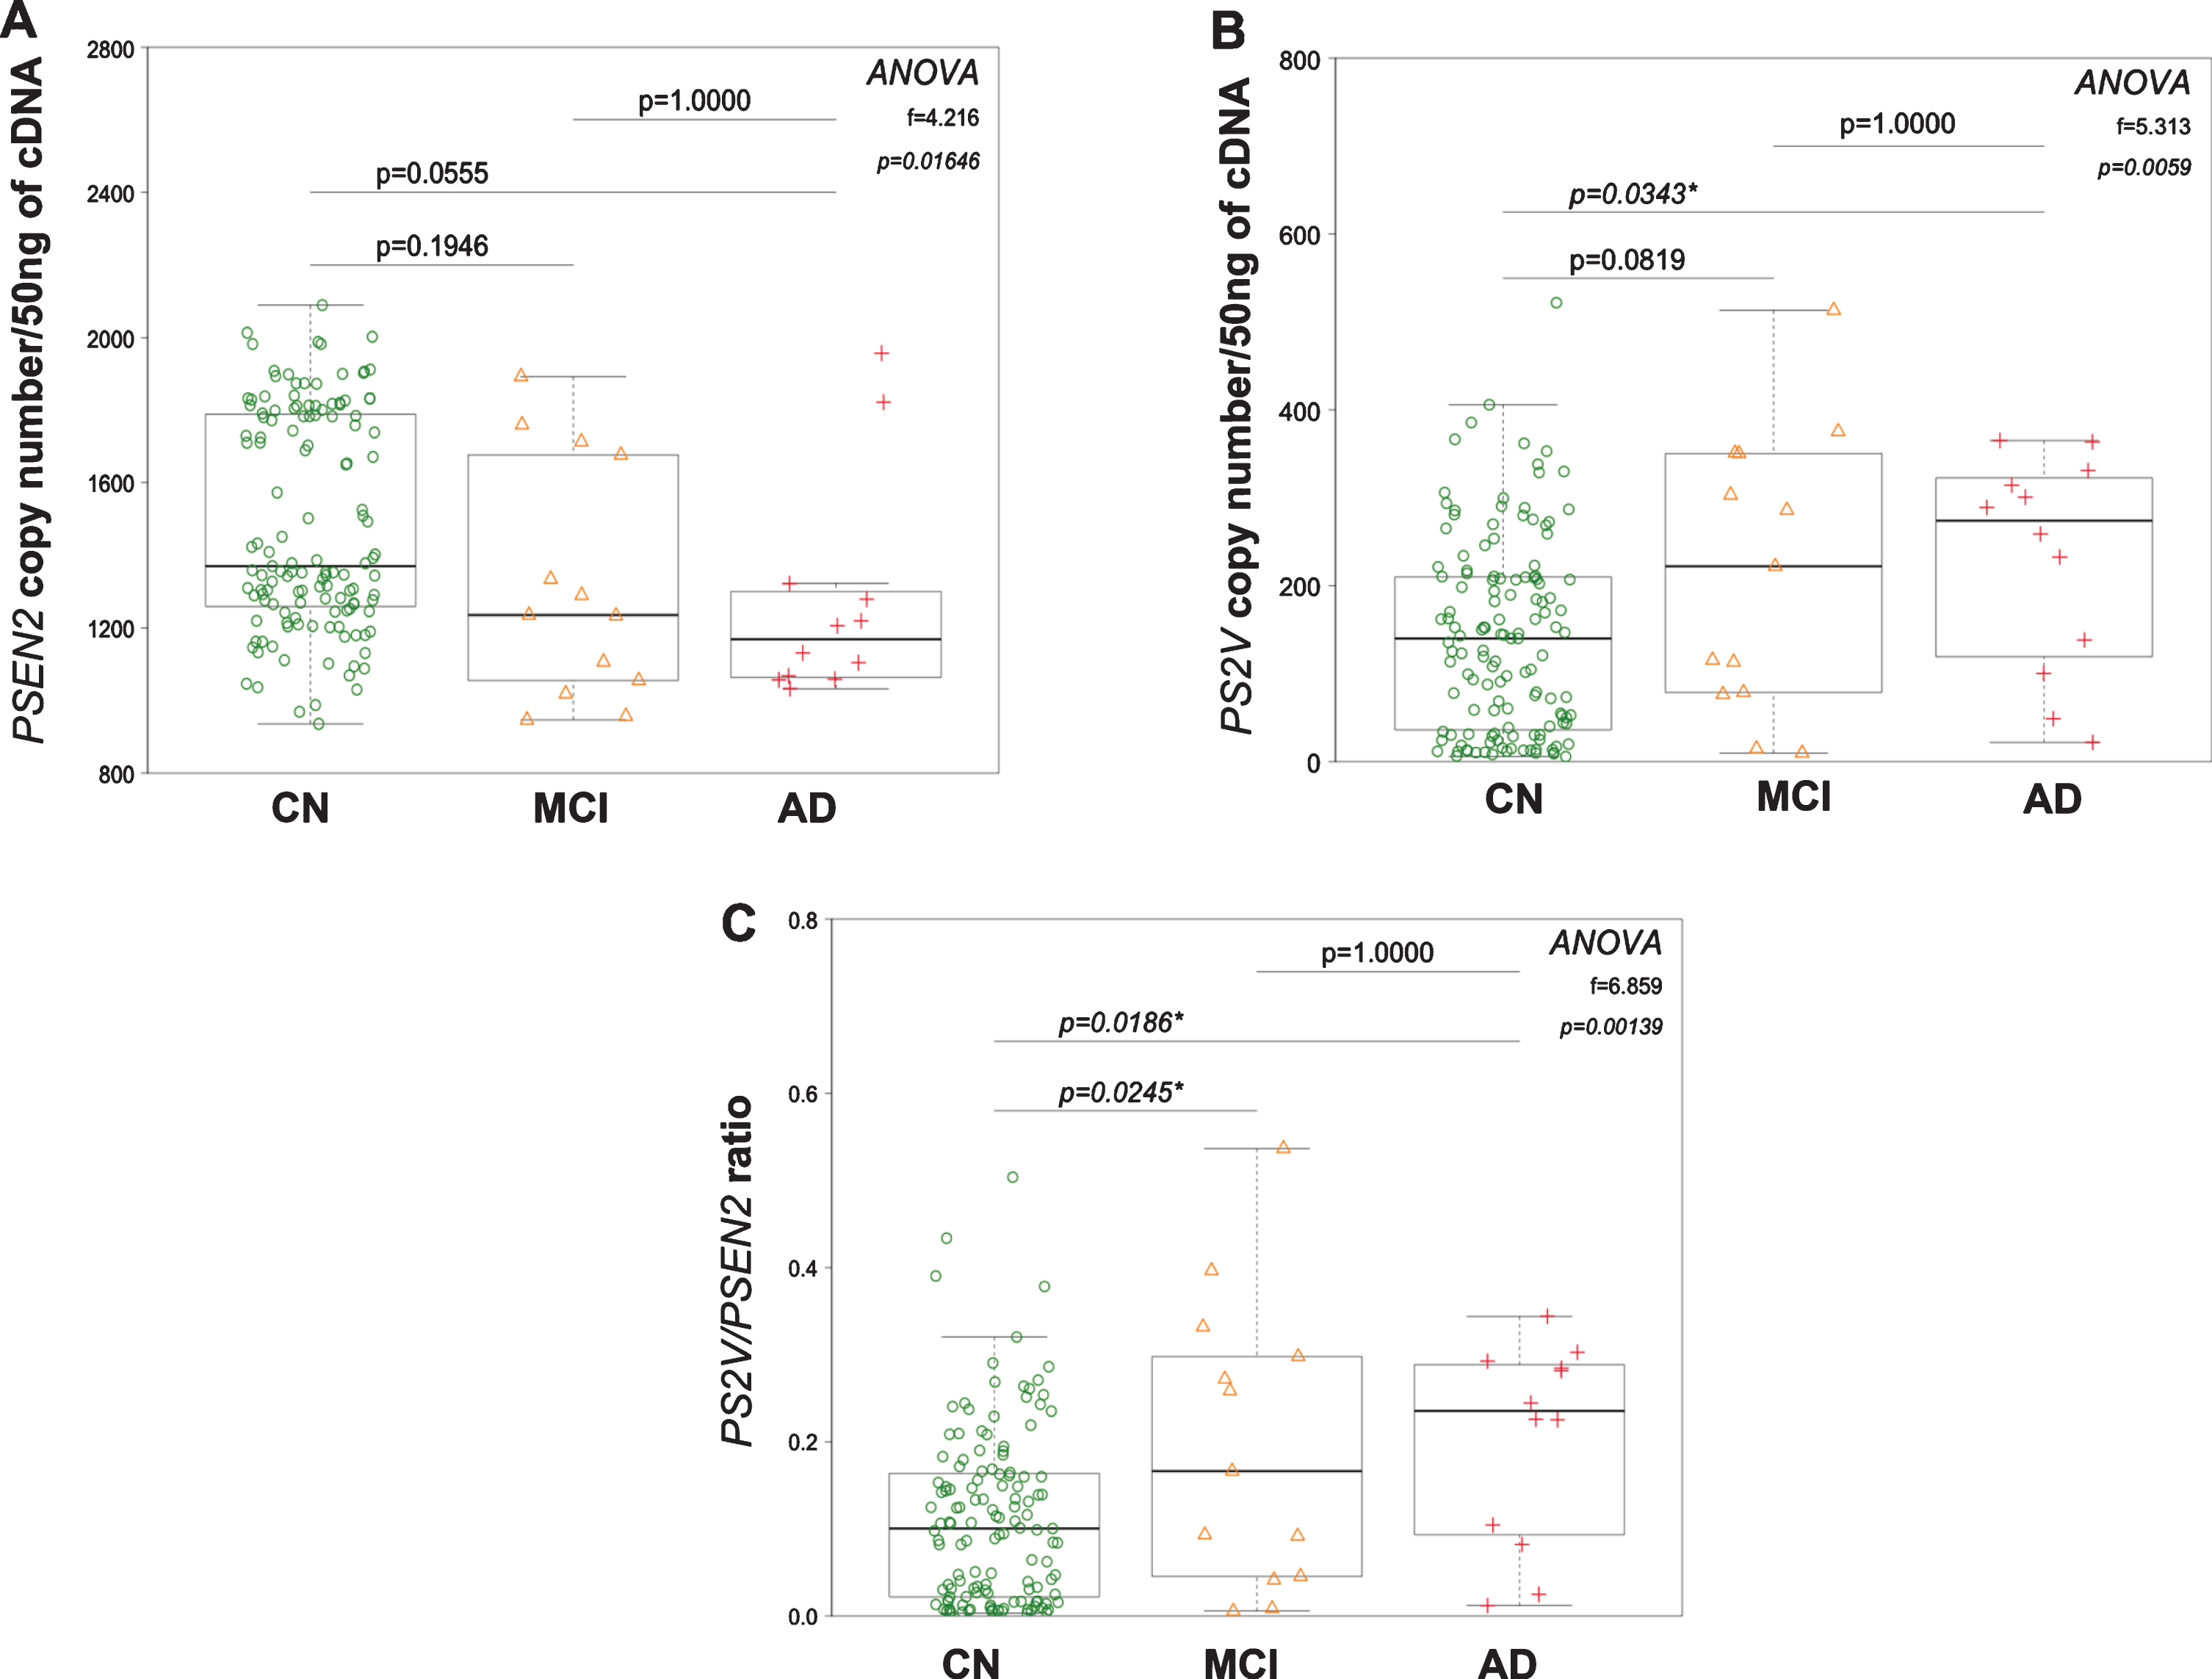
PSEN2, PS2V transcript levels, and PSEN2/PS2V ratio in lymphocytes harvested from cognitively normal, MCI, and AD participants. Transcript expression was quantified by Digital PCR and is represented as whisker box plots. A decreasing trend in PSEN2 transcript levels (A) and an increasing trend in PS2V and ratio (B, C) were observed in the MCI [orange triangles] and AD group [red crosses] compared to the cognitively normal group [open green circle], becoming significant in the AD group.
It was noted in the data (particular with respect to PSEN2 transcript copy number) that the distribution of values appeared to be bimodal, i.e., there were distinct groups of high and low values. To explore this finding further, a correlation analysis between PSEN2 and PS2V copy number was performed. A significant negative correlation was observed (Fig. 4). Interestingly, there appeared to be two distinct subsets. A cut off of 100 PS2V copies/50 ng cDNA and 1550 PSEN2 copies/50 ng cDNA was determined to define high PS2V, low PSEN2 (Group 1) and low PS2V, high PSEN2 (Group 2). The majority of this cohort was in group 1, where 60% of CN, 83% of AD, and 70% of MCI were associated with high PS2V and low PSEN2 levels. Further, the ratio displayed 88.33% (95% CI 51.59, 97.91) sensitivity and 41.79% (95% 33.33, 97.91) specificity for AD and a positive likelihood ratio 1.43 (95% CI 1.07, 1.91) and a negative likelihood ratio (0.40 (95% CI 0.11, 1.44). Although, these findings indicate that PS2V/PSEN2 ratio was unable to differentiate between CN and AD, it suggests that the high PS2V levels are driving the difference seen between CN, MCI, and AD.

Negative correlation between PSEN2 and PS2V transcript levels in cognitively normal, MCI, and AD participants. Transcript expression of PSEN2 and PS2V was found to be significantly negatively correlated with each other. This was observed in the entire cohort which consisting of cognitively normal [open green circle], MCI [orange triangle], and AD [red crosses] individuals. A cut off of 100 PS2V copies/50 ng cDNA and 1550 PSEN2 copies/50 ng cDNA was determined (dotted lines). Group 1 is defined as≥100 copies of PS2V,≤1550 copies of PSEN2 (“high PS2V, low PSEN2”). Group 2 is defined as≤100 copies of PS2V,≥1550 copies of PSEN2 (“low PS2V, high PSEN2).
Our findings in postmortem brain indicate that PS2V levels are significantly increased in AD, LBD, and FTD frontal cortex and hippocampus, indicating an association with overall neurodegeneration. Therefore, we next determined whether there was an association between peripheral PS2V/PSEN2 with changes in brain volume and amyloid burden. Linear regression analysis was used to compare PSEN2, PS2V transcript copy number or ratio with grey matter, white matter, and ventricle and hippocampal volume, in addition to neocortical amyloid burden (SUVR). The analysis was co-varied for age, APOE ɛ4, and clinical classification. The results (Table 3) show significant associations with hippocampal volume only. A significant positive relationship was observed between PSEN2 copy number and hippocampal volume (β= 0.303, p = 0.02). A strong trend toward an inverse relationship was observed between PS2V copy number and hippocampal volume (β= –0.248, p = 0.058), which was significant following analysis of PS2V/PSEN2 ratio (β= –0.269, p = 0.039).
Partial correlations between PSEN2 and PS2 transcript levels and PS2/PS2V ratio with brain volume estimates, co-varying for age, APOE 4 carrier status, and clinical classification
DISCUSSION
This study evaluated the levels of full length and truncated PSEN2 transcripts in postmortem control and neurodegenerative brain samples and in lymphocytes collected from AIBL participants. Our findings support that the truncated PSEN2 transcript, PS2V, may be a marker of neurodegeneration. In postmortem brain we show an increase in PS2V transcript in frontal cortex and hippocampus of AD brain compared to controls where there was very little observed expression. This is consistent with previous studies that have identified PS2V transcript and protein in AD brain but not (or very little) in control brain [18, 24]. PS2V was also present in in LBD and FTD, although at lower levels than observed in AD brain. Indeed, compared to AD brain, significantly lower levels of PS2V were observed in FTD brain. These findings suggest that PS2V is associated with overall neurodegeneration but the differences in levels may reflect the severity or type of pathology. The distribution of PS2V within the brain and association with different pathologies remains to be fully elucidated. This would require the generation of a specific antibody to the truncated protein. Only one study has shown PS2V immunoreactivity in AD brain revealing staining in close proximity with amyloid plaques but also as inclusion bodies in distal degenerating neurons [18]. These inclusion bodies were not associated with amyloid plaques or neurofibrillary tangles. The presence and distribution of PS2V protein in the brains of non-AD neurodegenerative diseases was not assessed by Sato et al. [18] but considered with our findings suggest that PS2V is associated with overall neurodegeneration, but not necessarily associated with a particular pathological hallmark.
Our findings that increased PS2V/PSEN2 ratio is associated with reductions in hippocampal volume but not neocortical amyloid load in the AIBL cohort, provides further support to suggest that increased PS2V formation may be a marker of overall neurodegeneration. There is a milieu of processes that contribute to neurodegeneration that can either alter PSEN2 levels and/or increase PS2V transcript formation including, hypoxia, oxidative stress, and neuroinflammation [18, 35–37]. For example, inflammatory cytokines have been shown to increase PSEN2, but not PSEN1 transcripts [35] and in addition to hypoxia promoting formation of PS2V, it also increases full length PSEN2 transcript expression as the PSEN2 promoter contains a hypoxia-inducible transcription factor (HIF-1) binding site [24, 37]. With chronic exposures to hypoxia/inflammation, it is conceivable that sustained increases in PSEN2 transcript may promote formation and accumulation of PS2V. Whether this is an early feature/contributor to neurodegeneration remains to be determined and would require longitudinal analysis. Of particular interest would be if the association is observed at follow-up and whether increases in PS2V/PSEN2 ratio (combined with other biomarkers) can predict further declines in hippocampal volume.
We detected and quantitatively measured PSEN2 and PS2V transcripts in lymphocytes, indicating that the PS2V is not exclusively expressed in brain tissue. One other study has observed PSEN2 transcripts (PS2ΔEx3–7, PS2ΔEx4) in lymphocytes [16]; however, the functional relevance of these transcripts remains to be determined. In addition, the lymphocytes in the Takahashi et al. study were cultured and formation of these alternative transcripts was only observed following exposure to pro-oxidants. We show that PS2V is generated endogenously, providing the opportunity to assess it as a potential peripheral marker of neurodegeneration. We show similar findings to those in postmortem brain, where significant increases in PS2V expression were observed in AD compared to controls. However, unlike in the brain where there was very little PS2V present in control samples, the levels of this transcript varied within the cognitively normal controls. Indeed, two distinct groups based on transcript expression levels were evident. Surprisingly, the majority of controls (60%) were within the group designated “high PS2V, low PSEN2” along with the majority of AD (83%) and MCI (73%) cases. Therefore, changes in peripheral PS2V/PSEN2 transcripts on their own are not likely to discriminate between AD, MCI, and control cases. However, a higher PS2V/PSEN2 ratio in combination with other biomarkers may predict at risk of conversion to cognitive impairment, particularly as there is a significant association with reduced hippocampal volume. There is some precedence for this as one study has shown that dihydroxybutanoic acid, generated from the metabolism of glucose to lactate under hypoxic conditions, was the major contributor to predicting conversion of MCI to AD [38]. Similar potential underpinnings to his relationship cannot be assessed in our study due to the lack of relevant markers of oxidative stress/hypoxia. Our findings, however, do warrant additional investigations in this or other relevant cohorts to further explore these associations.
In summary, the findings in this study represent initial evaluations of full length and truncated PSEN2 transcripts both in brain and the periphery. Despite the small sample sizes, this study has not only revealed changes in AD brain consistent with previous studies, but also provided additional evidence that formation of these transcripts is promoted in other neurodegenerative diseases. The identification and measurement of the PSEN2 and PS2V transcripts in lymphocytes is particularly relevant, as this provides an opportunity to assess the relevance of these transcripts as biomarkers of neurodegeneration. It would be important to further validate their relevance in a larger cohort size and investigate associations with other biomarkers of neurodegeneration (e.g., neurofilament light polypeptide levels) in both cross-sectional and longitudinal analyses.
Footnotes
ACKNOWLEDGMENTS
This work was supported by grant funding from the National Health and Medical Research Council (NHMRC), (GNT1045507) awarded to G.V. and M.L. Funding for the AIBL study was provided in part by the study partners [Commonwealth Scientific Industrial and research Organisation (CSIRO), Edith Cowan University (ECU), Mental Health Research Institute (MHRI), support from the NHMRC and the Dementia Collaborative Research Centres program (DCRC2), as well as funding from the Science and Industry Endowment fund (SIEF) and the Cooperative Research Centre (CRC) for Mental Health- funded through the CRC program (Grant ID:20100104) an Australian Initiative. We thank all the investigators within the AIBL who contributed to the design and implantation of the resource and/or provided data but did not participate in the analysis or writing of this report. A complete list of AIBL investigators can be found at ![]() . We thank all the participants that took part in the AIBL study, for their commitment and dedication to helping advance research into early detection and causation of AD.
. We thank all the participants that took part in the AIBL study, for their commitment and dedication to helping advance research into early detection and causation of AD.