
Abstract
We compared ‘CIScore’ determined by quantitative single photon emission computed tomography studies of the cingulate island sign to cerebrospinal fluid (CSF) biomarkers in Lewy body disease (LBD) and Alzheimer’s disease (AD) to assess its usefulness and pathological background. Among the 16 each age-matched LBD and AD patients, the CIScore differed significantly but was not correlated with CSF biomarkers. In LBD, hippocampal atrophy significantly correlated with Clinical Dementia Rating and CSF p-tau and t-tau levels. Our results showed CIS was not related to CSF biomarkers in LBD and high CSF tau levels were related to clinical disease severity and hippocampal atrophy.
Keywords
INTRODUCTION
Dementia with Lewy bodies (DLB) differs from Alzheimer’s disease (AD) in that brain metabolism is decreased in the temporoparietal-occipital region compared to the posterior cingulate cortex in AD [1]. For this assessment, single photon emission computed tomography (SPECT) studies are more common and economic than positron emission tomography (PET) studies. Cerebral blood flow in the posterior cingulate cortex is an established biomarker for mild cognitive impairment (MCI) and has been applied to the early detection of AD [2]. In DLB, the cingulate island sign (CIS) was added as a supportive biomarker to the revised DLB consensus criteria in 2017 [3]. The CIS shows relatively preserved metabolism or cerebral blood flow in the posterior cingulate cortex compared to the temporoparietal-occipital region in DLB. Furthermore, quantitative CIS SPECT studies are now well established and may be useful for distinguishing DLB from AD in the early stages of disease [4]. The “CIScore” values represent the ratio of total positive Z-score values to the volumes of interest (VOIs) in the posterior and posterior cingulate cortex regions. The posterior region (PR) features DLB-specific VOIs derived from comparisons of the temporoparietal-occipital regions of patients with DLB to healthy controls, whereas the posterior cingulate cortical region (PCC) features AD-specific VOIs derived from comparisons of patients with AD to healthy controls. Nevertheless, the use of CIS in SPECT studies has been variable and its relationship to cerebrospinal fluid (CSF) and pathological biomarkers is unknown. CIS is significantly correlated with fewer neurofibrillary tangles in DLB [5]. However, a previous study based on postmortem brain neuropathology found no correlation between CIS and pathology of the posterior cingulate cortex between DLB and AD [6]. CSF biomarkers reflect the pathology of AD in the pre-clinical stage, thus allowing early diagnosis before symptom onset [7]. In 1998, a consensus report was published by the Working Group on Molecular and Biochemical Markers of Alzheimer’s Disease proposed the requirements for an ideal diagnostic biomarker for AD [8] in which biomarkers should generally be able to detect a fundamental feature of AD pathology. We retrospectively compared the CIScore to CSF biomarkers for DLB and AD to reveal its potential usefulness and pathological background. We also compared Parkinson’s disease (PD) as a Lewy body disease (LBD).
METHODS
Participants
This study was approved by the Ethics Committee of Showa University Hospital (clinical trial identifier number: 1997 and 2591) and conducted according to the principles of the Declaration of Helsinki. All participants and their proxies provided written informed consent before participation, with the possibility of later opting out.
The sample size was determined according to the effect sizes in previous studies related to neuropathology and nuclear medical scanning [6]. Among neurology patients at Showa University Hospital, this retrospective study identified nine with clinically diagnosed DLB, 32 with PD, and 31 with AD. We excluded patients with organic brain diseases such as cerebral infarction or cerebral contusion and revised the diagnosis criteria of each disease. Standardized neuropathological assessments were made according to internationally accepted criteria [3 , 10]. We included AD based on the National Institute on Aging-Alzheimer’s Association criteria with high likelihood. Seven DLB patients also fulfilled the criteria for high AD neuropathological changes in the CSF and were classified as mixed AD/DLB with LBD clinical phenotype [11, 12]. No PD participant had AD pathological changes in the CSF. We included nine patients with DLB and seven with PD (n = 16, average age 76.8 years) age-matched to those with AD (n = 16, average age 78.4 years). All participants were classified by the Clinical Dementia Rating (CDR) [13]. Cognitive function was assessed using the Japanese version of the Mini-Mental State Examination (MMSE-J) [14, 15]. All participants performed brain magnetic resonance imaging (MRI), 99mTc-ethyl cysteinate dimer (ECD)-SPECT, and CSF analysis. We also compared patient disease durations based on the reports of initial dementia appearance by the family and/or the patient (Table 1).
Demographic data according to disease groups
CDR, Clinical Dementia Rating; MMSE-J, Japanese version of the Mini-Mental State Examination; VRS-MTA, Visual rating of medial temporal atrophy; CSF, cerebrospinal fluid; SPECT, single photon emission computed tomography. * p < 0.05 based on Wilcoxon signed-rank tests.
MRI data acquisition
Structural MRI scans were conducted using a 1.5T MR scanner (Magnetom Essenza, Siemens, Germany). High-resolution, T1-weighted images of the whole brain (144 sagittal slices, 1.0×1.0×1.25 mm) were acquired from all participants using a gradient echo sequence: repetition time = 1600 ms, echo time = 4.7 ms, flip angle = 15°, field of view = 256×256. We assessed hippocampal atrophy by visual rating of medial temporal atrophy (VRS-MTA), a semi-quantitative assessment of atrophy of the hippocampus and entorhinal cortex according to a visual rating scale where 0 = no atrophy, 1 = minimal atrophy, 2 = mild atrophy, 3 = moderate atrophy, and 4 = severe atrophy [16].
SPECT data acquisition
SPECT was performed with patients lying in the supine position. Images were acquired using a triple-detector gamma camera system (GCA-9300R; CANON MEDICAL SYSTEMS, Tokyo, Japan) after bolus administration of 600 MBq of technetium-99 m ECD. Non-invasive measurement of global cerebral blood flow was performed using a Patlak plot (Discovery NM630; GE Healthcare, Tokyo, Japan) [17].
SPECT data analysis
Z-score maps of the SPECT images were defined using an easy Z-score imaging system (eZIS) (FUJIFILM Toyama Chemical Co., Ltd., Tokyo, Japan). These included spatial normalization parameters in Statistical Parametric Mapping 2 (SPM2), specific volume of interest analysis, and “CIScore” [2, 4].
CSF analysis
CSF concentrations of Aβ40 and Aβ42 were analyzed using V-PLEX Aβ Peptide Panel 1 (6E10) (Meso Scale Discovery, Rockville, MD) on a MESO QuickPlex SQ 120 system (Meso Scale Diagnostics, LLC, Rockville, MD, USA). CSF concentrations of total tau (t-tau) and tau phosphorylated at threonine 181 (p-tau) were measured using the commercially available enzyme-linked immunosorbent assay kits, INNOTEST hTAU Ag and PHOSPHO-TAU (181P) (Fujirebio Europe, Inc., Ghent, Belgium) according to the manufacturer’s instructions. The intra- and inter-assay coefficients of variation were less than 20% for all assays. The laboratory at Niigata University participates in the Alzheimer’s Association’s external quality control program for CSF biomarkers.
Statistical analysis
Demographic comparisons across the three study groups were analyzed by analysis of variance followed by Bonferroni tests for multiple comparisons in R software (ver. 3.5.0). Comparative analyses between the two groups were performed using Wilcoxon signed-rank tests. The correlation coefficients between values were calculated using Spearman’s rank correlation coefficients. P values less than 0.05 were considered statistically significant.
RESULTS
Comparisons of participant sex/age, CDR, MMSE-J, VRS-MTA, and disease duration for CSF analysis and SPECT studies between the groups revealed no differences in demographic data between LBD (DLB and PD) and AD (Table 1).
Figure 1 shows the results of comparisons of SPECT and CSF biomarkers between the groups. The CIScore was significantly higher for AD than for LBD (p < 0.05). LBD showed lower cerebral blood flow in the PR and higher flow in the PCC but the differences were not significant between AD and LBD (p = 0.05; p = 0.06). Among CSF biomarkers Aβ42 /Aβ40 (p < 0.01) and p-Tau differed significantly between groups (p < 0.01) (Fig. 1). Comparisons between AD, DLB, and PD, showed a significantly lower CIS for DLB and PD (DLB versus AD p < 0.05; PD versus AD p < 0.01). Furthermore, the differences were insignificant between groups (F = 3.37, p < 0.05; DLB versus AD p = 0.14; PD versus AD p = 0.11, PD versus DLB p = 0.97).
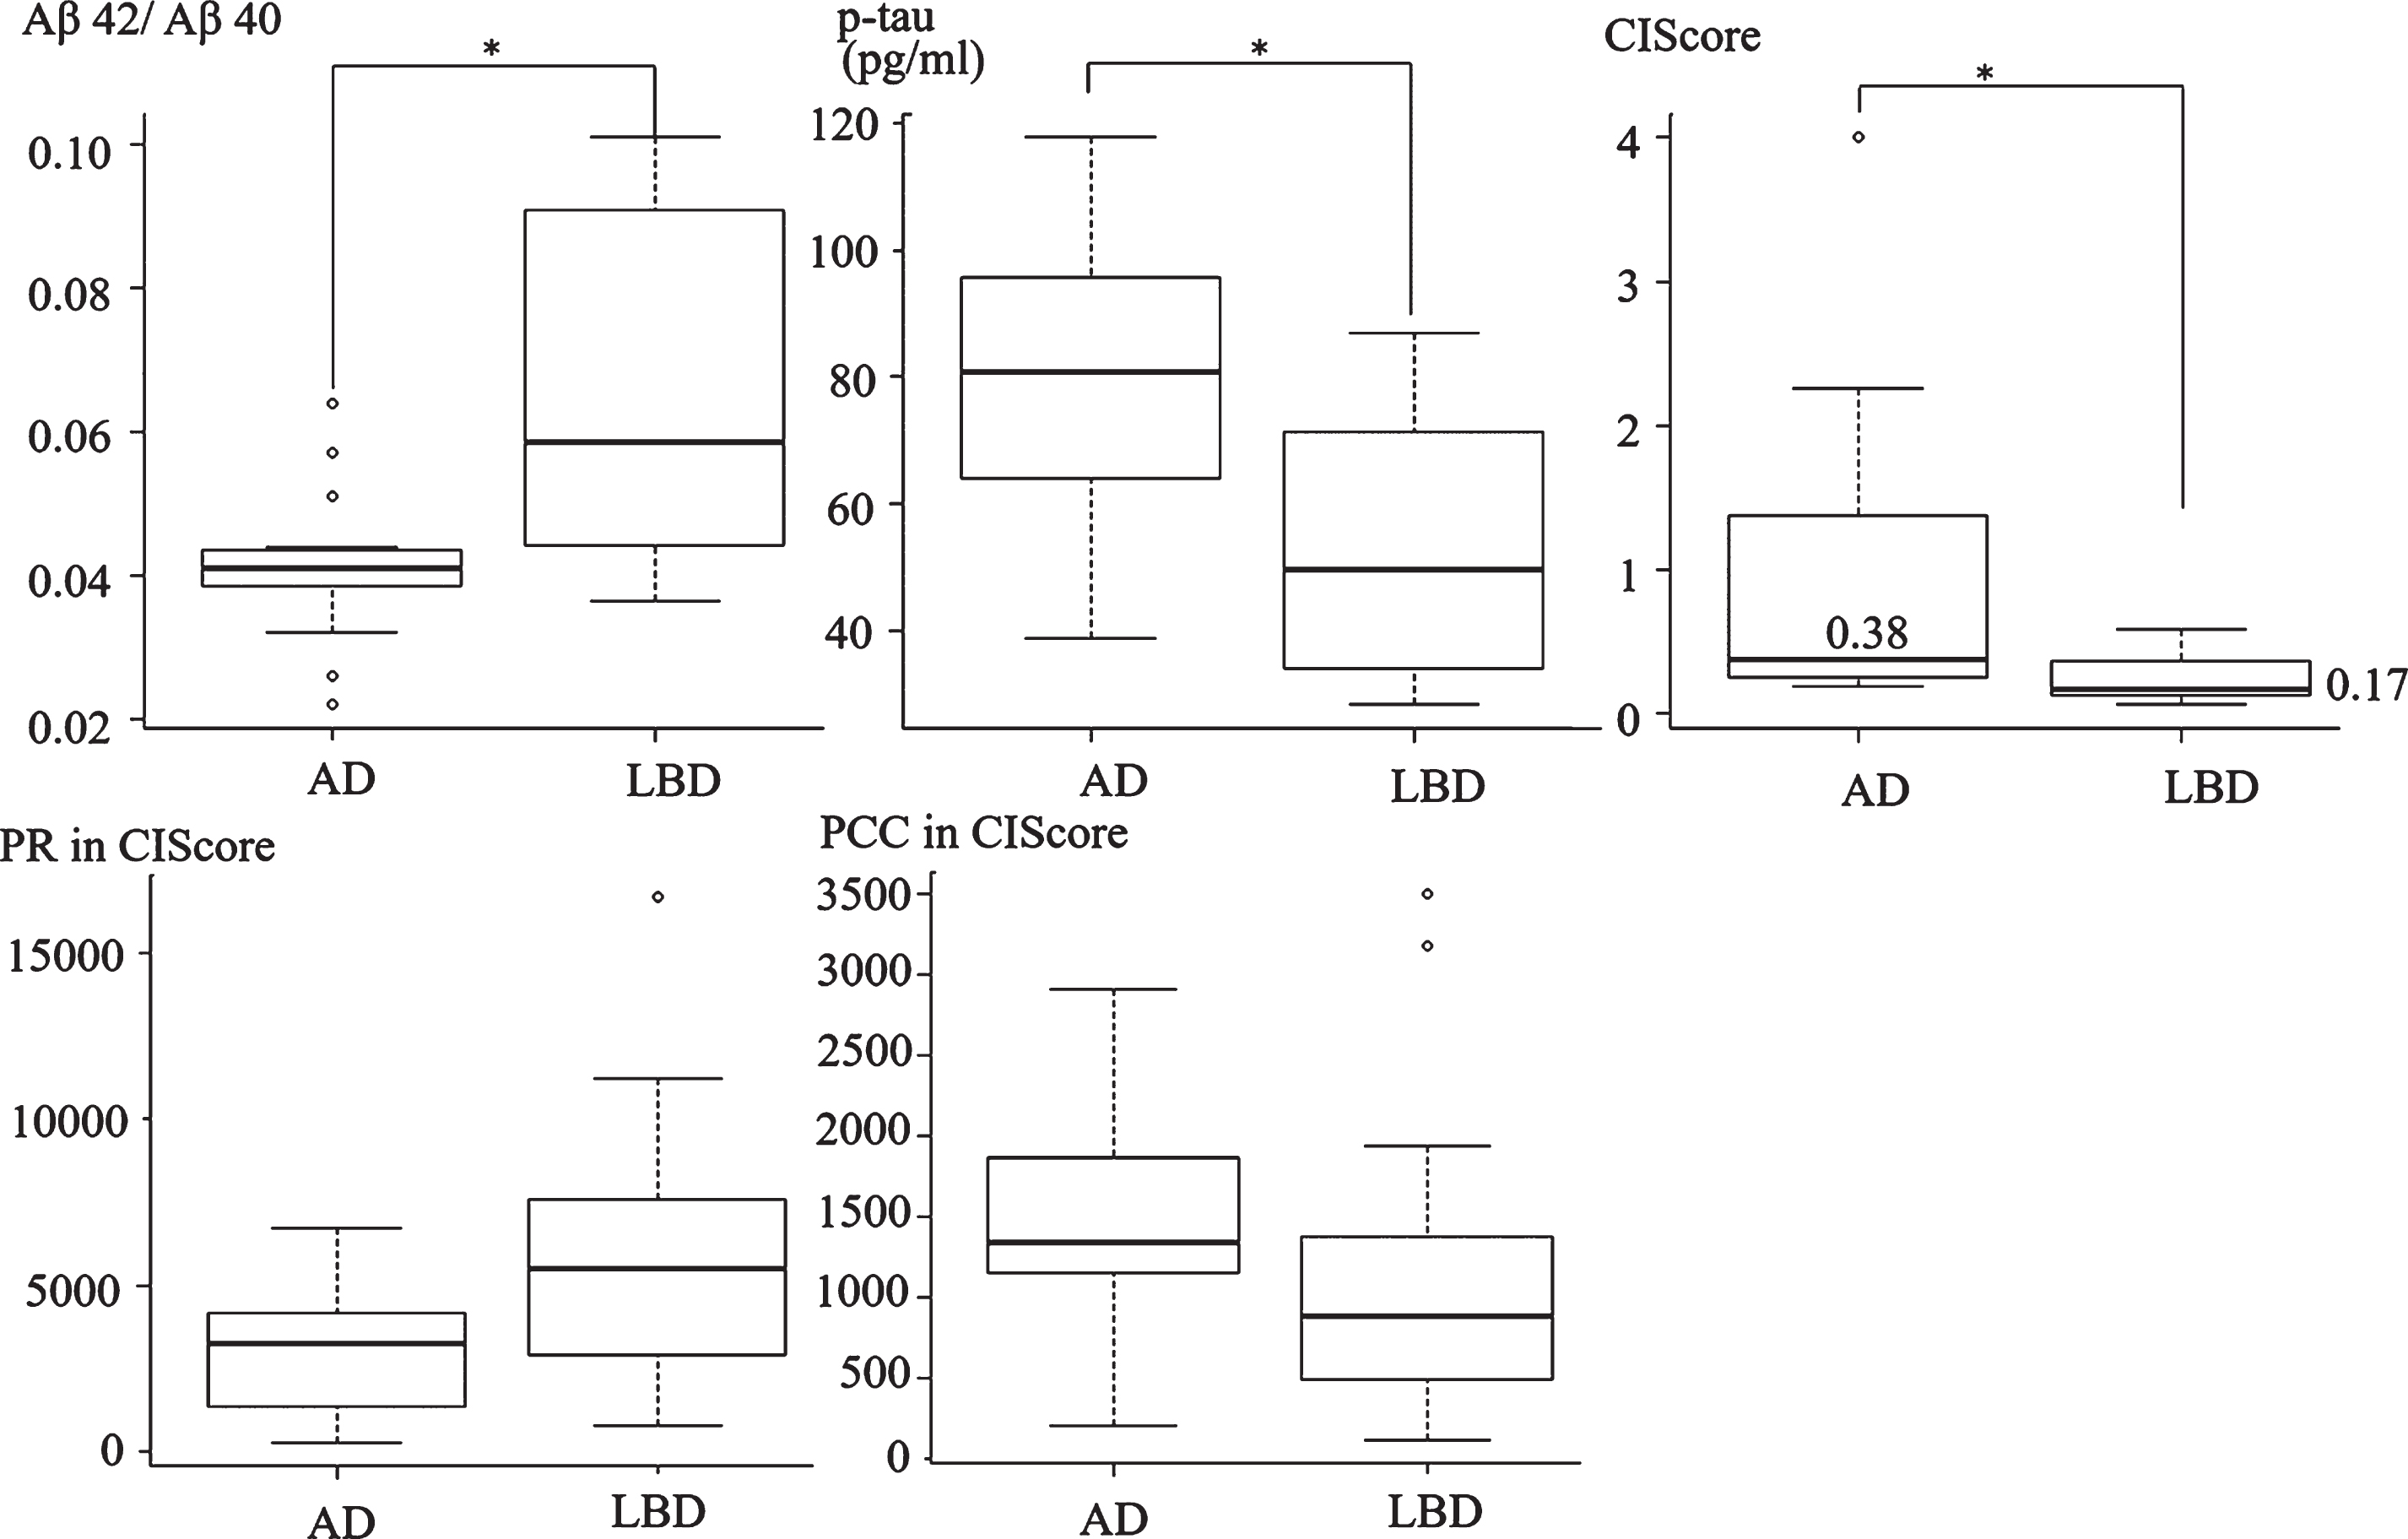
Comparison of CIScore and CSF biomarkers. Aβ42/Aβ40, p-tau, and CIScore differed significantly between AD and LBD (DLB & PD). The mean CIScores were 0.38 in AD and 0.17 in LBD (p < 0.05, Wilcoxon signed-rank test). LBD showed lower cerebral blood flow in the PR and higher flow in the PCC; however, the differences were not statistically significant between AD and LBD (p = 0.05; p = 0.06).
Comparisons of mean CSF Aβ42 levels among AD (227 pg/mL), DLB (250 pg/mL), and PD (418 pg/mL) showed no significant differences (F = 2.74, p = 0.11). However, Aβ42 /Aβ40 differed significantly between the groups (F = 15.73, p < 0.01), with a significant difference between AD and PD (p < 0.01), but not between AD and DLB (p = 0.11) or between DLB and PD (p = 0.14). We also assessed the correlations of CSF biomarkers to other data. Table 2 shows the correlation coefficient values between the data. In LBD, the CIScore was not correlated with CDR, VRS-MTA, or any CSF biomarker. However, VRS-MTA was positively correlated with CDR, p-tau, and t-tau in DLB (r = 0.87, p < 0.01; r = 0.57, p = 0.02; r = 0.55, p = 0.03). In AD, p-tau was negatively correlated with Aβ42/Aβ40 and cerebral blood flow in the PCC (r = –0.62, p = 0.01; r = –0.65, p < 0.01). T-tau in AD was also negatively correlated with Aβ42/Aβ40 and cerebral blood flow in the PCC (r = –0.71, p < 0.01; r = –0.63, p < 0.01).
Spearman’s rank correlation coefficients between CIScore, VRS-MTA, and CSF biomarkers in LBD (DLB & PD) and AD
CDR, Clinical Dementia Rating; PCC, Posterior cingulatecortex region in CIScore; PR, posterior region in CIScore; VRS-MTA, visual rating of medial temporal atrophy. * p < 0.05 based on Spearman’s rank correlation coefficient.
DISCUSSION
The main finding of this study was that the preservation of posterior cingulate cerebral blood flow within the PR on SPECT (CIScore in eZIS) was not associated with tau or Aβ levels in DLB. The CIS distinguished patients with pathologic DLB from those with AD with high sensitivity and specificity in autopsy cases, FDG-PET, and SPECT studies [5 , 19]. Many patients with DLB have diffuse Aβ plaques and associated NFT-tau pathology. Recognition of the degree of AD pathology through biomarkers in DLB cases is important because coexisting AD pathology predicts poor treatment response to acetylcholinesterase inhibitors in DLB [20]. CSF levels of Aβ are a useful biomarker for cerebral amyloid accumulation in the early stage of AD pathology. CSF Aβ42 usually decreases and plateaus before the onset of dementia [21]. The results of our study confirmed that CIS distinguishes LBD (DLB and PD) from AD in SPECT and that the CSF Aβ level is not correlated with CIS in LBD. This finding indicated that Aβ deposition in the brain is not directly associated with cerebral blood flow in the posterior cingulate or occipital region in DLB. The presence of CIS was not influenced by Aβ pathology on Pittsburgh compound B (PiB)-PET [5]. Occipital hypometabolism in DLB is independent of Aβ load [22] and may be related to impaired cholinergic transmission or synaptic dysfunction associated with α-synuclein [23]. Dysfunction of the nucleus basalis of Meynert is linked to cholinergic deficits in DLB and AD [24]. The subregion-specific atrophy in the basal forebrain in DLB is related to regional cholinergic deficits and low cerebral blood flow in the occipital region [25]. However, the mechanism of CIS requires further investigation.
In addition, the results of our study confirmed that hippocampal atrophy (VRS-MTA) was positively correlated with disease severity (CDR), p-tau, and t-tau in DLB. Hippocampal atrophy is also associated with the Braak NFT stage in DLB [5]. Hippocampal atrophy and high CSF p-tau level provide important ancillary diagnostic information on Braak NFT stage in DLB and disease severity.
Finally, we showed that a CIScore was useful for the diagnosis of AD and DLB in SPECT studies, accounting for patient disease duration and hippocampal atrophy. We also found that the CIScore was not correlated with CSF biomarkers, whereas p-tau and t-tau levels were correlated with hippocampal atrophy and disease severity.
Footnotes
ACKNOWLEDGMENTS
This work was supported by Grants-in-Aid for Young Scientists (Kakenhi) from the Japan Society for the Promotion of Science (JSPS) under Grants JP20K19111 (A.F.), Grants-in-Aid for Scientific Research (Kakenhi) from the Japan Society for the Promotion of Science (JSPS) under Grants JP26461266 and JP19K07965 (K.O.), and Research and Development Grants from the Japan Agency for Medical Research and Development (16dk0207021h0001) (K.O.).