
Abstract
Background:
Older adults living with amnestic mild cognitive impairment (aMCI) not only demonstrate impairments in Theory of Mind (ToM), relative to adults with non-amnestic MCI (naMCI), but are also at a higher risk of developing dementia.
Objective:
Our primary objective was to ascertain whether default mode network (DMN) functional connectivity was differentially associated with ToM abilities between MCI subgroups.
Methods:
Using functional magnetic resonance imaging, we investigated alterations in resting-state functional connectivity within the brain’s DMN in a sample of 43 older adults with aMCI (n = 19) and naMCI (n = 24), previously reported to demonstrate poorer ToM abilities.
Results:
Compared to naMCI, the aMCI subgroup revealed a significant association between poorer ToM performance and reduced functional connectivity between the bilateral temporal pole (TempP) and the left lateral temporal cortex (LTC) (LTC_L-TempP_L: b = –0.06, t(33) = –3.53, p = 0.02; LTC_L-TempP_R: b = –0.07,t(33) = –3.20, p = 0.03); between the right TempP and the dorsal medial prefrontal cortex (dMPFC) (b = –0.04, t(33) = –3.02, p = 0.03) and between the left and right TempP (b = –0.05, t(33) = –3.26, p = 0.03). In the naMCI subgroup, the opposite relationship was present between the bilateral TempP and the left LTC (Combined correlation: r = –0.47, p = 0.02), however, not between the right TempP and the dMPFC (r = –0.14, p = 0.51) or the left and right TempP (r = –0.31, p = 0.14).
Conclusion:
Our findings suggest that alterations in functional connectivity within the DMN involving temporal and frontal lobe regions are associated with ToM deficits in aMCI.
Keywords
INTRODUCTION
Theory of Mind (ToM), or the ability to understand the mental states, beliefs, and feelings of other people [1, 2], represents one component of the broader neurocognitive domain known as social cognition [3]—a set of cognitive processes involved in recognizing, understanding, and responding to social cues [1]. Separated into two sub-processes, cognitive ToM refers to cognitive states, thoughts, intentions, beliefs, and motivations of another person, while affective ToM ability allows for the inference of feelings, emotions, and affective states [4]. Altogether, ToM is considered to be pivotal in contributing to the development and maintenance of interpersonal relationships. An accumulating body of work suggests that these abilities decline with aging [5], and that this may be more pronounced in those at high risk for dementia.
Mild cognitive impairment (MCI) is a term often used when an individual has objective evidence of cognitive decline, in the presence of absent-to-minimal functional decline [6]. Approximately half of those with MCI will progress to dementia within five years of diagnosis (see review by [7]), particularly those with amnestic MCI (aMCI), where memory deficits are predominant [8]. Several studies have now examined ToM in individuals with aMCI and have shown that ToM abilities are reduced relative to those with naMCI (i.e., deficits in non-memory domains) and age-matched controls (see recent meta-analysis by [9]). Evidence also shows that individuals with aMCI demonstrate volume reductions in key limbic structures such as the hippocampus [10–13], a brain region known to be critical for social cognitive function. Our prior work sought to determine how ToM may relate to hippocampal integrity in MCI. That study was pivotal in highlighting that while ToM decrements are related to hippocampal atrophy, broader and distributed networks are likely to be implicated [13].
Resting-state functional MRI (rsfMRI) has proven crucial for identifying altered patterns of brain functional connectivity in older individuals living with MCI prior to conversion to dementia [14–16]. While a number of resting-state networks have been identified [17], the most widely studied is the default mode network (DMN), a network that is activated preferentially, but not exclusively during rest [18]. The DMN includes regions such as the precuneus/posterior cingulate cortex, mesiofrontal/anterior cingulate cortex, and temporoparietal junction [19]. In addition to these hubs, the DMN has also been shown to recruit, among others, the dorsal medial prefrontal cortex (dMPFC), temporal poles (TempP), and the lateral temporal cortex (LTC) [20].
Indeed, the DMN is thought to be linked to ToM as its fundamental function is to facilitate internal mental activity, including processes such as retrieval of past information, envisioning the future, and intuitive understanding of the thoughts and perspectives of both self and others [20, 21]. In people with Alzheimer’s disease (AD), there is evidence that a breakdown in the distributed neural network of the DMN possibly underpins impairments in social cognition [22–24]. Indeed, alterations in DMN functional connectivity have also been reported in other clinical groups with prominent impairments in social cognitive function, such as autism spectrum disorder and frontotemporal dementia [25, 26]. In these groups, such alterations have been associated with reduced ability to appropriately perceive oneself in relation to other people, and a general inability to flexibly process socially relevant stimuli.
Currently, it remains unclear whether alterations in DMN activity might relate to social cognitive function, particularly ToM abilities, in older people with aMCI or naMCI. Indeed, in a larger prior study from which this subsample were recruited [13], aMCIs (n = 37) demonstrated poorer ToM abilities as indexed by the Reading the Mind in the Eyes Test (RMET) [27] relative to naMCIs (n = 77; d = 0.27). The RMET is a well-validated social cognitive measure of affective ToM which requires participants to infer mental states on the basis of eye-gaze cues [27, 28]. It has been shown to be a sensitive measure towards affective ToM in several different clinical groups (i.e., schizophrenia and AD) [29, 30]. Addressing these gaps is important since a decline in ToM abilities has been associated with poorer psychosocial functions in aMCI [13, 31] and disability in naMCI [31]. As such, an improved understanding may help to inform targeted assessment and intervention opportunities.
Therefore, in this study, our primary aim was to ascertain whether DMN functional connectivity was differentially associated with ToM abilities between the MCI subgroups. We hypothesized, given the literature [32] and prior work [13], that those with aMCI would demonstrate more pronounced relationships between reductions in ToM performance and altered DMN functional connectivity, relative to those with naMCI.
MATERIALS AND METHODS
Sample
Forty-three adults meeting clinical criteria for MCI [33] were recruited from a specialist “Healthy Brain Ageing” research clinic at the Brain and Mind Centre, The University of Sydney, Sydney, Australia. This clinic receives referrals from neurologists, psychiatrists, geriatricians, and general practitioners, and preferentially targets people over the age of 50 who have new onset cognitive and/or mood symptoms. MCI participants included in this study are a representative subsample of a larger sample (n = 166) that we have previously reported on [13], and this specific subsample were examined as they had undergone rsf MRI scanning. The participants included in this study did not differ in terms of age (t(209) = –0.21, p = 0.84), or Mini-Mental State Examination score (MMSE) [34] (t(209) = –0.84, p = 0.40), from the larger sample.
In addition to the availability of rsfMRI data, inclusion criteria for all participants were: aged between 50 and 75 years; English as a first language (with respect to validity of the standardized neuropsychological assessments); and a MMSE score of ≥24. Exclusion criteria were: severe psychiatric disorder (e.g., schizophrenia, psychosis), head injury with a loss of consciousness greater than 30 minutes, prior stroke or transient ischemic attack, neurological disorder (e.g., epilepsy, Parkinson’s disease); dementia (as determined by comprehensive clinical neuropsychological and psychiatric assessment); intellectual disability; current or past substance abuse; or impaired basic facial processing (as measured by a score of < 41 on the Benton Facial Recognition Test [35].
The study was approved by the University of Sydney Human Research Ethics Committee, all participants gave written informed consent, and all data was obtained in compliance with the Helsinki Declaration.
Clinical ratings
A neurologist or geriatrician conducted a structured clinical assessment for all participants to confirm inclusion/exclusion criteria. The Mini-International Neuropsychiatric Interview (MINI) [36], a semi-structured clinical interview was administered to determine lifetime and current major depression. In addition, medical burden was assessed using the Cumulative Illness Rating Scale, Geriatric Version (CIRS-G) [37].
For clinical diagnosis of MCI, all participants were required to demonstrate objective decline of at least 1.5 standard deviations on one or more of the cognitive domains assessed by neuropsychological testing, relative to premorbid estimates. This objective decline was also required to be reported subjectively by the individual and/or an informant such as their significant other and occur in the presence of no or minor functional decline [33]. MCI diagnosis was rated on consensus by two neuropsychologists and a medical specialist. For the purpose of this study, MCI was categorized further into amnestic (aMCI, n = 19) and non-amnestic (naMCI, n = 24) subgroups. Participants met aMCI criteria if they demonstrated clear evidence of impairment in at least delayed recall memory performance. By contrast, naMCI criteria was defined by deficits on tests assessing other cognitive domains (e.g., processing speed, working memory, language, visuospatial, or executive function). Of 43 participants meeting criteria for MCI, 20 (aMCI, n = 10; naMCI, n = 10; 46.5%) were taking psychotropic medications at the time of their assessment. The majority of participants were prescribed either a selective serotonin reuptake inhibitor (SSRI) (6/20, 30%) or a serotonin-norepinephrine reuptake inhibitor (SNRI) (7/20, 35%). The remaining participants were taking a benzodiazepine (1/20, 5%), mood-stabilizers (2/20, 10%), tricyclic antidepressants (TCA (1/20, 5%), monoamine oxidase inhibitors (MAOI) (1/20, 5%), selective nor-adrenaline reuptake inhibitors (NARI) (1/20, 5%), or a melatonin (1 and 2) receptor agonist (1/20, 5%).
Neuropsychological assessment
A standardized neuropsychological test battery, as described in detail elsewhere [38], was administered by a clinical neuropsychologist. The tests we report in this study for descriptive purposes are the Rey Auditory Verbal Learning Test (RAVLT) [39], the Digit Span subtest from the Wechsler Adult Intelligence Scale–III (Digit Span) [40], the Delis–Kaplan Executive Function System Color-Word Interference Test (DKEFS CWIT) [41], the Controlled Oral Word Association Test (COWAT) [42], the Boston Naming Test (BNT) [43], and the Trail Making Test Part A and Part B (TMT-A and TMT-B) [44].
The MMSE was also administered as a gross measure of global cognitive functioning as well as the Wechsler Test of Adult Reading [45] as a measure of premorbid intellectual ability.
Theory of mind
The Reading the Mind in the Eyes Test (RMET) [27] was administered by a neuropsychologist to assess participants’ affective ToM ability (simply ToM ability). The 36-item assessment requires the participant to infer mental/emotional states from a photograph showing the isolated eye region of an unknown person’s face. The participant must infer the mental/emotional state of that person from four options (e.g., terrified, upset, arrogant, or annoyed). The total raw score is calculated based on the number of total correct responses. In this study, raw scores were used for subsequent analysis, and age was included as a covariate in the model(s) employed for functional connectivity analysis.
Self-report
Mood: To determine depression and anxiety symptom severity, participants completed the Hospital Anxiety and Depression Scale (HADS) [46]. Scores for the entire scale range from 0 to 42, whereby individual scores for each subscale (anxiety and depression) range from 0 to 21. Higher scores indicate a greater severity of symptoms. A score 0 to 7 is considered to be normal, 8 to 10 borderline abnormal, while a score between 11 to 21 is abnormal.
Image acquisition and analyses
All 43 participants underwent MRI scanning using a 3T GE Discovery MR750 scanner (GE Medical Systems, Milwaukee, WI) within four weeks of their neuropsychological assessment at the Brain and Mind Centre imaging facility.
Volume segmentation analysis
As described previously [47], an eight-channel phased-array head coil using a T1-weighted magne-tization-prepared rapid gradient echo sequence was used producing (196 sagittal slices, Repetition Time (TR) = 7.2 ms; Echo Time (TE) = 2.8 ms; flip angle = 10°; matrix 256×256; 0.9 mm isotropic voxels). For each participant, two T1-weighted scans were obtained, of which the sequence with the higher signal-to-noise ratio was used. The region of interest for this subsample study was the hippocampus. Both left and right hemispherical hippocampal volumes, as described previously [47], were extracted using a semi-automated segmentation routine based on the principles of the Active Shape and Appearance Models within a Bayesian framework as implemented by ‘FMRIB’s Integrated Registration and Segmentation Tool (FIRST)’ in FMRIB Software Library. Briefly, T1 data were reoriented, converted to Neuroimaging Informatics Technology Initiative (NIFTI) format, and skull-stripped, and the FIRST routine was applied to estimate regional volumes. As a part of the segmentation routine, data were registered to MNI standard space and boundary correction was applied, with data visually inspected for errors. Total volume for each structure was calculated from the addition of boundary and intracranial volume corrected left and right regional volumes. One aMCI case was found to be a significant outlier for hippocampal volume and was thus curtailed to the next highest score in the sample.
Resting-state acquisition
T2-weighted echo planar images (EPI) were acquired with TR = 3000 ms, TE = 36 ms, flip angle = 90°, 39 axial slices covering the whole brain, field of view = 240 mm, and in-plane voxel size = 3.75 mm×3.75 mm×3 mm, matrix: 64×64, total scan time = 7.25 min. RsfMRI data were acquired in a single run, where each participant lay supine in the scanner with their eyes closed and was instructed to allow their mind to wander.
Resting-state fMRI analysis
Image processing and analysis was performed using Statistical Parametric Mapping software (SPM8, Wellcome Trust Centre for Neuroimaging, London, UK) on MATLAB (MATLAB and Statistics Toolbox Release 2015b, The Mathworks Inc., Natick, MA, USA). The first five volume acquisitions of the resting-state EPI data were discarded to eliminate spurious T2-equilibration effects. The remaining 140 scans subsequently underwent pre-processing according to a standardized pipeline. This incorporated slice-time correction to the median (17th) slice within each TR, scan realignment to create a mean realigned image, measures of six-degrees of rigid head movements were calculated for later use in the correction of minor head movements, image normalization (using T2 template) via a linear (12-parameter affine) transformation followed by non-linear warping, and Gaussian kernel smoothing (8 mm FWHM isotropic).
Connectivity analysis
After pre-processing, images were imported into the Functional Connectivity toolbox (CONN; http://www.nitrc.org/projects/conn) in MATLAB. A temporal band pass filter was applied (0.009–0.08 Hz) and nuisance parameters (and their first temporal derivatives) were subsequently regressed from the data. These included the six motion parameters extracted from the realignment process and the signal from separate 8 mm regions of interest (ROIs) placed within white matter and the cerebrospinal fluid. Furthermore, scans deemed to be movement outliers as detected by the ART toolbox (http://nitrc.org/projects/artifact_detect) were regressed out. Outliers were defined as volumes with frame-wise displacement greater than 0.5 mm or signal intensity changes greater than three standard deviations. There are the recommended conservative settings implemented in the toolbox, based on 95th percentiles in the normative sample. The mean BOLD signal time courses were then extracted from each ROI. Time courses for each ROI were then correlated with the time courses for all other ROIs, producing Pearson’s r-values that were subsequently converted into z-scores using a Fisher’s r-to-z transformation.
Default mode network statistical analysis
An ROI-to-ROI analysis was conducted, with 8 mm spherical ROIs selected according to those which comprise the DMN, based on previously published coordinates [18]. The 20 ROIs incorporated the dorsomedial and ventromedial prefrontal cortex, as well as bihemispheric regions of: the anterior medial prefrontal cortex, posterior cingulate cortex, temporal pole, lateral temporal cortex, retrosplenial cortex, hippocampal formation, posterior inferior parietal lobule, temporoparietal junction, and the parahippocampal cortex. Unpaired t-tests were carried out on each resting-state DMN connection to determine whether there were any between-groups differences in functional connectivity. The significance threshold was determined using a false discovery rate (FDR) with α set to 0.05 [48]. p-values reported throughout this manuscript with respect to functional connectivity analyses are the FDR-corrected values. The aMCI and naMCI subgroups did not differ significantly with respect to mean head movement (b = 0.01, t(41) = 0.37, p = 0.71). Groups also did not differ significantly with respect to head movement variance (b = –0.13, t(41) = –0.62, p = 0.54).
Statistical analyses
Analyses were conducted using SPSS Version 24 (SPSS Inc., Chicago, IL, USA). To examine group differences for demographic, clinical and neuropsychological data, independent sample t-tests were used, however when data were identified as non-normally distributed, the non-parametric Mann-Whitney U-test was used. Categorical data (e.g., sex) were analyzed using Chi-squared tests. All analyses were two-tailed and employed an α level of 0.05. In terms of the functional connectivity analyses, these were run under the General Linear Model framework, using an ANCOVA to assess whether there were significant between-group differences in terms of RMET performance and functional connectivity (i.e., comparing the regression slopes), whilst controlling for the potential confounds of age, hippocampal volumes, and psychotropic medication use in all analyses.
RESULTS
Demographic and neuropsychological characteristics
Table 1a outlines the demographic and clinical characteristics of the sample. The aMCI subgroup, on average, had a lower MMSE score compared to the naMCI subgroup (p = 0.01). There were no significant differences between aMCI and naMCI subgroups, in terms of mean age, years of education or estimated premorbid intellectual ability. In particular, across both groups, participants reported symptoms of depression and anxiety considered to be within the normal range for the HADS (i.e., an anxiety or depression score ≤7 is considered normal).
Demographic and clinical data for amnestic- and non-amnestic- Mild Cognitive Impairment subgroups (mean±S.D [range]*)
aMCI, amnestic mild cognitive impairment; naMCI, non-amnestic mild cognitive impairment; IQ, intelligence quotient; MMSE, Mini-Mental State Examination; HADS, Hospital Anxiety and Depression Scale; CIRS-G, Cumulative Illness Rating Scale Geriatric Version. aaMCI (n = 18); naMCI (n = 23); baMCI (n = 17); naMCI (n = 16); caMCI (n = 18). †Chi-squared test ¥Reflects values after correcting for intracranial volume differences. *[range] refers to the minimum and maximum values for each group.
Table 1b outlines the neuropsychological characteristics of the sample. Compared to the naMCI subgroup, the aMCI subgroup revealed significantly poorer performance for tests assessing verbal learning (RAVLT 1–5, p < 0.01) and delayed recall (RAVLT 7/5%retention, p < 0.01). As expected, aMCI and naMCI subgroups did not differ on basic facial processing as measured by the Benton Facial Recognition Test [35].
Neuropsychological data for Mild Cognitive Impairment (sub)groups (mean±S.D [range]*)
aMCI, amnestic mild cognitive impairment; naMCI, non-amnestic mild cognitive impairment; RMET, Reading the Mind in the Eyes Test; BFRT, Benton Facial Recognition Test; RAVLT 1–5, Rey Auditory Verbal Learning Test-total learning over 5 trials; RAVLT 7/5%retention, Rey Auditory Verbal Learning Test-percent retention scores (i.e., (Trial 7 / Trial 5) * 100); DKEFS CWIT, Delis–Kaplan Executive Function System Color-Word Interference Test, Condition 4 (inhibition/switching); COWAT-FAS, Controlled Oral Word Association Test with letters ‘F’, ‘A’ and ‘S’; TMT-A, Trail Making Test Part A; TMT-B, Trail Making Test Part B.
Theory of Mind abilities: Reading the Mind in the Eyes Test (RMET)
Table 1b shows RMET performance for aMCI and naMCI subgroups. In the current study, the aMCI subgroup (n = 19) did not demonstrate significantly poorer performance on the RMET compared to the naMCI subgroup (n = 24; d = 0.06).
Accordingly, a formal post-hoc power analysis for sample estimation was conducted (GPower 3.1), revealing that we were underpowered in this study to detect the effects sizes found previously in our larger groups for aMCI versus naMCI (power = 0.13). It is important to note here that, having established RMET performance differences in the larger sample, this was not our focus. Instead, the focus of this study was to investigate any differential relationships that our MCI groups may have with RMET performance which manifest as alterations in functional connectivity strength in a specific brain network.
Resting-state connectivity analysis
aMCI versus naMCI
When controlling for age only, poorer RMET performance was associated with weaker functional connectivity in aMCIs relative to naMCIs, with the difference in these relationships representing significant interactions. Specifically, poorer RMET performance for the aMCI subgroup was associated with weaker functional connectivity strength between the bilateral TempP and the left LTC, with the opposite relationship found in the naMCI group (LTC_L-TempP_L: b = –0.05, t(37) = –3.04, p = 0.04; LTC_L-TempP_R: b = –0.06 t(37) = –3.40, p = 0.03).
As also reported in Table 2 and illustrated in Fig. 1a, after controlling for age, hippocampal volume, and psychotropic medication use, RMET performance remained differentially associated with functional connectivity strength between the MCI subgroups. Specifically, poorer RMET performance for the aMCI subgroup was associated with weaker functional connectivity strength between the bilateral TempP and the left LTC (LTC_L-TempP_L: b = –0.06, t(33) = –3.53, p = 0.02; LTC_L-TempP_R: b = –0.07, t(33) = –3.20, p = 0.03; Combined correlation: r = 0.55, p = 0.01), as well as between the right TempP and the dMPFC (r = 0.54, p = 0.02) (b = –0.04, t(33) = –3.02, p = 0.03) and the left and right TempP (r = 0.47, p = 0.04) (b = –0.05, t(33) = –3.26, p = 0.03). In the naMCI subgroup, the opposite relationship was present between the bilateral TempP and the left LTC (Combined correlation: r = –0.47, p = 0.02), however, not between the right TempP and the dMPFC (r = –0.14, p = 0.51) or the left and right TempP (r = –0.31, p = 0.14). To further quantify the magnitude of the differences between the correlation coefficients of the two group, two-tailed Fisher’s r-to-z transformations were carried out (Table 3), indicating that the combined correlations between bilateral TempP-to-LTC_L functional connectivity and RMET performance (z = 3.40, p = 0.001), as well as between TempP-to-dMPFC (z = 2.25, p = 0.02) and TempP_L-to-TempP_R (z = 2.50, p = 0.01) were each significantly different between aMCI and naMCI subgroups.
Summary of significant ROI-to-ROI results between MCI subgroups based on RMET performance; age, psychotropic medication use and hippocampal volumes were controlled for in this analysis
ROI, region of interest; aMCI, amnestic mild cognitive impairment; naMCI, non-amnestic mild cognitive impairment; TempP, temporal pole; LTC, lateral temporal cortex; dMPFC, dorsal medial prefrontal cortex. ‡Denotes p-values corrected for multiple comparisons using FDR-correction.
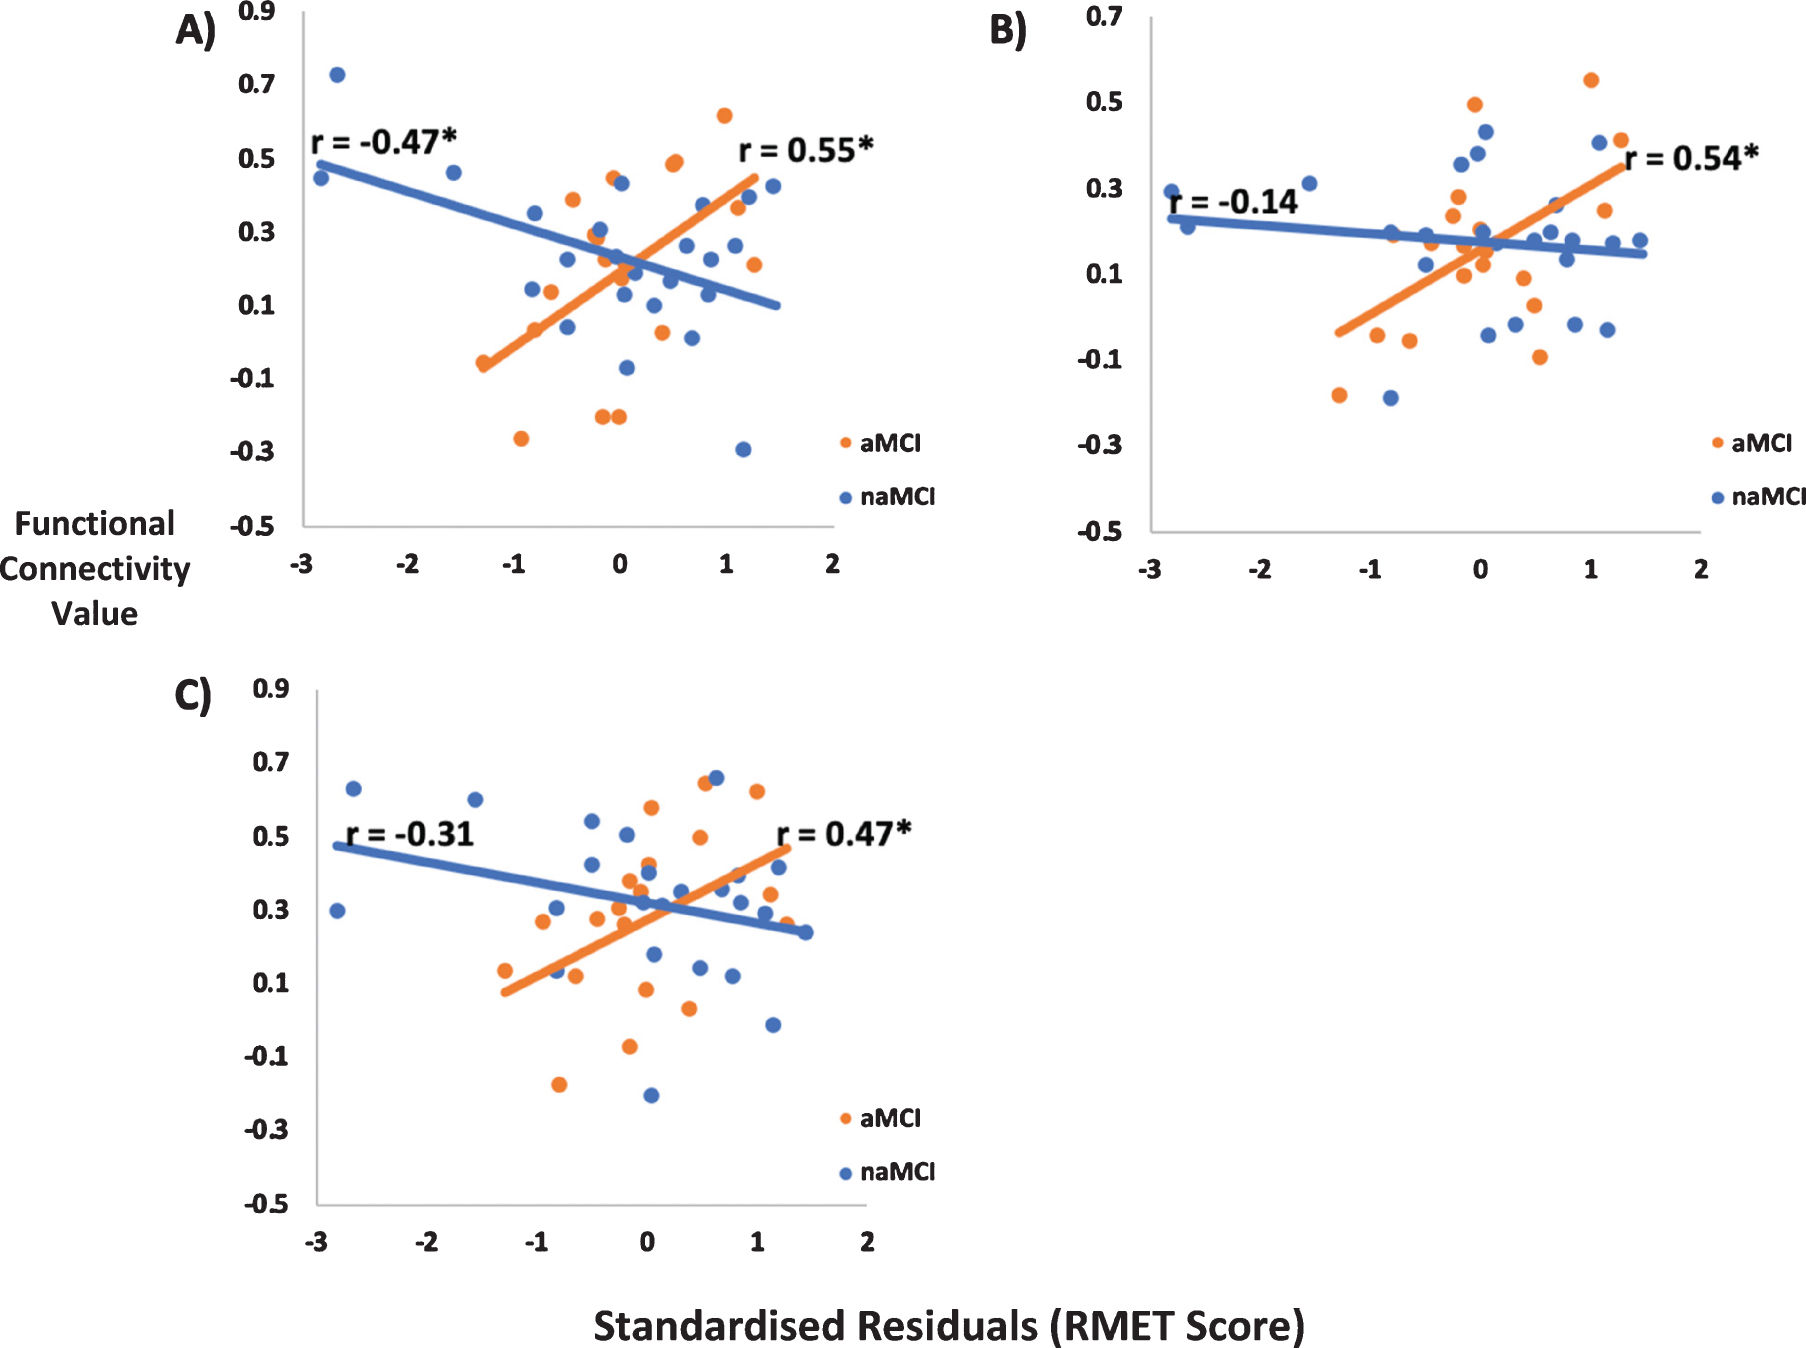
Strength of functional connectivity between significant ROIs plotted against standardized residual RMET score for the aMCI (orange markers) and naMCI (blue markers) subgroups (A, B, and C) respectively). A) Correlation between bilateral temporal pole and the left lateral temporal cortex functional connectivity and RMET score. B) Correlation between right temporal pole and the dorsal medial prefrontal functional connectivity and RMET score. C) Correlation between left temporal pole and the right temporal pole functional connectivity and RMET score. *p < 0.05; note: functional connectivity strength denotes Fisher r-to-z transformed Pearson’s r values—this has the effect of ensuring the correlation coefficients are normally-distributed.
Fisher’s r-to-z transformation comparing the difference between the correlation coefficients from Figure 1a
RMET, Reading the Mind in the Eyes Test; aMCI, amnestic mild cognitive impairment; naMCI, non-amnestic mild cognitive impairment; TempP, temporal pole; LTC, lateral temporal cortex; dMPFC, dorsal medial prefrontal cortex.
DISCUSSION
To our knowledge, this is the first study to examine associations between altered patterns of functional connectivity within the DMN and affective ToM ability, as measured by RMET performance, in older people living with aMCI or naMCI. The RMET has been shown to very sensitive to poorer ToM abilities in a number of different clinical samples [29, 30], with RMET-based fMRI studies helping identify aspects of the social cognition network (i.e., temporo-parietal junction, medial prefrontal cortex) to be heavily involved in ToM functioning [49]. We showed that differential relationships exist between aMCI and naMCI, in relation to functional connectivity strength within the DMN and ToM ability. Specifically, reduced connectivity within the DMN involving temporal and frontal lobe regions is associated with ToM deficits in aMCI, beyond the previously identified changes in limbic structure volumes [13]. Overall, our study adds to a growing body of evidence not only implicating alterations in DMN networks in MCI [50] and AD [51], but more specifically shows that alterations in this network may also underpin very early and subtle changes in social cognition in those at high risk for dementia, in particular those with aMCI who are typically at higher risk for conversion to AD [8].
Given prior work showing that impairments in ToM abilities are especially pronounced in people with aMCI [13], our primary aim was to examine the inter-relationships between ToM and functional connectivity strength in the aMCI compared to the naMCI subgroup. Our findings revealed that those with aMCI and poorer ToM abilities have weaker functional connectivity between the bilateral TempP and the left LTC. This finding is interesting in light of work showing that the TempP is highly involved in processed perceptual inputs with visceral emotional responses [52], and that the LTC is critical for semantic memory [53], and complex binding processes that support storage of the perception-emotion linkages underpinning personal semantic memory [52]. Thus, it may be that a weakening of TempP and the LTC connections are negatively influencing ToM functioning—such that disruption of semantic memory networks, which are considered to be crucial for the processing of common ToM stimuli (as is required with the RMET) [54], contribute to poorer ToM abilities in aMCI. Indeed, our findings revealed that poorer ToM abilities in aMCI were also associated with decreased functional connectivity between the left and right TempP which adds to the argument that a breakdown in the storage of the perception-emotion linkages aided by the TempP may be in part underpinning ToM performance in aMCI.

In situ representation of functional connectivity changes associated with RMET performance between ROIs within the DMN. Functional connectivity between the left temporal pole and the right temporal pole; right temporal pole and the dorsal medial prefrontal cortex; left lateral temporal cortex and the left temporal pole; left lateral temporal cortex and the right temporal pole. Fig. 1b denotes coronal view of the brain.
Within the aMCI subgroup, we also found weakening of the association between the right TempP and the dMPFC. The dMPFC has previously been implicated in ToM functioning [55, 56] and is considered to be part of a ‘mentalizing network’ supporting cognitively-oriented mentalizing, entailing reflective, and hypothetical social processing [57]. Thus, weakening of this functional connection, whereby attenuation of emotional responses aided by the TempP in addition to disruption of part of the mentalizing network, may be affecting ToM abilities as these regions are both key to intact ToM functioning. Ultimately, the finding of selective associations between ToM and weaker functional connectivity in frontotemporal regions of this resting-state network may well provide a plausible explanation as to why those with aMCI have poorer ToM abilities. That is, this subgroup already demonstrates memory impairment, and appear to be losing network coherency in areas that support effective memory and social cognition processes. By contrast, the frontotemporal disruption appears to be less pronounced in naMCI, aligned with findings that ToM is less impaired in this subgroup [58].
Interestingly, we report that for naMCIs, poorer ToM abilities were associated with stronger functional connectivity for the bilateral TempP and left LTC connection, while ToM abilities did not appear to meaningfully depend on functional connectivity strength between the right TempP and the dMPFC, as well as between the left and right TempP. While it remains unclear as to why poorer ToM abilities for naMCIs were associated with stronger functional connectivity in these regions, other mental health (depression, anorexia) and neurology (multiple sclerosis) studies have also reported increases in functional connectivity within the DMN [59–61], albeit not with reference to social cognition. While the mechanisms that underpin such increases in DMN connectivity are yet to be elucidated, it has been suggested that factors such as rumination (i.e., passive and judgmental thoughts about one’s mood, condition, and/or inadequacies) are relevant. That is, individual’s engaging in rumination may be relying more heavily on the DMN, as internal mentation and self-reflection are considered to be crucial for its function [21, 59]. Although our naMCI sample in this study did not report levels of depressive symptoms higher than normal, naMCIs have not only been reported to exhibit significantly greater depressive symptoms compared to healthy controls [62, 63], but also higher levels of apathy which may be considered to be driving poorer performance at the time of neuropsychological assessment, contributing to an naMCI diagnosis [64]. Thus, a possible explanation exists suggesting that increased DMN functional connectivity in naMCI is linked to greater levels of apathy which too finds association with depression and rumination in the elderly [65, 66]. Nevertheless, measures of apathy were outside the scope of this study, and it is clear that further larger cohort studies would be required to further explore this outcome in naMCI. Notably, for those with naMCI, ToM does not appear to be linked to the strength of connection between the temporal poles or its connection to the dMPFC suggesting that distinct mechanisms underpin ToM in the MCI subgroups and these groups must be considered separately.
The current study has important implications for broader clinical and psychosocial functioning involving adults living with aMCI. That is, given that several studies have now reported that changes to ToM abilities may represent one of the earliest clinical signs of cognitive decline in aging, it is prudent to include measures of ToM in the clinical assessment of individuals with suspected aMCI or AD [31, 67]. This is especially important given prior work [31] has shown that poorer ToM abilities are associated with poorer everyday skills in social contexts, and that broader impairments in social cognitive function are associated with increased caregiver burden in aMCI. Thus, identification of impaired ToM could be important to communicate to family/significant others (regarding the nature and extent of these social cognitive deficits, alongside adaptive or compensatory strategies to facilitate communication) facilitating improved understanding and fostering strategies to mitigate a breakdown in interpersonal relationships. In other conditions where there is a decline in social cognition (e.g., autism, traumatic brain injury), social cognition training has proved successful [68, 69] and may have potential for those with aMCI or dementia.
There were some limitations to this study. First, since the current study was cross-sectional in nature, future longitudinal examination would be of interest to determine how such functional and cognitive changes progress over time, particularly in those older people with aMCI who do convert to dementia. Second, it is worth noting that while the RMET is a well-validated measure of ToM ability [27, 28], it focuses on only one of the four core domains of social cognitive function, and inclusion of additional tasks that tap into other domains of social cognition (i.e., empathy or social behavior) would enable a more comprehensive examination of social cognition [70]. Thirdly, our rsfMRI analyses controlled for three covariates (age, psychotropic medication, and mean hippocampal volume). Using the widely implemented suggestion that approximately fifteen cases are required per covariate [71], the current analyses ideally would have 45 cases or more. Our aMCI versus naMCI subgroup analyses approximately reached this criterion (n = 43). As such, we report our findings with confidence but also note that replicating this study with a larger sample size would confirm their robustness. Indeed, although we applied FDR-correction to limit the chance of Type I error (i.e., a false-positive result), we acknowledge that given that we were slightly underpowered (power < 0.8) when detecting our bilateral TempP to left LTC findings for both aMCI and naMCI groups (aMCI, power = 0.77; naMCI, power = 0.70), the chance for a false-positive result while unlikely, is possible. Further when we controlled for one covariate only (age), thus substantially increasing statistical power relative to controlling for three covariates, we still found that aMCIs and naMCIs had the same crossover interaction between functional connectivity strength and RMET performance between the bilateral TempP and the left LTC, thereby indicating that this is considerably unlikely to be a false positive related to power. With respect to cognition, our between-groups cognitive measures utilized t-tests which are capable of providing reliable estimates with relatively small samples [72]. Given that many of our between-group differences demonstrated medium or large effect sizes, we have confidence in these findings. However, we acknowledge that replication in larger samples would confirm the robustness of these between-group findings. Therefore, future investigations involving larger, independent cohorts are warranted not only to confirm our functional connectivity findings, but to also ensure whether differences between aMCI and naMCI groups on cognitive measures are a robust finding. Furthermore, current levels of depression symptomatology would also be an important factor to take into account during future studies with larger groups sizes.
In addition, given that both the aMCI and naMCI sample in the present study were relatively well-educated, this may limit the generalizability of our results to the broader population. In particular, since both education and IQ have been considered to be neuroprotective factors in the decline of mental function and social cognition and may contribute to an individual’s capacity to recruit compensatory mechanisms [73], it is possible that those with lower rates of education may demonstrate even greater ToM impairment than those observed in this sample. Moreover, the authors note that while MCI subgroups did not differ on concurrent cognitive flexibility, an aspect of higher-level executive function as assessed by DKEFS CWIT Condition 4, the current study did not include an extensive assessment of executive function. This is important as it has been argued that poorer ToM abilities can be attributed, at least in part, due to deficits in executive function [74]. Thus, future studies should not only seek to control for performance on tasks of executive function during analyses, but also investigate the relationship between different networks (i.e., control networks) which have been shown to support older adult’s functioning [75] which may also affect ToM performance. Lastly, given that the RMET is a well-validated social cognitive measure of affective ToM ability, and that ToM encompasses both affective and cognitive components, it would be important for future studies to investigate whether differential or similar patterns of functional connectivity strength in the DMN exist between cognitive and affective ToM abilities.
In summary, to our knowledge this is the first study to demonstrate differential relationships between functional connectivity strength in the DMN and ToM abilities among people with aMCI and naMCI. These findings furthermore highlight that a breakdown in a more distributed brain network such as the DMN is associated with impairments in ToM abilities in aMCI beyond those previously identified via volume reductions in limbic structures. The prognostic relevance of social cognitive change early in the course of neurodegeneration for social connectedness, interpersonal relationships, quality of life, and functional deterioration now needs to be examined longitudinally, with a view to developing early and targeted social cognition interventions during critical periods of neurodegeneration. In addition, our findings add to a growing literature that suggests it is of considerable importance to include measures of social cognition in the routine clinical workup of individuals with cognitive decline, alongside facilitating adaptive or compensatory strategies to mitigate the effect of poorer social cognition on interpersonal relationships.
Footnotes
ACKNOWLEDGMENTS
J. Michaelian is supported by a Dementia Centre for Research Collaboration (DCRC) Postgraduate Research Scholarship. Prof S. Naismith is supported by a National Health and Medical Research Council (NHMRC) Boosting Dementia Leadership Fellowship (ID 1135639). Dr A. McKinnon is supported by the NHMRC Centre of Research Excellence to Optimise Sleep in Brain Ageing and Neurodegeneration (CogSleep). Dr S. Duffy is supported by an NHMRC-Australian Research Council –ARC Dementia Research Development Fellowship (ID 1107247). Dr L. Mowszowski is supported by a NHMRC –Australian Research Council Dementia Research Development Fellowship (ID 1109618).