
Abstract
Background:
Down syndrome (DS) is associated with increased risk for Alzheimer’s disease (AD). In neurotypical individuals, clinical AD is preceded by reduced resting state functional connectivity in the default mode network (DMN), but it is unknown whether changes in DMN connectivity predict clinical onset of AD in DS.
Objective:
Does lower DMN functional connectivity predict clinical onset of AD and cognitive decline in people with DS?
Methods:
Resting state functional MRI (rsfMRI), longitudinal neuropsychological, and clinical assessment data were collected on 15 nondemented people with DS (mean age = 51.66 years, SD = 5.34 years, range = 42-59 years) over four years, during which 4 transitioned to dementia. Amyloid-β (Aβ) PET data were acquired on 13 of the 15 participants. Resting state fMRI, neuropsychological, and clinical assessment data were also acquired on an independent, slightly younger unimpaired sample of 14 nondemented people with DS (mean age = 44.63 years, SD = 7.99 years, range = 38–61 years).
Results:
Lower functional connectivity between long-range but not short-range DMN regions predicts AD diagnosis and cognitive decline in people with DS. Aβ accumulation in the inferior parietal cortex is associated with lower regional DMN functional connectivity.
Conclusion:
Reduction of long-range DMN connectivity is a potential biomarker for AD in people with DS that precedes and predicts clinical conversion.
Keywords
INTRODUCTION
Down syndrome (DS), also known as trisomy 21, is one of the most common causes of intellectual disability. Approximately 6,000 infants with DS are born each year in the US, accounting for 1 in 700 births [1]. In the past 30 years, life expectancy for people with DS has increased from 25 to 60 years of age largely due to improved medical care for children and adults with DS [2, 3]. However, aging presents challenges to people with DS. In particular, they experience increased accumulation of Alzheimer’s disease (AD) neuropathology driven by overexpression of amyloid-β (Aβ) protein precursor, the gene for which is located on chromosome 21. AD pathology progresses in an age-dependent manner in this population. By age 40, virtually all people with DS have accumulated sufficient Aβ plaques and neurofibrillary tangles to be given a neuropathological diagnosis of AD [4, 5]. The prevalence of dementia is greater than 50%in people with DS age 55 and older [6]. However, at least 20%of people with DS live into their 60s without developing dementia [7, 8].
The strong age-dependent progression of AD pathology in people with DS makes biomarker discovery in this population particularly feasible. Participants can be studied longitudinally across a well-defined ∼15-year gap that can capture both the appearance of AD pathology and the initial onset of clinical symptoms, which allows for more precise tracking of neurobiological changes preceding AD-related cognitive decline. Additionally, AD is more predictable in DS than in the general population, though it is not as deterministic as autosomal dominant AD. However, DS is more common than familial forms of AD, and therefore AD-DS represents a major public health problem in its own right [9, 10]. Although AD-DS overlaps with neurotypical AD, the two diseases have distinct etiologies, underscoring the need to study how preclinical and clinical AD manifests in people with DS in ways that may differ from sporadic AD.
The default mode network (DMN) comprises several brain regions that are intrinsically functionally connected at rest in healthy individuals [11]. The medial prefrontal cortex (mPFC), posterior cingulate cortex (PCC), and precuneus are the most commonly identified regions within the DMN [11]. However, the retrosplenial cortex (RSC) [12], angular gyrus [13], and anterior cingulate cortex (ACC) [14] are frequently included in the DMN as well. The DMN is vulnerable to age- and AD-related pathology in neurotypical individuals [11, 16]. This appears to be the case in DS as well. Compared to age-matched neurotypical controls, people with DS (age range = 19–56 years) had increased functional connectivity between networks (i.e., between the DMN and the limbic network) as well as within networks (i.e., within the DMN) [9, 17], indicating that atypical development may cause inherent differences in DMN functional connectivity in DS. Further exploration of within-network connectivity in the DMN revealed greater functional connectivity between anterior DMN regions but lower functional connectivity between anterior-posterior DMN regions in people with DS [18]. However, when comparing within DS, PiB-positive individuals had decreased functional connectivity within the DMN relative to PiB-negative individuals, suggesting that reduced DMN functional connectivity can serve as a biomarker of AD pathology in people with DS and is not explained by developmental differences caused by DS [9]. It is important to note that PiB-positivity alone is not sufficient to predict dementia in people with DS. It is still unknown whether DMN functional connectivity is a useful biomarker of clinical onset of AD in DS.
In this two-cohort study, we hypothesized that lower DMN resting state functional connectivity predicted conversion to dementia in people with DS. In addition, we investigated whether lower DMN functional connectivity was associated with greater cognitive decline as measured by longitudinal neuropsychological assessments and greater regional Aβ burden as measured using PET. Finally, we investigated whether lower DMN functional connectivity was age-related or whether it was related to the clinical onset of AD.
MATERIALS AND METHODS
Participant characteristics
Two cohorts were included in the study. Research procedures were carried out in accordance with the Declaration of Helsinski, and Institutional Review Board approval was obtained at the two participating institutions, the University of California, Irvine (UCI) and the University of Kentucky (UKY). Informed consent/assent was obtained from all participants and their legal representatives prior to enrollment in the study. The first cohort consisted of 22 nondemented people with DS recruited at UCI. Participants received an MRI scan. Four participants ended their MRI scan session early and a resting state functional MRI (rsfMRI) scan was not acquired for them. One participant was excluded because their rsfMRI scan was corrupted and unusable. Finally, two participants were excluded due to excess motion in the scanner (see MRI Image Preprocessing). The remaining 15 people with DS (7 female, mean age = 51.66 years, SD = 5.34 years, range = 42–59 years) comprise the final UCI sample included in the MRI imaging analyses. Thirteen participants received a florbetapir (18F-AV-45) Aβ PET scan nine months before their MRI scan, on average. The remaining two participants received instead a Pittsburgh compound B Aβ PET scan and were excluded from the PET analysis. Participants were clinically evaluated every nine months for up to four years following the baseline MRI scan. During the study, four of the 15 participants transitioned to dementia based on clinical impressions evaluations. Importantly, one of those four participants transitioned to dementia two months before their MRI scan. Considering the limited availability of neuroimaging data in this population, this participant was included in the analyses. However, prospective neuroimaging biomarker studies should ideally only include participants who are cognitively normal at baseline so that any changes observed in the data can be confirmed to be preclinical in nature.
The second cohort consisted of 15 nondemented people with DS who were recruited for a longitudinal study of aging and AD at UKY. Participants received an MRI scan. One participant was excluded because they had a severe traumatic brain injury and possible mosaic DS. No participants needed to be excluded due to excessive motion. The remaining 14 people with DS (9 female, mean age = 44.63 years, SD = 7.99 years, range = 38–61 years) comprise the final UKY sample included in the MRI imaging analysis. No PET data were acquired for UKY participants. Participants were clinically evaluated annually for up to 10 years. During the study, none of the 14 participants transitioned to dementia based on clinical evaluations.
Diagnosis of transition to dementia
For UCI participants, dementia was diagnosed in accordance with ICD-10 and DSM-IV-TR [19, 20]. Transition classification followed comprehensive baseline and longitudinal assessments including history, neurological examination, and consideration of previous studies in the medical record. Transition to dementia was decided at a consensus conference by three neurologists as well as the neuropsychologist who administered the cognitive assessments for the given participant. They were blinded to the MRI scans, PET scans, and neuropsychological assessments. Participants with confounding conditions, such as sensory deficit, untreated thyroid dysfunction, and major depression, that might mimic the symptoms of dementia, were excluded. See the Supplementary Material S2 of [21] for clinical vignettes describing transition symptoms of individual participants. For transitioned participants, the transition times corresponded to the clinical visit at which a new diagnosis was given. The diagnosis of dementia was confirmed at subsequent visits for the transitioned participants, while the non-transitioned participants were confirmed to be cognitively stable.
For each UKY participant, an expert consensus review determined dementia diagnosis. The NINCDS-ADRDA criteria for dementia [22] were used. Diagnosis was determined through consensus review by three neurologists, one neuropsychologist, and one psychologist. All data from medical history, medical and neurologic examinations, laboratory tests, mental status measures, and informant report of any changes in functional status and activities of daily living were used for dementia determination.
Neuropsychological assessments
To evaluate cognitive changes in the UCI participants over time, the Rapid Assessment for Developmental Disabilities (RADD) [23], Severe Impairment Battery (SIB) [24], Fuld Object Memory Evaluation (FOME) [25], Dementia Questionnaire for People with Learning Disabilities (DLD), formerly known as Dementia Questionnaire for Persons with Mental Retardation, Sum of Cognitive Scores (SCS), and Sum of Social Scores (SOS) [27] neuropsychological assessments were collected at baseline, nine, 18, and 27 months on participants completing the study. All 15 participants had at least two visits (i.e. baseline and nine months), with some participants completing a maximum of four visits. The RADD assesses language, orientation/attention, short-term memory, general knowledge, arithmetic, and sensorimotor function. The SIB assesses social interaction, short-term memory, orientation/attention, language/reading, general knowledge, and praxis/construction. The FOME assesses naming skills, learning, and short-term memory. The DLD-SCS assesses short-term memory, long-term memory, and spatial and temporal orientation, and the DLD-SOS assesses speech, practical skills, mood, activity and interest, and behavioral disturbance.
The UKY participants completed the SIB, the DLD-SCS and DLD-SOS, as well as the Brief Praxis Test (BPT) [27], which assesses the planning and executing of new motor actions.
MRI image acquisition
For the UCI cohort, MRI data were collected using a 3 Tesla Philips Achieva scanner at the baseline visit. RsfMRI data were obtained using a T2* weighted gradient echo echo planar imaging (EPI) sequence. 200 volumes were acquired in 48 slices with 3.3 mm slice thickness, 3.3 mm isotropic voxels, and the following parameters: TR = 3000 ms, TE = 30 ms, FA = 80°, FOV = 198.75×158.88×212 mm, matrix size = 64×59. The sequence duration was 10 min and 9 s, and participants were instructed to keep their eyes open and fixate on a crosshair. Structural MRI data were obtained using a T1-weighted MPRAGE sequence with the following parameters: TR =6.765 ms, TE = 3.19 ms, FA = 9°, FOV = 252.295×270×204 mm, voxel resolution = 0.94×0.94×1.20 mm.
For the UKY cohort, MRI data were collected using a 3 Tesla Siemens TIM scanner at the baseline visit. rsfMRI data were obtained using a T2* weighted gradient echo EPI sequence. 182 volumes were acquired in 38 slices with 3.5 mm slice thickness, 3.5 mm isotropic voxels, and the following parameters: TR = 2190 ms, TE = 27 ms, FA = 77°, FOV = 224×224×224 mm, matrix size = 64×64. The sequence duration was 6 min and 43 s, and participants were instructed to keep their eyes open during the scan, though they were not shown a fixation cross. Structural MRI data were obtained using a T1-weighted MPRAGE sequence with the following parameters: TR = 2530 ms, TE = 2.26 ms, FA = 7°, FOV = 256×256×256 mm, voxel resolution = 1×1×1 mm.
MRI image preprocessing
All neuroimaging data were preprocessed using Analysis of Functional NeuroImages (version 19.2.26) [28] on GNU/Linux and Mac OSX platforms. UCI and UKY MRI data were preprocessed separately to account for their specific scanning parameters. The standardized afni_proc.py pipeline was used with some minor changes. EPIs were despiked (3dDespike), corrected for slice timing (3dTshift) and motion (3dvolreg), aligned to each subject’s skull-stripped MPRAGE (align_epi_anat.py), masked to exclude voxels outside the brain (3dautomask), and smoothed (3dmerge) using a 2 mm FWHM Gaussian kernel. Motion correction parameters were saved into text files for later use in linear regression (see Data analysis). Advanced Normalization Tools [29] non-linear registration (antsRegistrationSyN.sh) was used to warp each participant’s MPRAGE into the Desikan-Killiany FreeSurfer atlas [30] that was warped to Montreal Neurological Institute (MNI) space. The parameters from these warps were used to warp each participant’s EPI to the template space (WarpImageMultiTransform) for group region of interest (ROI) analyses (see Data analysis).
Extraction of the functional correlations in hemodynamic signals was done using the following as regressors: bandpass filtering between 0.01 and 0.1 Hz, six motion vectors (x, y, z, pitch, roll, yaw) and their derivatives, and first-, second-, third-, and fourth-order polynomials to model temporal drift (3dDeconvolve). Volumes with motion exceeding 1 mm of Euclidean norm displacement were censored from analyses as well as the immediately preceding TRs. Additionally, global signal from ventricles and white matter was excluded from gray matter voxels using ANATICOR [31].
The motion censor threshold used was less conservative than the threshold typically used in standard rsfMRI preprocessing pipelines [32]. People with DS are known to move more during scanning, and this effect is compounded by age and preclinical disease [33]. A more liberal threshold was chosen to conserve as much data as possible from this special population on whom limited data are available. Motion, both before and after censoring, did not differ between UCI transitioned and non-transitioned participants (Supplementary Figure 1).
PET image acquisition and processing
18F-AV-45 PET scans were acquired for 13 of the 15 UCI participants on a High Resolution Research Tomograph (orientation = axial, voxel size = 1.2mm3, matrix size = 256×256×207, reconstruction = OP-OSEM3D). Image acquisition followed the Alzheimer’s Disease Neuroimaging Initiative [34] protocol: 4×5-min frames collected 50–70 min after injection. PET reconstructions were performed with attenuation and scatter correction. Image processing followed the methods described in [35], briefly consisting of PET frame realignment and averaging prior to co-registration with their respective MRI scans. ROIs were defined by the Desikan-Killiany atlas and computed using FreeSurfer (FS6 version 6.0; RRID:SCR_001847). The following six Desikan-Killiany ROIs were used as seeds for the six DMN regions: medial orbitofrontal cortex (mOFC), which covers the same anatomical area as the mPFC; ACC, which was created by combining the rostral ACC and caudal ACC ROIs; PCC; isthmus of the cingulate cortex (ICC), also known as the RSC; precuneus; and inferior parietal cortex (IPC), also known as the angular gyrus. Left and right ROIs were averaged to create bilateral ROIs. MRI-derived voxel-weighted standard uptake value ratio (SUVR) averages for each ROI were computed using the cerebellum-cortex reference region. Partial volume corrected SUVR averages were then computed using PETSurfer [36, 37].
Data analysis
ROI-based functional connectivity analysis was performed using Analysis of Functional NeuroImages [23] for both the UCI and the UKY cohorts. The same six bilateral ROIs used in the PET analysis were used for the functional connectivity analysis to detect concurrent Aβ pathology and altered functional connectivity. Time courses were extracted from each ROI (3dmaskave). Pearson correlation coefficients between the residual BOLD time-series of each seed ROI and that of each remaining ROI were calculated (3dTcorr1D) then normalized using the Fisher z-transformation, resulting in a correlation map for each participant.
All statistical tests were conducted in R (version 3.6.1). Results were corrected for multiple comparisons using the false discovery rate (FDR) at p < 0.05 level of significance. Longitudinal change in neuropsychological measures was calculated for each UCI participant, resulting in a slope that represents the annual change in score. One participant had missing data at one intermediate visit for three of the measures (RADD, SIB, and FOME). These missing data were interpolated based on the participant’s scores for these measures from the visits preceding and following the missing visit.
To evaluate the predictive value of baseline DMN functional connectivity on dementia transition in the UCI cohort, decision tree classifiers were trained using scikit-learn, a Python machine learning library. Two-fold stratified cross validation was performed.
RESULTS
Demographic and neuropsychological data
The UCI transitioned and non-transitioned groups did not differ in mean age at scan, sex, or baseline neuropsychological assessments (Table 1). However, the transitioned group participants had more visits on average (t(13) = 2.2647, p = 0.041). The UCI participants, combined across transitioned and non-transitioned groups, were significantly older than the UKY participants (t(22) = 2.7665, p = 0.011) (Table 2). The UCI and UKY participants did not differ in sex or baseline neuropsychological assessments.
UCI participant demographics and neuropsychological test scores
APOE ɛ4, apolipoprotein ɛ4 carrier; RADD, Rapid Assessment for Developmental Disabilities; SIB, Severe Impairment Battery; FOME, Fuld Object Memory Evaluation; DLD-SCS, Dementia Questionnaire for People with Learning Disabilities Sum of Cognitive Scores; DLD-SOS, Dementia Questionnaire for People with Learning Disabilities Sum of Social Scores.
UCI and UKY participant demographics and neuropsychological test scores
SIB, Severe Impairment Battery; DLD-SCS, Dementia Questionnaire for People with Learning Disabilities Sum of Cognitive Scores; DLD-SOS, Dementia Questionnaire for People with Learning Disabilities Sum of Social Scores.
Lower long- but not short-range DMN functional connectivity predicts transition to dementia in DS
The UCI transitioned group had significantly lower functional connectivity between several DMN regions relative to the non-transitioned group (Fig. 1A). After correcting for multiple comparisons, three pairs of ROIs remained significant: ACC-IPC (t(9) = 5.1847, FDR p = 0.0085), ACC-ICC (t(7) = 5.4292, FDR p = 0.0092), and ACC-Precuneus (t(8) = 3.4535, FDR p = 0.0474) (Supplementary Table 1). All three of these pairs represent connections between distal DMN regions. In contrast, there were no significant group differences in functional connectivity between proximal DMN regions. Motion does not explain group differences in functional connectivity (Supplementary Figure 2). The distributions of pairwise functional connectivity for both groups are shown in Fig. 1B and 1C.
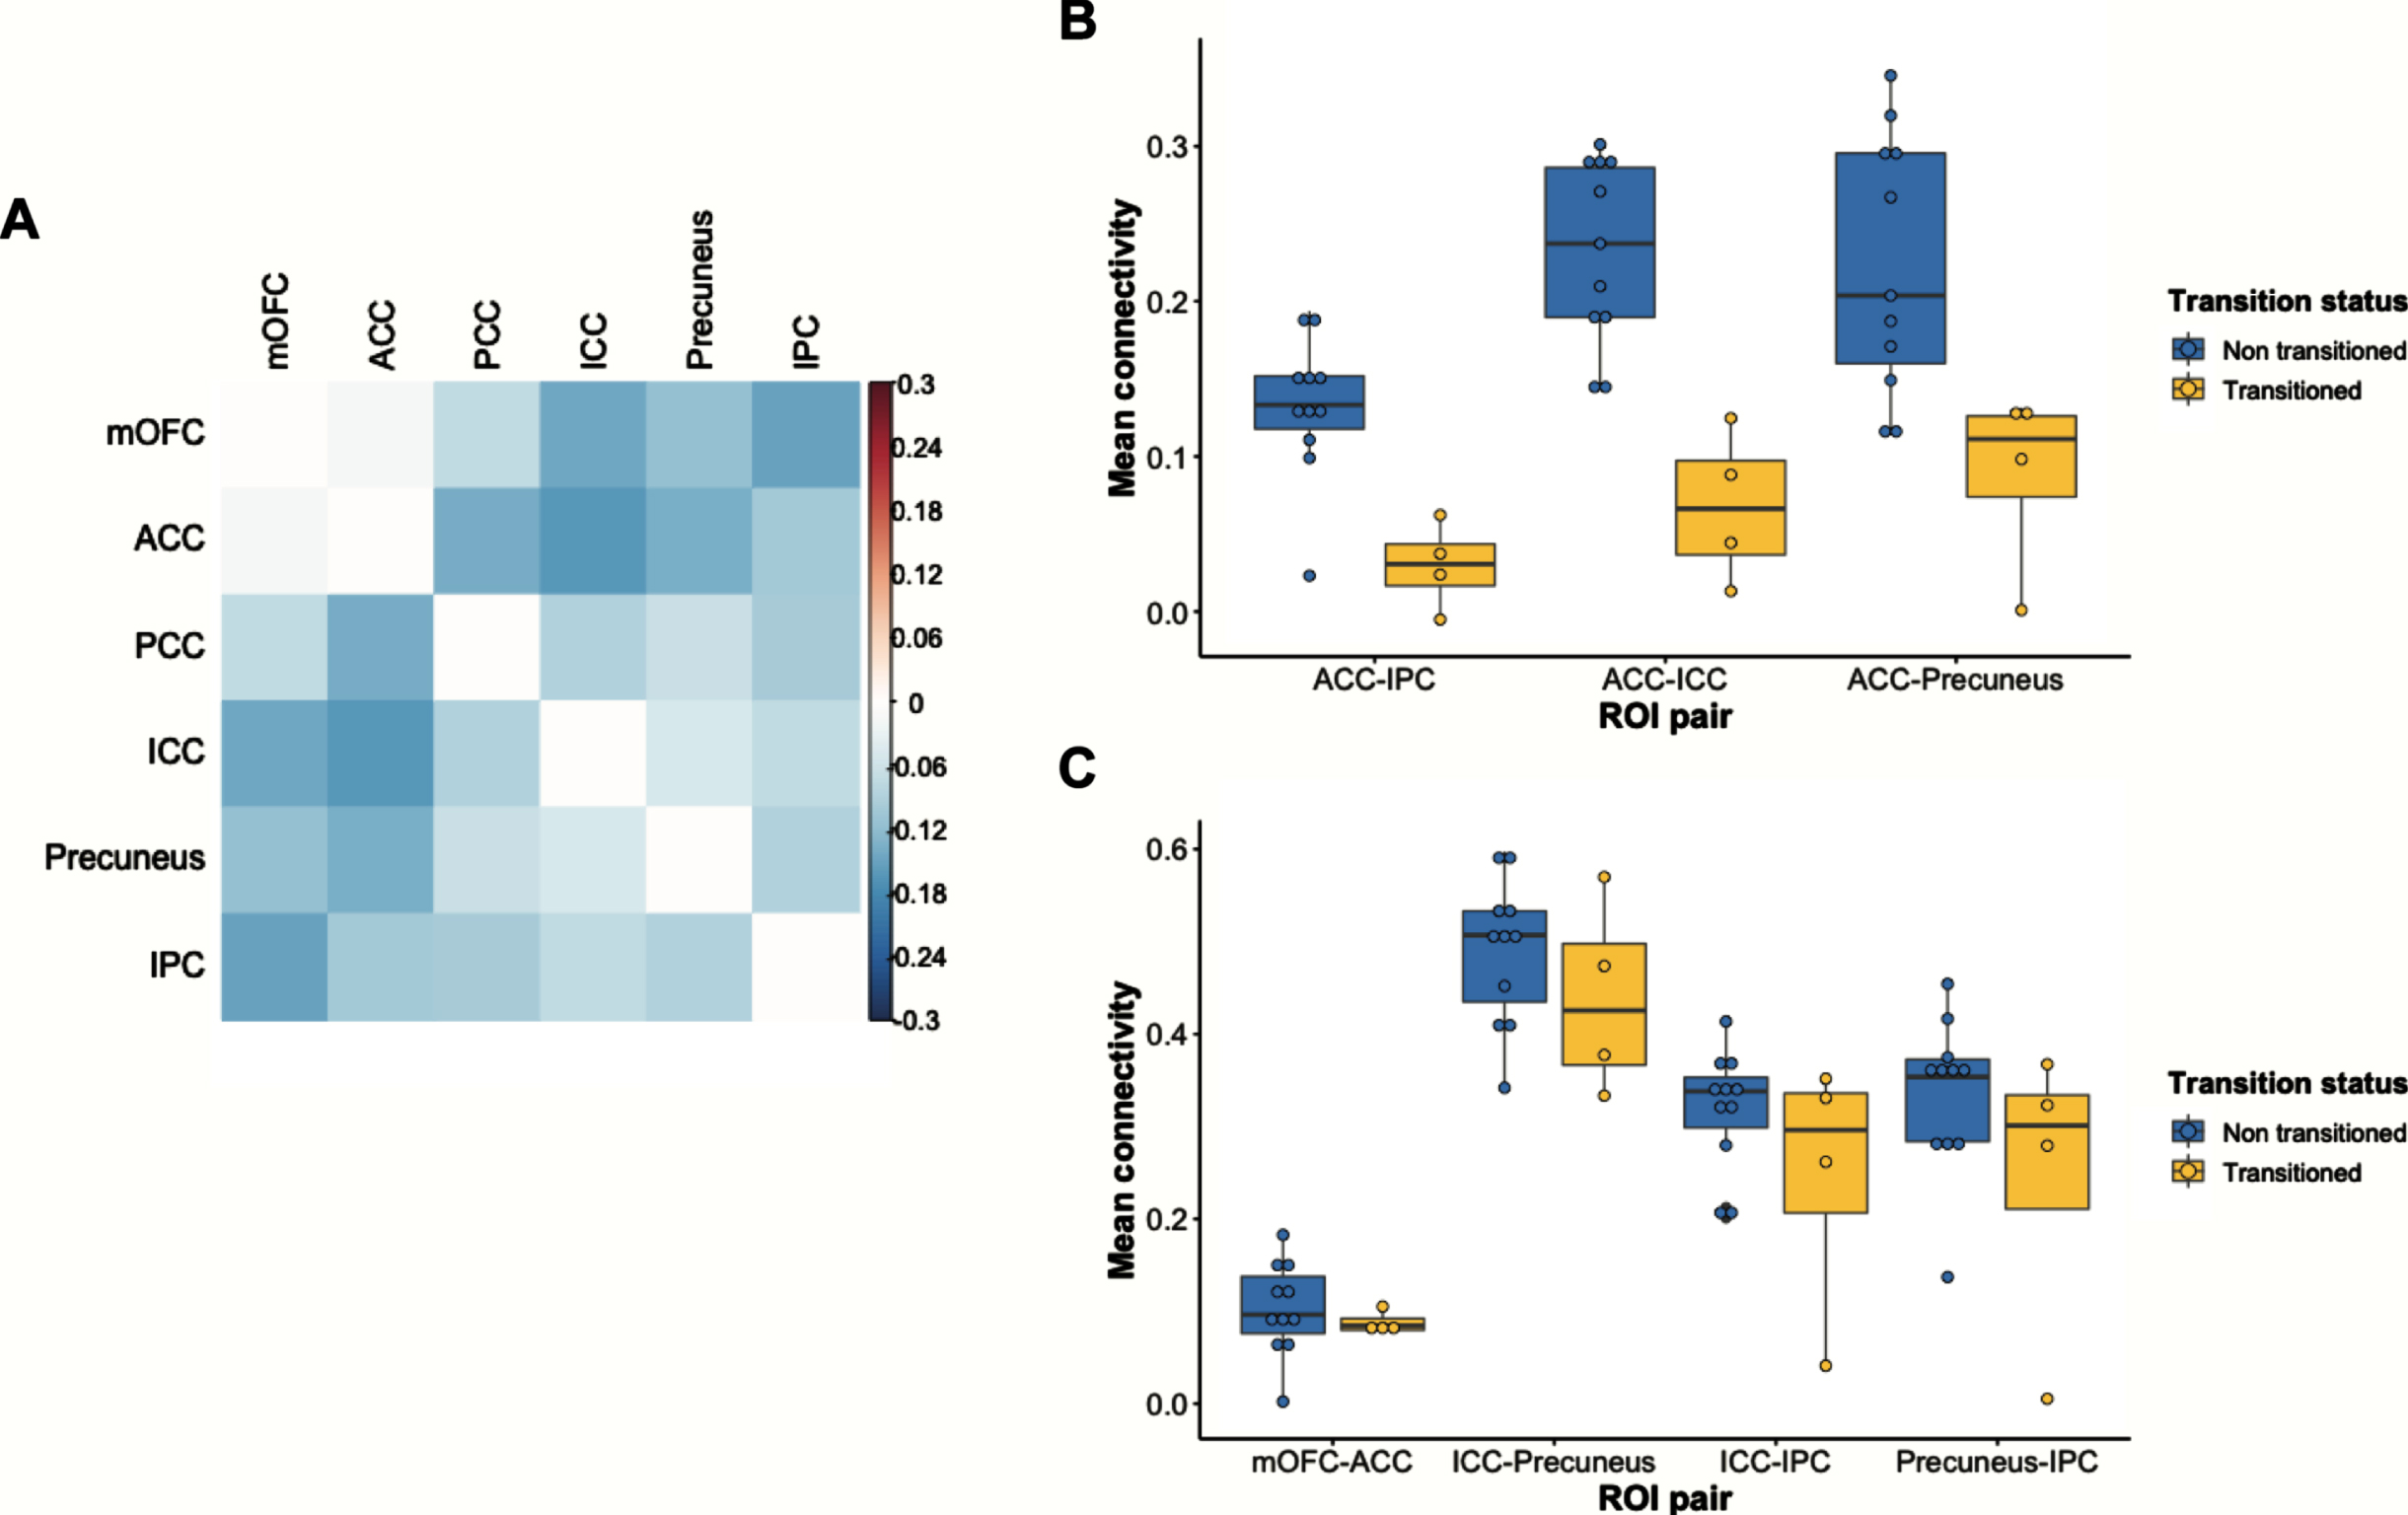
Differences in DMN functional connectivity between the UCI transitioned and non-transitioned groups. A) Correlation matrix showing reduced DMN functional connectivity in the transitioned group. Values represented in the matrix are Fisher’s z transformed Pearson correlation coefficients between two ROIs. Warmer colors indicate ROI pairs with greater connectivity in the transitioned group, and cooler colors indicate ROI pairs with lower connectivity in the transitioned group. B) Those in the transitioned group have reduced functional connectivity between ACC-IPC, ACC-ICC, and ACC-Precuneus. C) There are no group differences in functional connectivity between short-range pairs of ROIs. ACC, anterior cingulate cortex; ICC, isthmus cingulate cortex; IPC, inferior parietal cortex; mOFC, medial orbitofrontal cortex; PCC, posterior cingulate cortex.
Lower long-range DMN functional connectivity predicts steeper longitudinal cognitive decline in DS
Functional connectivity between ROI pairs that predicted clinical onset of AD in the UCI cohort was significantly associated with longitudinal cognitive decline after adjusting for age and sex. Specifically, lower functional connectivity between ACC-IPC and between ACC-ICC was associated with steeper decline in performance on the SIB across all UCI participants (F(1, 13) = 7.728, p = 0.0156, and F(1, 13) = 7.215, p = 0.0187, respectively) (Fig. 2). In addition, there was a trending relationship between lower ACC-Precuneus functional connectivity and steeper decline on the SIB (F(1, 13) = 4.455, p = 0.0547) (Fig. 2). Additional significant and trending relationships are reported in the Supplementary Material, all of which involve long-range pairs of DMN regions (Supplementary Figures 3 and 4). There was no association between baseline cognition and DMN functional connectivity with one exception. Greater PCC-IPC connectivity was associated with worse performance on the DLD-SOS at baseline, but this association did not differ based on transition status (Supplementary Table 2).
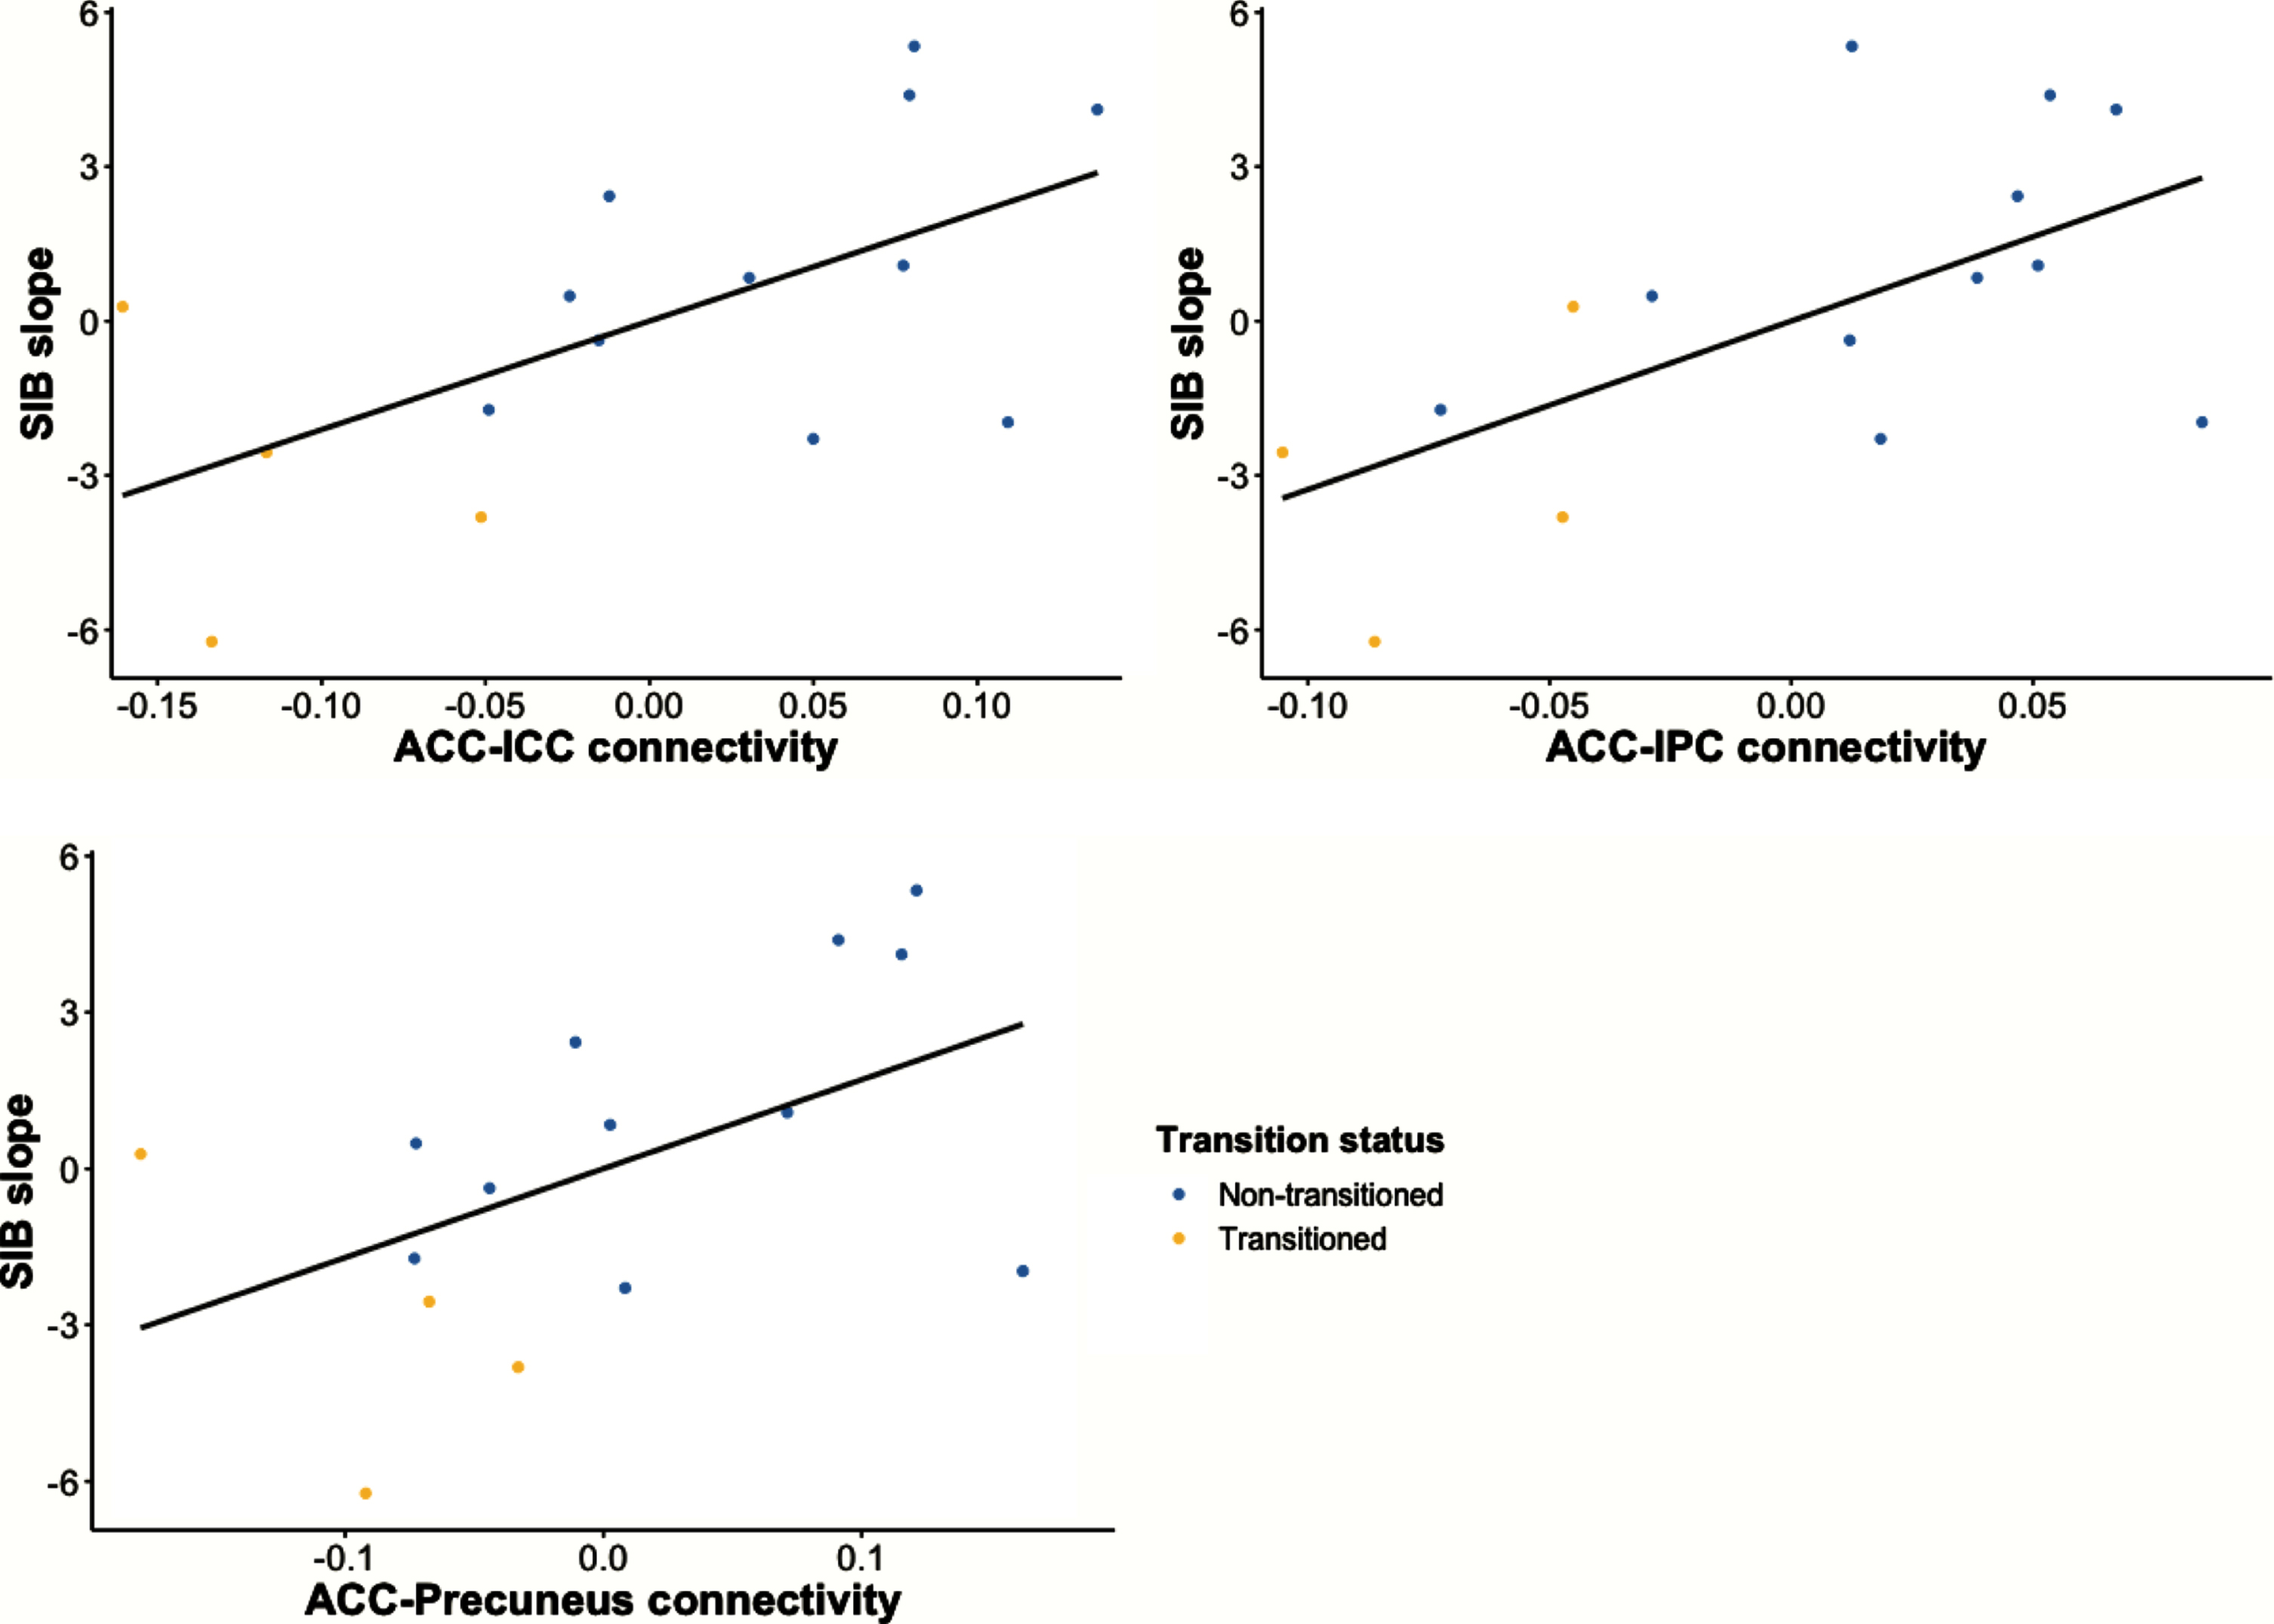
Reduced long-range functional connectivity is associated with greater cognitive decline in UCI cohort, as indicated by steeper decline in SIB score during follow-up. ACC, anterior cingulate cortex; ICC, isthmus cingulate cortex; IPC, inferior parietal cortex; SIB, Severe Impairment Battery.
Lower long-range DMN functional connectivity associated with greater regional Aβ accumulation in inferior parietal cortex
IPC SUVR was negatively associated with functional connectivity between ACC-IPC in the UCI cohort (r = –0.5911, p = 0.0334) (Fig. 3). There was a marginally significant negative relationship between IPC SUVR and mOFC-IPC functional connectivity (r = –0.5442, p = 0.0545). ACC SUVR was not associated with ACC-IPC functional connectivity (r = –0.3843, p = 0.1949), nor was mOFC SUVR associated with mOFC-IPC functional connectivity (r = –0.3150, p = 0.2946). Regional SUVR averages for each group are reported in Supplementary Table 3.
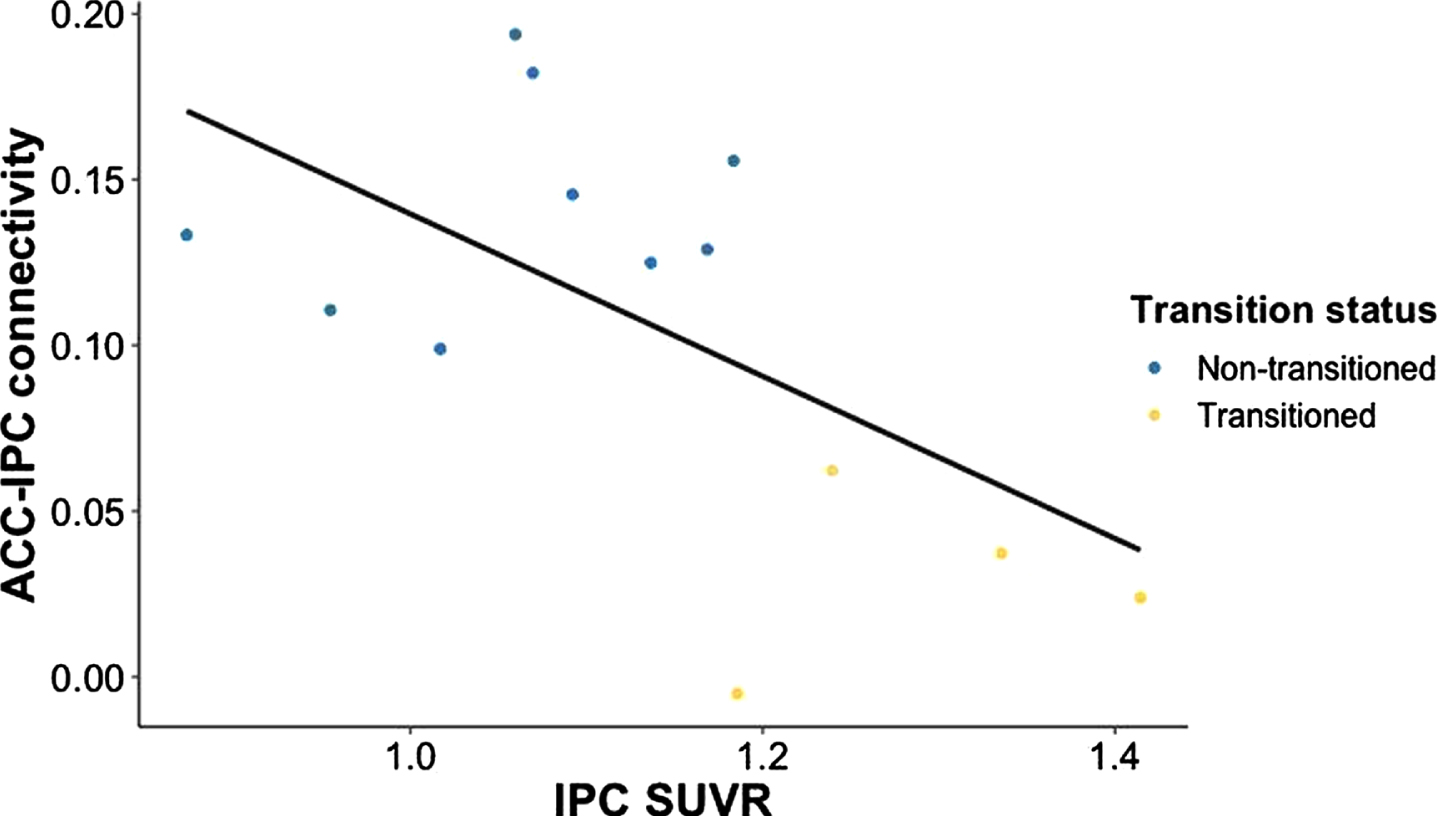
In the UCI cohort, reduced functional connectivity between ACC-IPC is associated with greater Aβ accumulation in IPC, as indicated by greater IPC SUVR. ACC, anterior cingulate cortex; IPC, inferior parietal cortex; SUVR, standardized uptake value ratio.
Lower long-range DMN functional connectivity is not explained by age differences
DMN functional connectivity in two cohorts that differed in participant age were compared, with the UKY cohort being significantly younger than the UCI cohort (Table 2). For long-range functional connectivity, UCI transitioned participants fell outside of the distribution of the UKY participants, but UCI non-transitioned participants fell primarily within the UKY distribution (Fig. 4A, Supplementary Tables 4 and 5). However, for short-range functional connectivity, both transitioned and non-transitioned participants fell within the UKY distribution (Fig. 4B, Supplementary Tables 4 and 5).
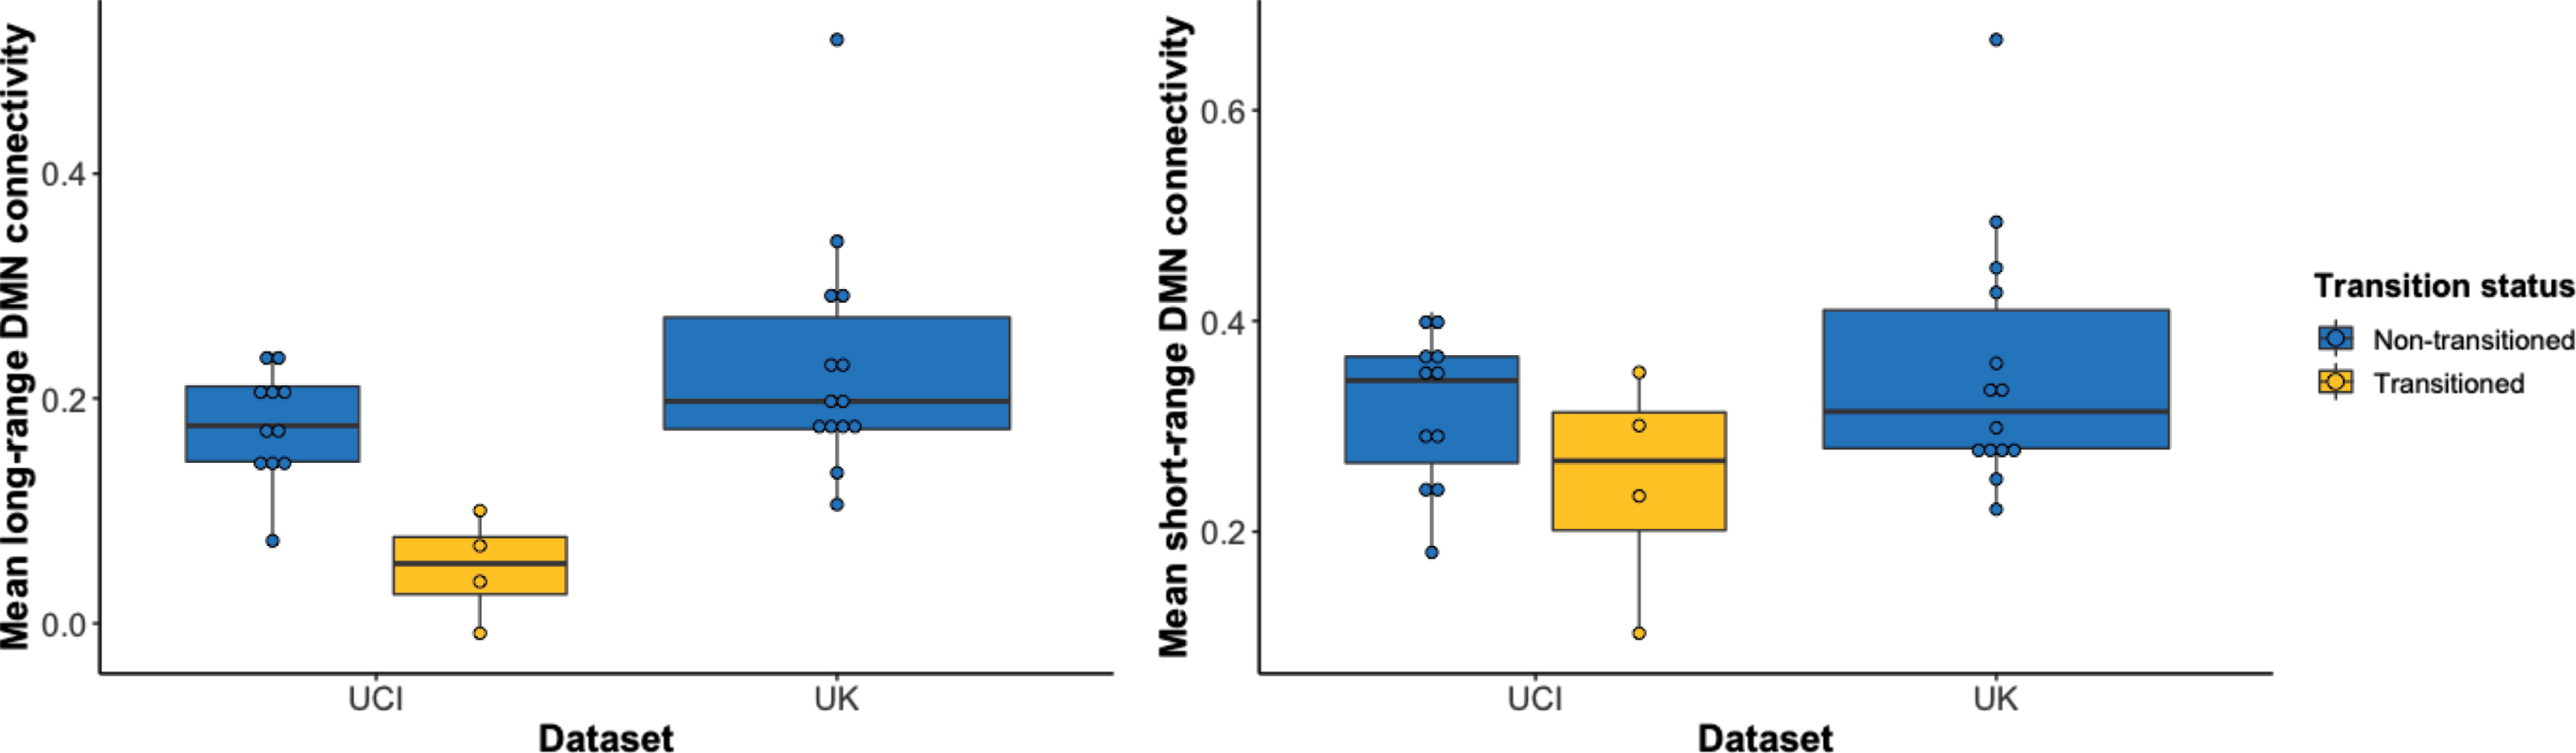
Distribution of mean functional connectivity values separated by dataset and transition status. A) Long-range DMN functional connectivity values of those in the transitioned group fall outside the distributions of the non-transitioned group and the younger UKY cohort. However, the non-transitioned group falls within the UKY cohort’s distribution of functional connectivity values. B) Short-range DMN functional connectivity values of those in the transitioned group fall within the distributions of the non-transitioned group and the younger UKY cohort. DMN, default mode network.
Classification of future transition to dementia using long-range DMN functional connectivity
We evaluated whether the trained decision tree classifiers could discriminate between UCI participants who transitioned to dementia and UCI participants who remained cognitively stable using the three long-range DMN pairs individually as well as combined in one model (Table 3). We found that functional connectivity between all three pairs (ACC-IPC, ACC-ICC, ACC-Precuneus) performed reasonably well across all four metrics (i.e., sensitivity, specificity, accuracy, area under the receiver operating characteristic [AUC]) when evaluated individually (AUC = 0.79–0.96). Classifier performance was comparable when these three variables were evaluated together (AUC = 0.79), and after the linear effects of age were removed, the combined model performance improved across all metrics (AUC = 0.83) (Table 3, Fig. 5).
Decision tree classifier results
ACC, anterior cingulate cortex; AUC, area under the receiver operating characteristic curve; ICC, isthmus cingulate cortex; IPC, inferior parietal cortex.
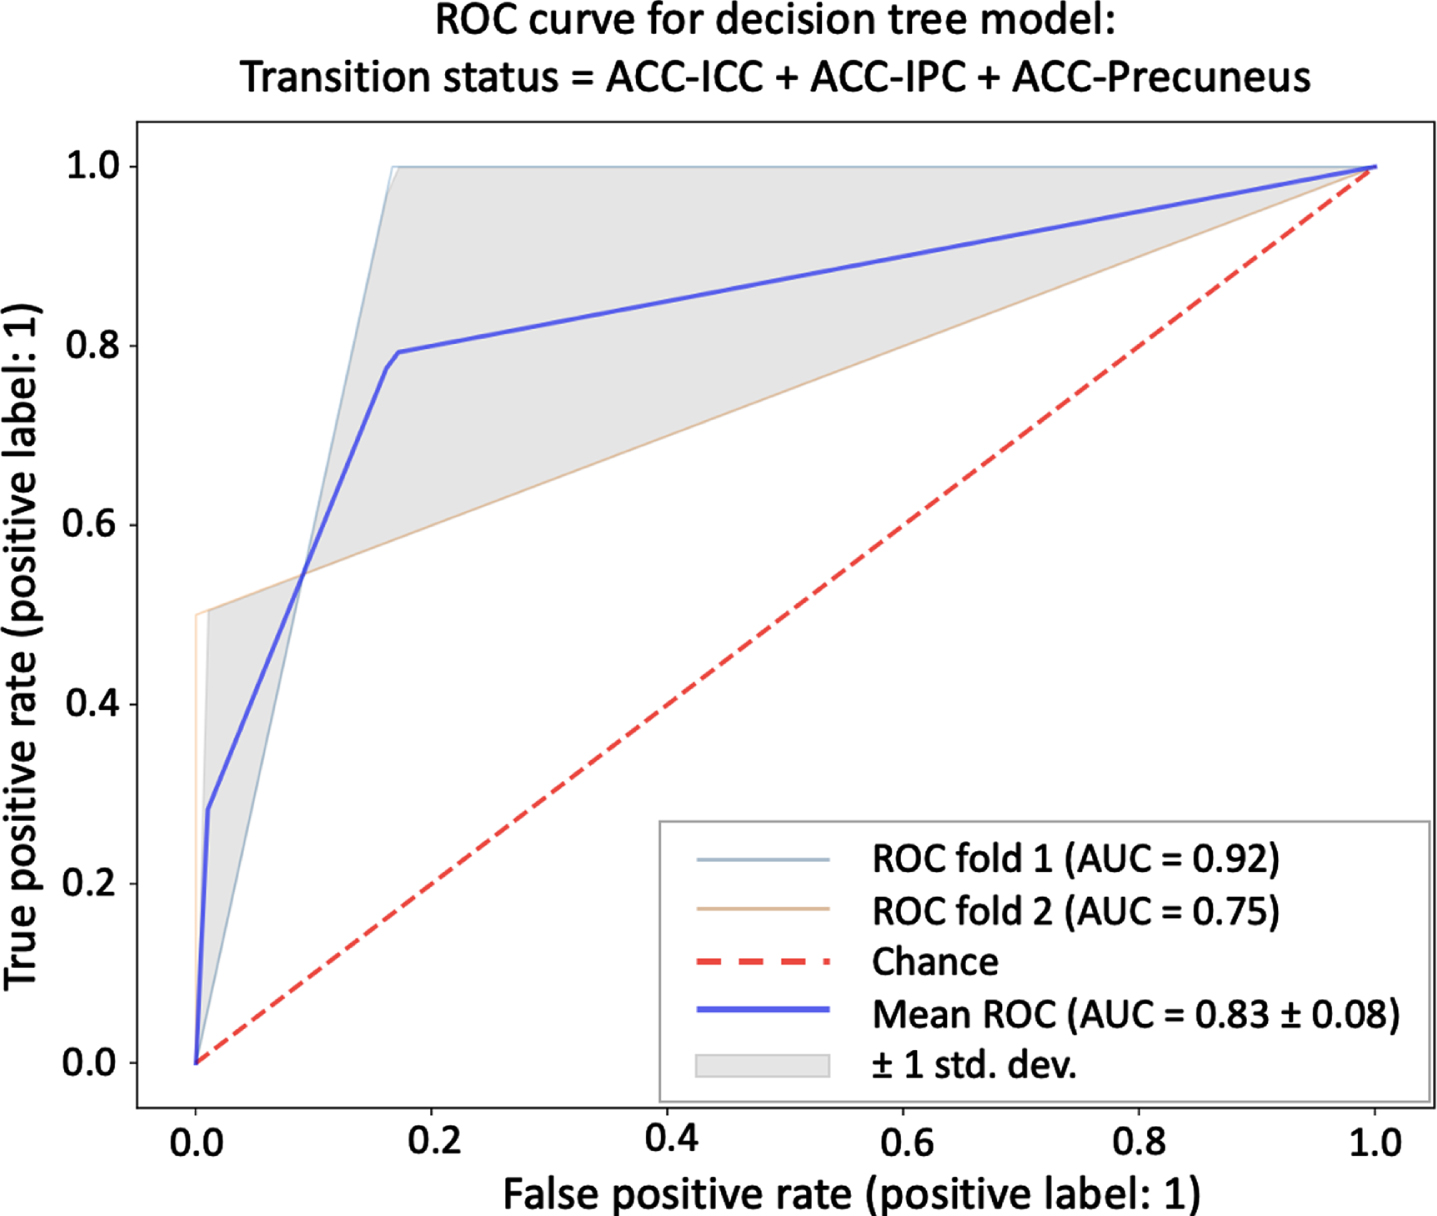
Mean ROC curve for a decision tree classifier model that includes all three long-range DMN pairs (ACC-ICC, ACC-IPC, ACC-Precuneus) as independent variables as well as age as a nuisance variable. AUC, area under the receiver operating characteristic curve; ACC, anterior cingulate cortex; ICC, isthmus cingulate cortex; IPC, inferior parietal cortex; ROC, receiver operating characteristic curve.
DISCUSSION
The present study investigated whether preclinical changes to resting state functional connectivity within the DMN predict future conversion to dementia in people with DS. Lower connectivity between long-range but not short-range pairs of DMN regions predicts clinical onset of dementia, predicts steeper cognitive decline, and is associated with greater regional Aβ accumulation in the IPC. People with DS who did not transition to dementia had maintained long-range DMN connectivity relative to a younger group of cognitively stable people with DS. This lack of difference in long-range DMN functional connectivity in older versus younger nondemented individuals with DS supports our interpretation that the lower long-range DMN connectivity in AD-DS transitioners is associated with AD and not aging. Though it must be noted that the older and younger DS cohort imaging data were collected on two different scanners, and these findings thus warrant replication in a study that adequately controls for possible data acquisition confounds.
An ideal AD biomarker is a specific, measurable indicator that AD is present and is detectable prior to symptom onset. Results from the present study demonstrate that loss of long-range DMN functional connectivity precedes clinical onset of AD and global cognitive decline in people with DS. The results are generally consistent with previous studies in neurotypical older adults at risk for AD showing reduced DMN functional connectivity [38–41]. However, one study reported increased connectivity between anterior and posterior DMN in individuals with sporadic AD [42]. This lack of agreement could reflect dynamic changes in long-range DMN connectivity depending on disease stage and may highlight divergence in AD-DS compared to sporadic AD. Given that lower functional connectivity between anterior-posterior DMN regions has previously been observed in nondemented individuals with DS relative to age-matched neurotypical controls [18], the findings suggest that AD further lowers long-range DMN functional connectivity beyond its inherent level, supporting the potential use of reduced long-range DMN functional connectivity as a unique biomarker of AD-DS. Identification of preclinical brain changes that precede AD enables more sensitive detection of AD in its earlier stages [43]. In the present study, reductions in long-range DMN connectivity are observable at least one year prior to clinical diagnosis. It is possible these changes could be detected earlier in a larger longitudinal study. Lowered long-range functional connectivity could be considered a particularly informative biomarker relative to Aβ aggregation since Aβ levels are elevated in almost all people with DS.
The finding that loss of ACC-IPC connectivity is associated with greater Aβ PET SUVR in the IPC is in line with previous work showing that Aβ accumulation in DS mirrors findings in sporadic AD, affecting frontal, temporal, parietal, and cingulate cortices, and precuneus, though binding in the striatum is unique to DS and familial AD [3, 45]. Increased Aβ is also associated with regional hypometabolism [44, 46] and reduced memory and executive functioning [3, 35]. In the present study, the SUVRs in all of the DMN regions studied, with the exception of the IPC, were elevated for participants in both groups, greater than the standard SUVR threshold of 1.1 for Aβ positivity [47]. This suggests that Aβ accumulation in the DMN occurs at an earlier preclinical stage than changes to resting state functional connectivity. Importantly prior studies have shown that the spatial distribution of Aβ, rather than Aβ positivity, is a useful predictor of conversion to AD [35].
It was not surprising that the participants in the UKY cohort remained cognitively stable during follow-up due to the strong connection between age and AD pathology in people with DS. The estimated age of dementia onset is between 48 and 56 years of age [7], and all but three UKY participants were between 38 and 46 years of age at the time of their baseline scan. However, the reported prevalence of dementia by age group varies considerably: 0–33%for 30–39 years of age, 5.7–55%for 40–49 years of age, 4–55%for 50–59 years of age, and 15–77%for 60 or more years of age [7]. This variability could explain why the remaining UKY participants, two of whom were at least 60 years of age at baseline, remained cognitively stable, consistent with the observation that roughly 20%of people with Down syndrome do not develop dementia at any age [7]. Nevertheless, it is possible that some participants transitioned to dementia outside of the follow-up window.
It is frequently reported that canonical resting state networks such as the DMN can be reliably detected at the group level with a scan as short as 5 min [48–50]. In the present study, after censoring volumes with excessive motion, the UCI participants had an average of 175 volumes of usable scan data (range: 122–200) using a 3-s TR, which is in line with convention and should capture a stable estimate of the DMN. Sampling at a faster rate and having a greater number of timepoints would provide even greater confidence in this regard, but given that this study was performed in a highly-sensitive clinical population, there are practical limitations to the length of a resting state scan that can be collected. DS participants underwent additional scan sequences during their MRI visit (i.e., DTI, T2 FLAIR, etc.) totaling 45-60 min of scanning as part of a larger study. A longer scan would have constituted an undue burden on the participants due to the loud and uncomfortable nature of being scanned.
Although long-range DMN functional connectivity performed decently well overall in distinguishing those who eventually transitioned to dementia from those who remained cognitively stable, the specificity of the classifier could be improved by adding in other known predictors of AD transition in DS, such as PET SUVRs in frontal, parietal, and cingulate regions [21]. A caveat of using this approach with a small sample is that the training and test sets are small as a consequence. It would be important for future studies with larger samples to employ machine learning classifiers and generate ROC curves and related binary classification metrics to evaluate the utility of long-range DMN functional connectivity reduction as a stand-alone predictive imaging biomarker against a composite biomarker with long-range DMN functional connectivity as one component. As sample size increases, more k-fold cross-validations may be performed, which will reduce the bias toward estimating the generalization error.
The small sample size used in this study limits the statistical tests that can be used and the number of variables that can be accounted for during analysis. Additionally, the inclusion of the one participant who transitioned to dementia two months before their MRI scan may have contributed to greater observed group differences in long-range DMN functional connectivity between the UCI transitioned and non-transitioned groups. A sensitivity analysis excluding this participant was performed, and the same pattern of selectively lower long-range DMN functional connectivity was found in the transitioned group (Supplementary Table 6), albeit with a different rank order compared to the original analysis (Supplementary Table 1) and with most of the pairs now trending in significance. The overall pattern remains the same, and the slight differences are likely due to the limited statistical power afforded by the sample size. Because of this, we elected to keep that participant in the analysis. The field recognizes the value of data collected in people in DS, and to address the sample size problem, an NIH-funded multisite consortium called the Alzheimer’s Biomarker Consortium - Down Syndrome was recently established to collect a rich, standardized, longitudinal dataset of several hundred people with DS [51]. This larger dataset will enable replication of the present study as well as additional studies linking intrinsic brain network changes to plasma, CSF, genetic, neuropsychological, and clinical measures sensitive to AD in DS.
It is notoriously difficult to collect high quality neuroimaging data in older people with DS. Inherent characteristics of this population, namely age and developmental disability, lead to increased motion in the scanner, which may render some of the neuroimaging data—particularly the rsfMRI data—unusable [46, 52]. In the present study, a generous motion sensor threshold of 1 mm was used as an exclusion criterion for resting state scan TRs. As discussed in the Methods section, this is well above the recommended threshold of 0.2 mm for resting state fMRI data [32]. Head motion can create spurious yet systematic correlations in fMRI data [52]. However, given the rarity of the dataset, a more lenient threshold was chosen in combination with post-hoc tests to determine the relationship between motion that survived the threshold and the variables of interest. There was no association between participant head motion and pairwise functional connectivity (Supplementary Figure 2). It is possible that this approach did not fully control for motion artifacts, but we are assured by the convergent evidence linking long-range DMN functional connectivity to faster decline in global cognition (Fig. 2) and greater Aβ accumulation (Fig. 3), both of which support the conclusion that lower long-range DMN functional connectivity is associated with progression of clinical AD in people with DS.
One other potential confound could be increased atrophy in posterior DMN regions [53], which may influence activity correlations between regions. It may be important to control for cortical thickness or volume when calculating resting state functional connectivity maps. However, this pattern of posterior-dominant atrophy is also seen in neurotypical individuals with AD, yet brain structure is generally not controlled in resting state analyses of data collected from these individuals. Despite similarities between AD biomarkers found in DS and in neurotypical individuals, there are developmental differences between these two groups that may limit the generalizability of findings in this special population.
Taken together, these findings suggest that disruption to functional connectivity between particular nodes of the DMN can serve as a novel biomarker of AD in DS.
Footnotes
ACKNOWLEDGMENTS
This work was supported in part by R01 HD065160 (ITL) and R01 HD064993 (EH and FAS). NDD’s training was supported by T32 AG000096 (PI: Carl Cotman), U01 AG051412 (PI: ITL), and R01 AG053555 (PI: MAY). We would like to thank all the participants and their families who have contributed their time and energy to advancing Alzheimer’s disease and Down syndrome research.