



Abstract
Background:
Lipid alterations contribute to Alzheimer’s disease (AD) pathogenesis. Lipidomics studies could help systematically characterize such alterations and identify potential biomarkers.
Objective:
To identify lipids associated with mild cognitive impairment and amyloid-β deposition, and to examine lipid correlation patterns within phenotype groups
Methods:
Eighty plasma lipids were measured using mass spectrometry for 1,255 non-demented participants enrolled in the Mayo Clinic Study of Aging. Individual lipids associated with mild cognitive impairment (MCI) were first identified. Correlation network analysis was then performed to identify lipid species with stable correlations across conditions. Finally, differential correlation network analysis was used to determine lipids with altered correlations between phenotype groups, specifically cognitively unimpaired versus MCI, and with elevated brain amyloid versus without.
Results:
Seven lipids were associated with MCI after adjustment for age, sex, and APOE4. Lipid correlation network analysis revealed that lipids from a few species correlated well with each other, demonstrated by subnetworks of these lipids. 177 lipid pairs differently correlated between cognitively unimpaired and MCI patients, whereas 337 pairs of lipids exhibited altered correlation between patients with and without elevated brain amyloid. In particular, 51 lipid pairs showed correlation alterations by both cognitive status and brain amyloid. Interestingly, the lipids central to the network of these 51 lipid pairs were not significantly associated with either MCI or amyloid, suggesting network-based approaches could provide biological insights complementary to traditional association analyses.
Conclusion:
Our attempt to characterize the alterations of lipids at network-level provides additional insights beyond individual lipids, as shown by differential correlations in our study.
Keywords
INTRODUCTION
Lipid alterations have been observed in the pathogenesis of Alzheimer’s disease (AD) and may be potential diagnostic or prognostic markers of AD pathology and dementia [1–4]. Historically, studies have analyzed only a few lipids at a time. More recently, lipidomic approaches have been developed to identify lipid changes in a more comprehensive manner. Indeed, lipidomics has become a powerful approach to characterize system-level changes of lipids in AD, which is critical to understand the bio-logical basis of AD pathogenesis. Initial studies used a global approach to explore the lipidomics land-scape in AD. One early study generated non-targe-ted lipidomic profiles and identified ten lipids from peripheral blood that could detect transition from cognitively unimpaired (CU) to mild cognitive im-pairment (MCI) or AD dementia [5]. Another non-targeted lipidomics study using the AddNeuroMed cohort identified plasma phosphatidylcholines (PCs), triglycerides, and cholesterol esters that were associated with a clinical diagnosis of AD dementia and with temporal lobe brain atrophy [6]. A third study using blood from the Knight Alzheimer’s Disease Research Center, examining lipid biomarkers from serum with a shotgun lipidomics approach, found 87 lipid candidate markers that distinguished clinically diagnosed AD dementia cases and control samples; 35 of the markers were replicated in a validation cohort [7].
Although global, untargeted, approaches measure more lipid species and help identify novel lipids associated with AD, they are limited by a lack of pre-cision to decipher the specific chain structures of the lipids. As a result, more recent lipidomics studies have utilized a targeted lipidomics approach foc-used on a specific set of lipids. For example, the Vienna Transdanube Aging (VITA) Study measured choline phospholipids from plasma and found the levels of lysophosphatidylcholine, choline plasmalogen, and lyso-platelet activating factor increase with normal aging and that the increased levels were more pronounced upon conversion to probable AD [8]. A study of fasting serum samples utilizing a targeted metabolomics assay (AbsoluteIDQ-p180) in the Alzheimer Diseases Neuroimaging Initiative (ADNI), with replication in three additional cohorts (Rotterdam Study, Erasmus Recphen Family Study, and Indiana Memory and Aging Study) [9] reported alterations of sphingomyelins (SMs) and ether-cont-aining PCs by AD severity, and also their correlations with amyloid pathology. The Baltimore Longitudinal Study of Aging (BLSA), using the same targeted metabolomics assay, reported relationships of some of the same SM species in both brain and blood with severity of AD pathology and risk of AD dementia [10].
While many of the aforementioned lipidomics studies are promising, a limitation is that the majority used either univariate analyses to identify individual lipids [7, 11–13], or multivariate analyses for a panel of predictive lipid biomarkers [6, 10] associated with AD-related outcomes. While such association analyses help to identify the associations between lipids and AD, a system-based model (i.e., molecular network [14]) is needed to investigate the interrelationships among lipids for a better biological understanding of AD. A network approach has already been deployed in gene- and protein-centric AD–omics studies, such as transcriptomics [15, 16] and proteomics [17, 18]. Typically, cor-relation-based networks are constructed to evaluate the correlations among measured molecules and identify network patterns to provide biological insights, i.e., hub nodes (with many neighboring nodes in network) or densely connected subnetworks. The AD lipidomics community has also started to embrace these correlation-based network approaches. For example, the ADNI study characterized lipid alterations specific to AD stages in the context of a lipid correlation network [9] and explored the associations of co-regulated lipids to AD diagnosis [19]. In parallel to correlation network approaches, differential correlation network approaches are being actively developed in network-based studies [20, 21]. Such approaches usually look into the correlation changes of molecules across disease status or conditions, which can be beneficial to identify disrupted network relationships and dynamic changes of biological systems. Introducing these approaches into AD lipidomics studies will provide additional mechanistic insights.
In this study of 1,255 plasma samples from the Mayo Clinic Study of Aging (MCSA) cohort, we quantified eighty lipid species with LC/ESI/MS/MS. Our focus was on ceramides, SMs, and their metabolites, thus including the following sphingolipid cla-sses: ceramides, dihydroceramides, glucosylcerami-des, lactosylceramides, PCs, SMs, gangliosides, and sphingosines. Different types of computational analyses were then performed to better understand these lipids among participants without dementia, including 1) association analysis to identify lipids related to cognition and amyloid status, 2) correlation network analysis to explore lipid correlations and characterize the coordination of lipid species from a network perspective, and 3) differential correlation network analysis to identify disrupted correlation among lipids between specific conditions, i.e., by clinical diagnosis (CU versus MCI) or elevated brain amyloid status.
METHODS
Study cohorts and samples
The MCSA is a population-based epidemiological cognitive aging study of Olmsted County, MN residents [22, 23] who were initially sampled using the Rochester Epidemiology Project medical records-linkage system. Beginning in 2004, the MCSA enrolled residents aged 70–89 years; the study was expanded in 2012 to enroll residents aged 50 years and older. Participants underwent detailed clinical visits including neuropsychological testing, a physician examination, and a blood draw. The present analysis includes 1,255 non-demented participants with concurrent amyloid PET imaging and assayed lipids. This study was approved by the Mayo Clinic and the Olmsted Medical Center Institutional Review Boards in Rochester, MN. All participants provided written informed consent at the time of enrollment.
MCI diagnosis
Clinical diagnoses were determined by a consensus committee of those who evaluated each participant. Cognitive performance was compared with the age-adjusted scores of CU individuals previously obtained using Mayo’s Older American Normative Studies [24]. Participants with scores around 1.0 SD below the age-specific mean in the general population were considered for possible cognitive impairment. The operational definition of MCI was based on clinical judgment including a history from the patient and informant and cognitive performance. Published criteria were used for the diagnosis [25]. A final decision was made after considering education, occupation, visual or hearing deficits, and reviewing all other participant information. The diagnosis of dementia was based on published criteria [26]. Participants who performed in the normal range and did not meet criteria for MCI or dementia were deemed CU. The consensus committee was blinded to neuroimaging, and prior clinical assessments results when determining the clinical diagnosis.
APOE genotype identification
DNA was extracted and the apolipoprotein E (APOE) genotyping was conducted as previously described [27].
Amyloid PET imaging
Amyloid PiB-PET images were acquired with a PET/CT operating in 3-dimensional mode [28]. A fully automated image processing pipeline was emp-loyed as described previously [29]. Amyloid (i.e., global cortical PiB-PET retention ratio) was computed by calculating the median uptake over voxels in the prefrontal, orbitofrontal, parietal, temporal, anterior cingulate, and posterior cingulate/precuneus regions of interest (ROIs) for each subject and dividing this by the median uptake over voxels in the cerebellar gray matter ROI of the atlas [28]. We dichotomized participants as amyloid positive or negative (A + /A-) based on a cutoff of >1.48 standard uptake value ratio (SUVR).
Metabolite data generation and processing
Plasma collection
Blood was collected in EDTA tubes in-clinic after an overnight fast. The blood was centrifuged for 10 min at 2,000×g at 4°C, aliquoted in 500μl ali-quots, and stored at –80°C for future analyses, thus avoiding freeze-thaw cycles prior to the current analyses.
Lipid extraction
The lipid panel included ceramide, galactosylceramide, lactosylceramide (LacCer), dihydroceramide (DHCer), ganglioside GM3 (GM3), dihydrosphingomyelin (DHSM), SM, PC, sphingosine (Sph), sphingosine-1-phosphate (S1P) and sphinganine-1-phosphate (Sa1P). The full list of lipids is available in SupplementaryFile 1 .
Samples were prepared using Biomek FX (Beckman Coulter, Brea, CA). Small amount of plasma sample was added to a 2-mL 96-well plate. Internal standard mixture was added to the samples. For plasma sphingolipids and complexed ceramides, lipids were extracted using 1-phase extraction with methanol-dichloromethane. After dryness under wa-rm nitrogen gas, the samples were reconstituted in methanol/water/0.5%formic acid/5 mM ammonium formate (80/20 by volume ratio, v/v). Another small amount of lipid extracted was dried and reconstituted in acetonitrile/methanol/5 mM ammonium formate (80/20 by volume ratio, v/v) for glucosylceramide and galactosylceramide analysis.
For plasma PC, PCs were extracted using a modified Bligh-Dyer two-phase extraction method. After dryness under warm nitrogen gas, the samples were reconstituted in acetonitrile/methanol/5 mM ammonium formate (70/30 by volume ratio, v/v). The lipid extract was then diluted 10-fold before analysis.
Lipid determination and quantification with mass spectrometry
LC/ESI/MS/MS analysis of sphingolipids was per-formed using a AB Sciex quadrupole mass spectrometer 6500 (Sciex, Framingham, MA) equipped with an ESI probe and interfaced with the Agilent 1290 infinity LC system (Agilent, Palo Alto, CA). The UPLC system consisted of an Agilent 1290 binary pump, thermostat, TCC, and sampler. Mass spectrometric analyses were performed online using electrospray ionization tandem mass spectrometry in the positive mode. For ceramides, the injection volume was 10μL for extracted sample. These were separated with a Poroshell 120 EC- C8 column, 2.1×50 mm, 2.7 um (Agilent, Palo Alto, CA). Mobile phase A was water/methanol/0.5%for-mic acid/5 mM ammonium formate (45/55 by vol-ume ration, v/v). Mobile phase B was acetonitrile/methanol/0.5%formic acid/5 mM ammonium formate (50/50 by volume ratio, v/v). A linear gradient increase from 0%to 95%mobile phase B for 0.8 min, then hold it for 4.7 min. The column was equilibrated with mobile phase A for 0.5 min. The flow rate was 0.5 mL/min. Column temperature was kept at 50°C.
Glucosylceramides and galactosylceramides were separated with Halo HILIC UHPLC column, 2.1× 150 mm, 2.7μm (Mac-Mod, Chadds Ford, PA, PN: 92812-701). The injection volume was 2μL for lipid extracts. Mobile phase A was acetonitrile/methanol/Isopropyl alcohol/0.5%formic acid/5 mM ammonium formate (95/2.5/1.5), by volume ratio, v/v). Mobile phase B was water/0.5%formic acid/5 mM ammonium formate. The solvent flow rate was 0.5 mL/min. The column temperature was kept at 50°C.
For PC analysis, the injection volume was 2μL for lipid extracts. Lipid extracts were chromatogra-phically resolved using a Halo Penta HILIC UHPLC column, 2.1×150 mm, 2.7μm (Mac-Mod, Chadds Ford, PA, PN: 92812-705). Mobile phase A was acetonitrile/methanol/0.5%formic acid/5 mM ammonium formate (95/5, by volume ratio, v/v). Mobile phase B was water/0.5%formic acid/5 mM ammonium formate. Mobile phase B decreases from 95%to 93%in 3 min, then to 50%for 0.5 min and hold it for 0.5 min. The column was equilibrated for 2 min. The solvent flow rate was 0.7 mL/min. The column temperature was kept at 50°C. The valve, sample loop, and needle were washed with acetonitrile/methanol (50/50 by volume ratio, v/v) for 20 s.
Different sphingolipid species were quantified using standard curves and ratios of the peak areas of analytes to internal standards (described in [30]). Calibration curves were calculated by least-square linear regression from serial dilutions with a mixture of lipid standards of sphingolipids and phosphatidylcholine. Pure synthetic standards of sphingolipids and PCs were purchased from Avanti Lipids. Isotope labeling synthetic standards were synthesized internally at Eli Lilly and Company. Data analysis was performed using Multiquant 3.0 (Sciex, Framingham, MA). A pooled QC plasma sample was used along with three different levels of neat QC (low, medium, and high).
Statistical analysis
Association analysis
Lipid abundance data was first log-transformed. The univariate association analysis of individual lipids was performed with generalized linear model with R base package Stats (version 3.6.1) for both MCI and amyloid, adjusted with age, sex and APOE4. For evaluating interaction effect of two lipids, the product of their abundance was introduced as interaction term. The hierarchical clustering analysis of lipids was performed with heatmap.2 function within R package gplots (version 3.0.4).
Correlation network construction
Biochemically related metabolites and their correlations were investigated from a network perspective. In this study, a Gaussian graphical model (GGM) was learned from metabolomic profiles using the R package “GeneNet” [31]. GGM is an undirected probabilistic graphical model evaluating conditional dependence between variables. For each pair of lipids, GGM calculates partial correlation coefficients conditioned upon all other lipids in the study. Therefore, GGM is expected to reveal relatively direct relations between lipids than regular correlation network. To determine significant partial correlations, we used a significance threshold of 0.05 for q-values in the model.
Differential correlation network
Beside general correlation structure of lipids, correlation changes among lipids across conditions also provide insights into biochemical dynamics in the progression of AD. Toward this, differential correlation analysis (by R package “DGCA” [32]) was used to evaluate the correlation changes of all lipid pairs between sample groups. Specifically, differentially correlated lipids were identified for two comparisons among sample groups, including CU versus MCI and A+ versus A-.
RESULTS
Lipidomics profiles of Mayo Clinic Study of Aging Cohort
The demographic information and amyloid status of the MCSA cohort are provided in Table 1. The present analyses include 1,114 CU and 141 MCI participants. As expected, the MCI participants were older, had less education, and were less likely to have elevated brain amyloid. PCs were the most abundant lipid species (see Supplementary File 2). The abundances of some lipids were highly correlated across all participants. This is demonstrated by the clusters in Fig. 1, where the level of correlation changes from 1 (red color) to -1 (blue color). Examples include a large group of SMs and PCs (lower right), and a group of lactosylceramides and gangliosides (upper left). PCs and SMs were highly correlated with each other, but not with other lipid species. Negative correlations were rarely observed among the lipids.
Demographics and amyloid status of MCSA participants
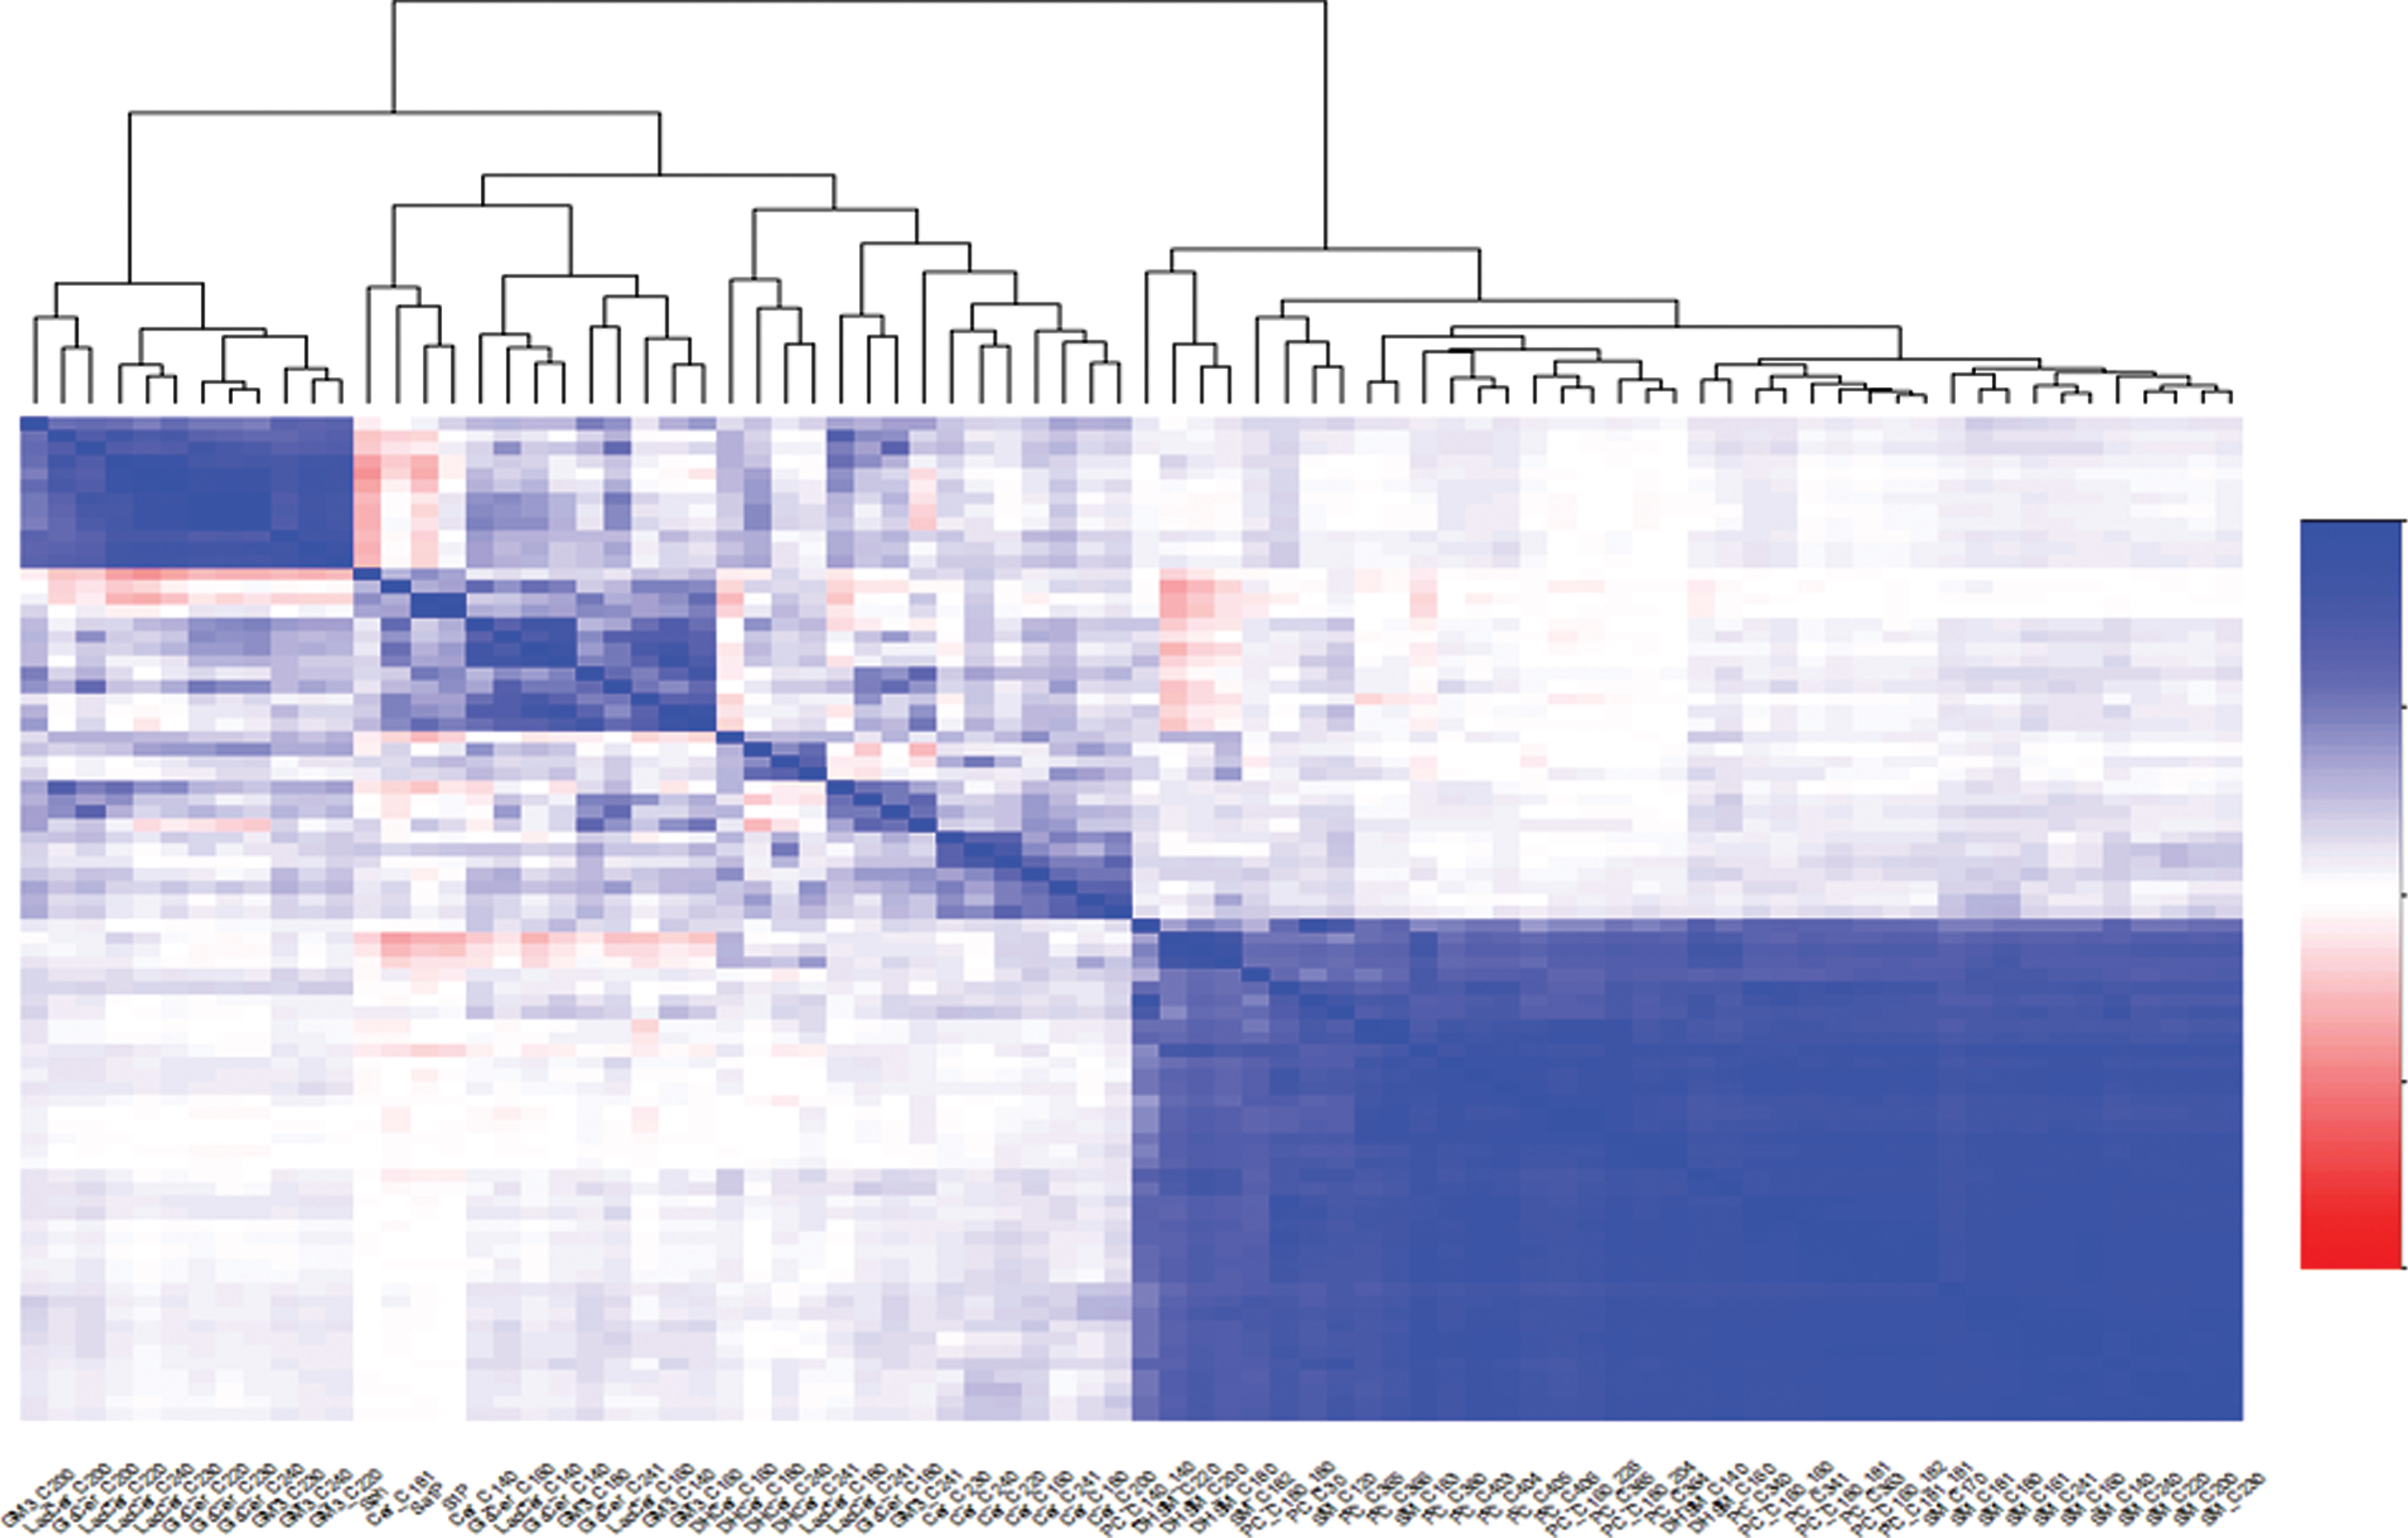
Heatmap of correlations among lipid species.
Lipid associated with cross-sectional AD status
Cross-sectional association analysis was perfor-med to relate lipids with either MCI or amyloid status, and including age, sex and APOE4 as confounding factors. As shown in Table 2, seven lipids showed significant associations (p < 0.05) with MCI, but none of the lipids were associated with amyloid at p < 0.05 (only two lipids with p < 0.1). The lipids significantly associated with MCI include three GM3 gangliosides (C18:0, C23:0, C24:1), two glucosylceramides (C18:0, C24:1), one lactosylceramide (C24:1), and one phosphatidylcholine (C40:3).
Association with MCI and amyloid
Lipid correlation networks and modules
Determination of the lipid correlation network helps to understand their coordinative behaviors of the lipids. In this study, GGM was applied to recon-struct the lipid correlation network based on log-tra-nsformed lipid abundance data from all participants. By looking at the partial correlations among lipids, this model can identify more direct biochemical relationships and omit more indirect relationships. The reconstructed correlation network from lipidomics data is shown in Fig. 2.

Lipid correlation network from Gaussian Graphical Model (GGM). Different correlation patterns among lipids were observed, i.e., sub-networks (highlighted by pink dashlines) or linear paths (highlighted by green dash lines).
A few groups of lipids formed densely connected subnetworks (called “modules”), exemplified by the highlighted in red dash lines. Specifically, ceramides with relatively long-chains (from C16:0 to C24:1) correlated to each other; four dihydroceramides (C16:0, C18:0, C24:0 and C24:1) clustered together; two groups of glucosylceramides, lactosylceramides, and gangliosides formed two separate modules (one for short-chain and one for long-chain lipids). As expected, the network also clustered three sphingosine lipids (Sa1P, S1P, and Sph) together, suggesting its ability to capture underlying biochemical relationships. Interestingly, SMs and PCs tended to form linear pathways (unlike modules for ceramides) in the network. An example is the pathway from SM_C18:0, SM_C18:1, and SM_C18:2 to SM_C18:3 (highlighted with a green dashed line). In general, the chain lengths from the same lipid species were connected, i.e., the modules for ceramides, the pathways for SMs or PCs). This suggests that the lipids from these species have coordinated profiles across measured samples.
Differential correlation networks of lipids
Differential correlation overview
We next investigated the patterns of lipid correlations across different conditions. Specifically, the correlation change of each lipid pair was calculated for two comparisons (CU versus MCI, A- versus A+). Table 3 provides the summary of these significant differential correlations, including the numbers of lipid pairs, the direction and classes of correlation changes.
Summary of differential correlations for the two comparisons
Between CU and MCI, there were 177 pairs of lipids with significant differential correlation. Out of these 177 pairs, 112 pairs had increasing correlations in MCI and 65 pairs had decreasing correlation in MCI. There were 337 pairs identified between amyloid groups, including 163 with increasing and 174 with decreasing correlations in A+.
Interestingly, there were different types of correlation changes between the two conditions, and the majority of the lipid pairs correlated positively in both conditions (denoted by “+/+” in Table 3). As examples, some lipid pairs with different types of correlation changes are provided in Fig. 3.
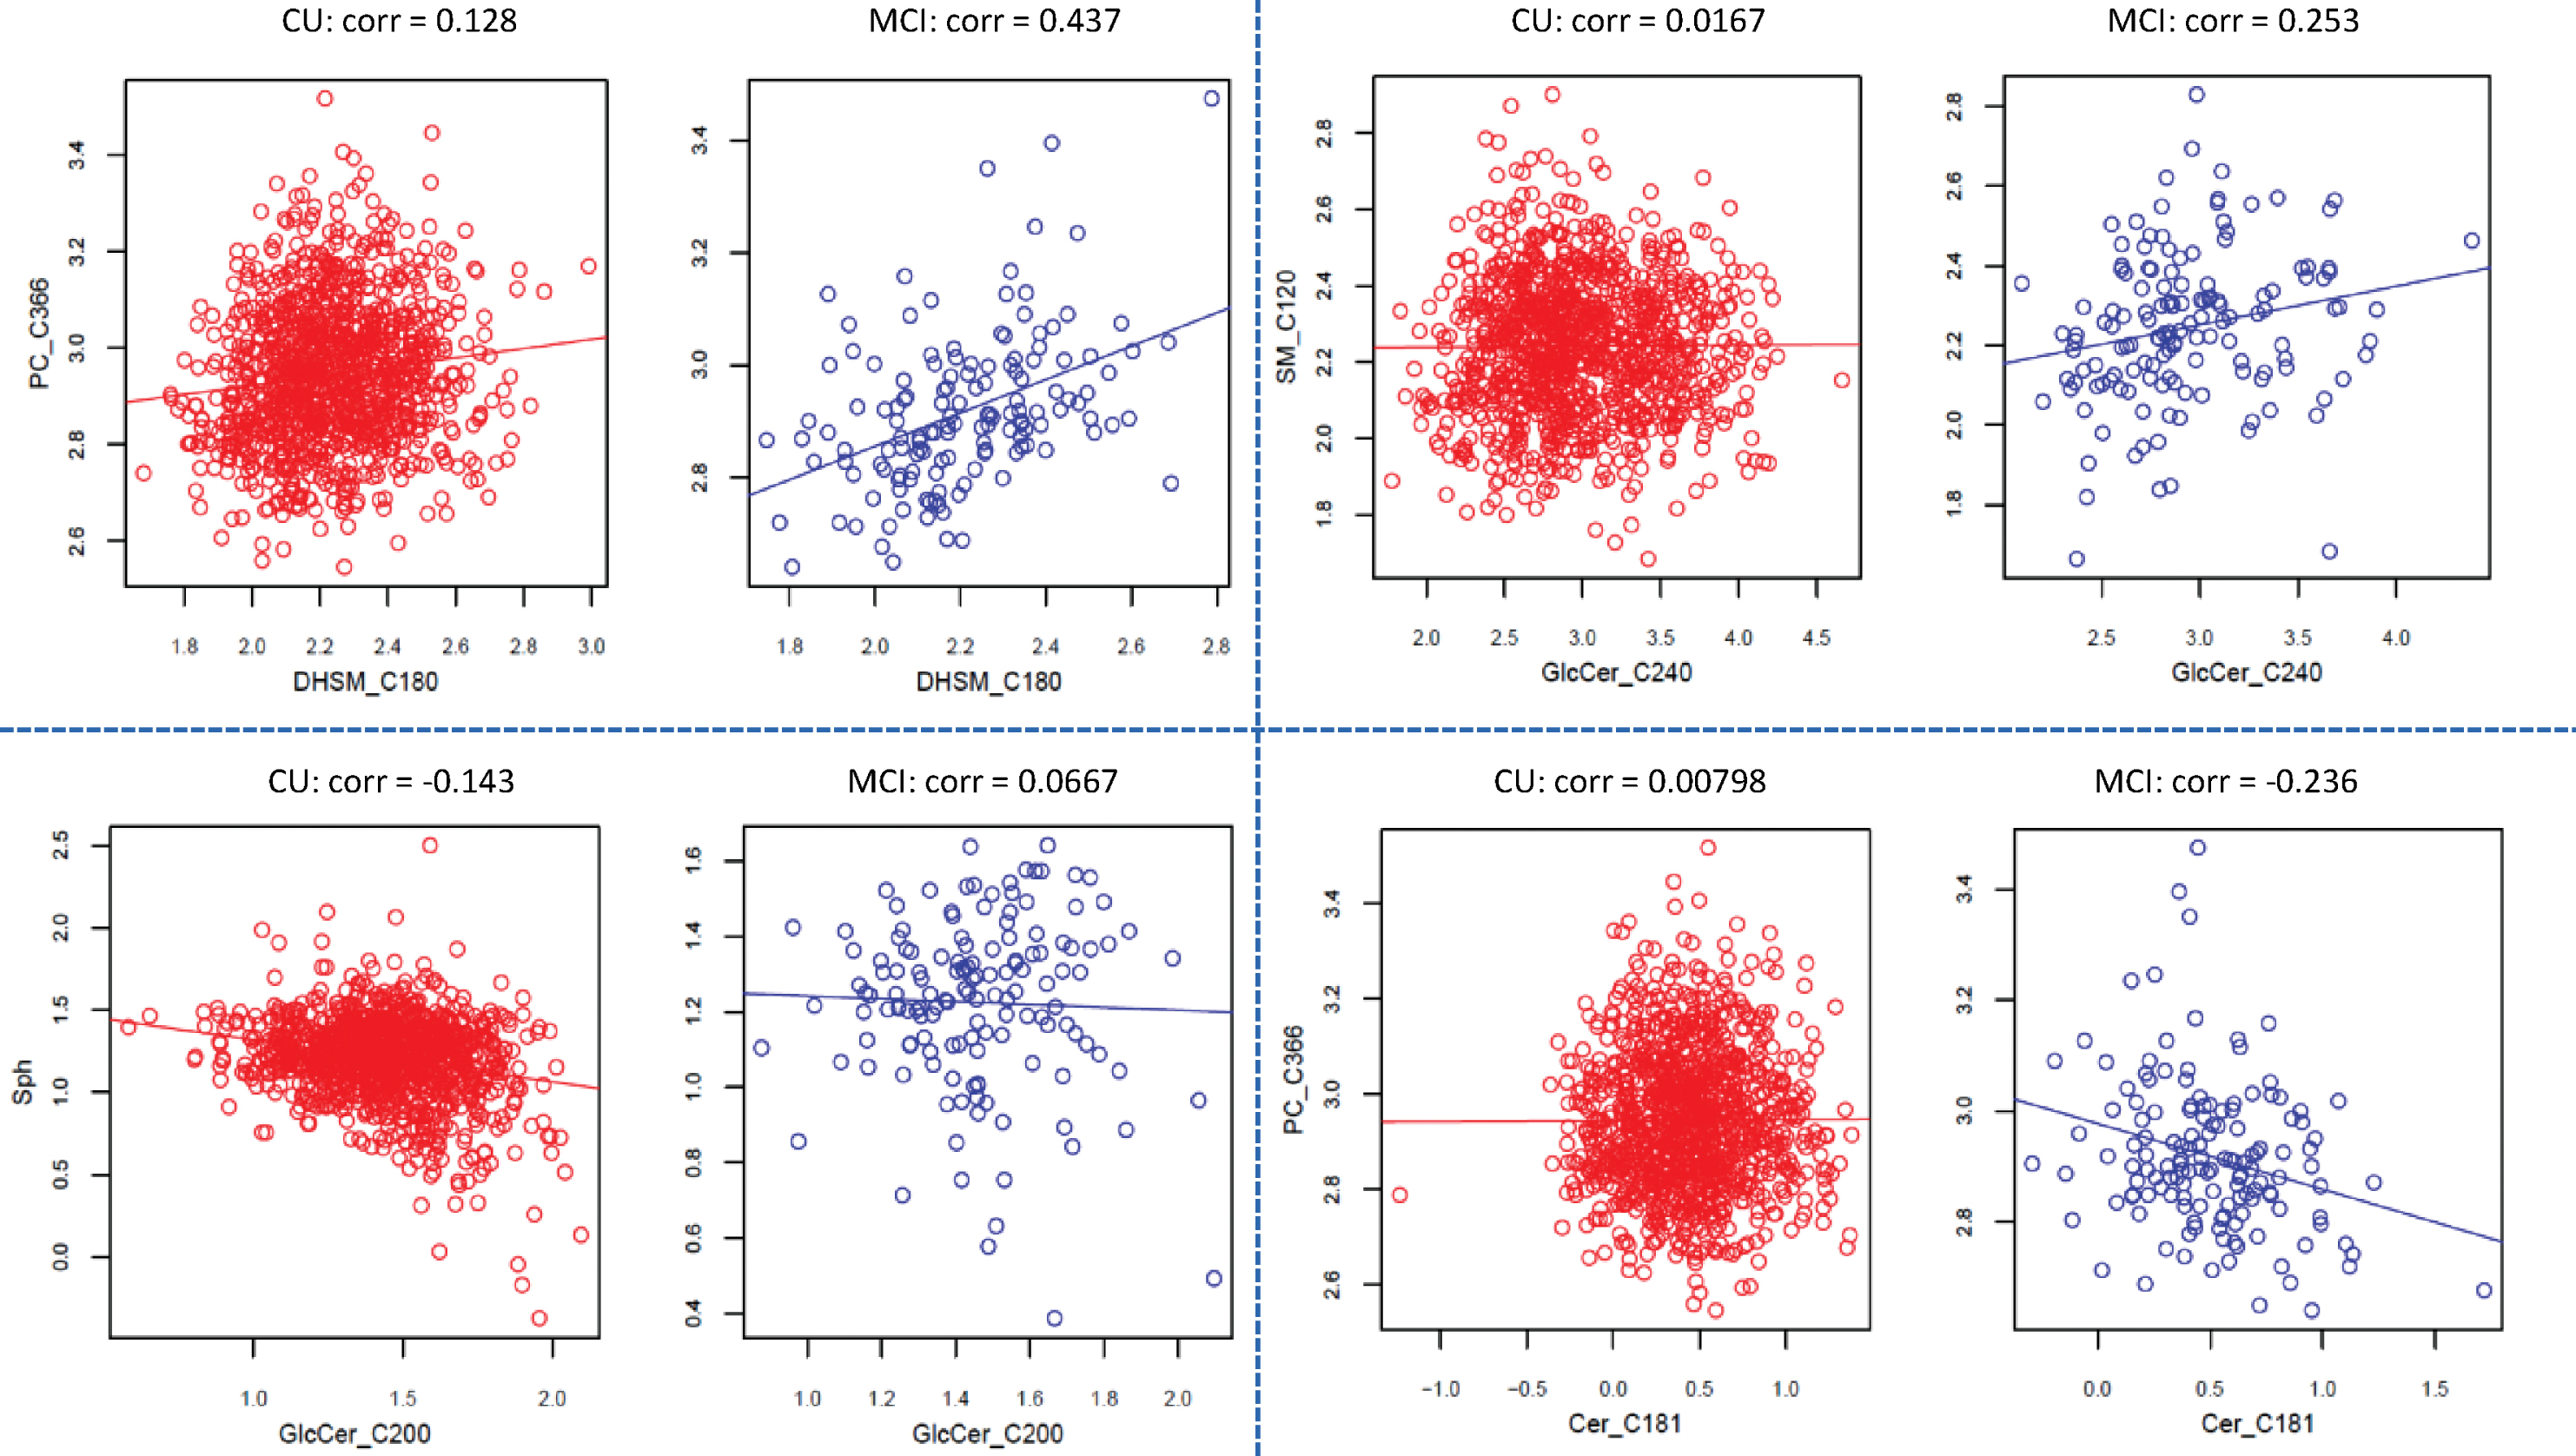
Examples on the classes of correlation change observed between CU and MCI. For example, both positive correlation but increases in MCI (top left panel); no correlation in CU, but positive in MCI (top right panel); negative correlation in CU, but no correlation in MCI (lower left panel); no correlation in CU, but negative correlation in MCI (lower right).
Differential correlation network in common to cognition and amyloid status
We further generated differential correlation networks for both CU versus MCI and A- versus A+ (see Supplementary File 3). In the network, two lipids were connected by an edge when they exhibited significantly different correlations by cognition or amyloid status. The lipid pairs with the same correlation changes for both cognition and amyloid status were of primary interest. By comparing the two networks, 51 common interactions were identified where green and red edges indicate increasing and decreasing correlation, respectively (Fig. 4).
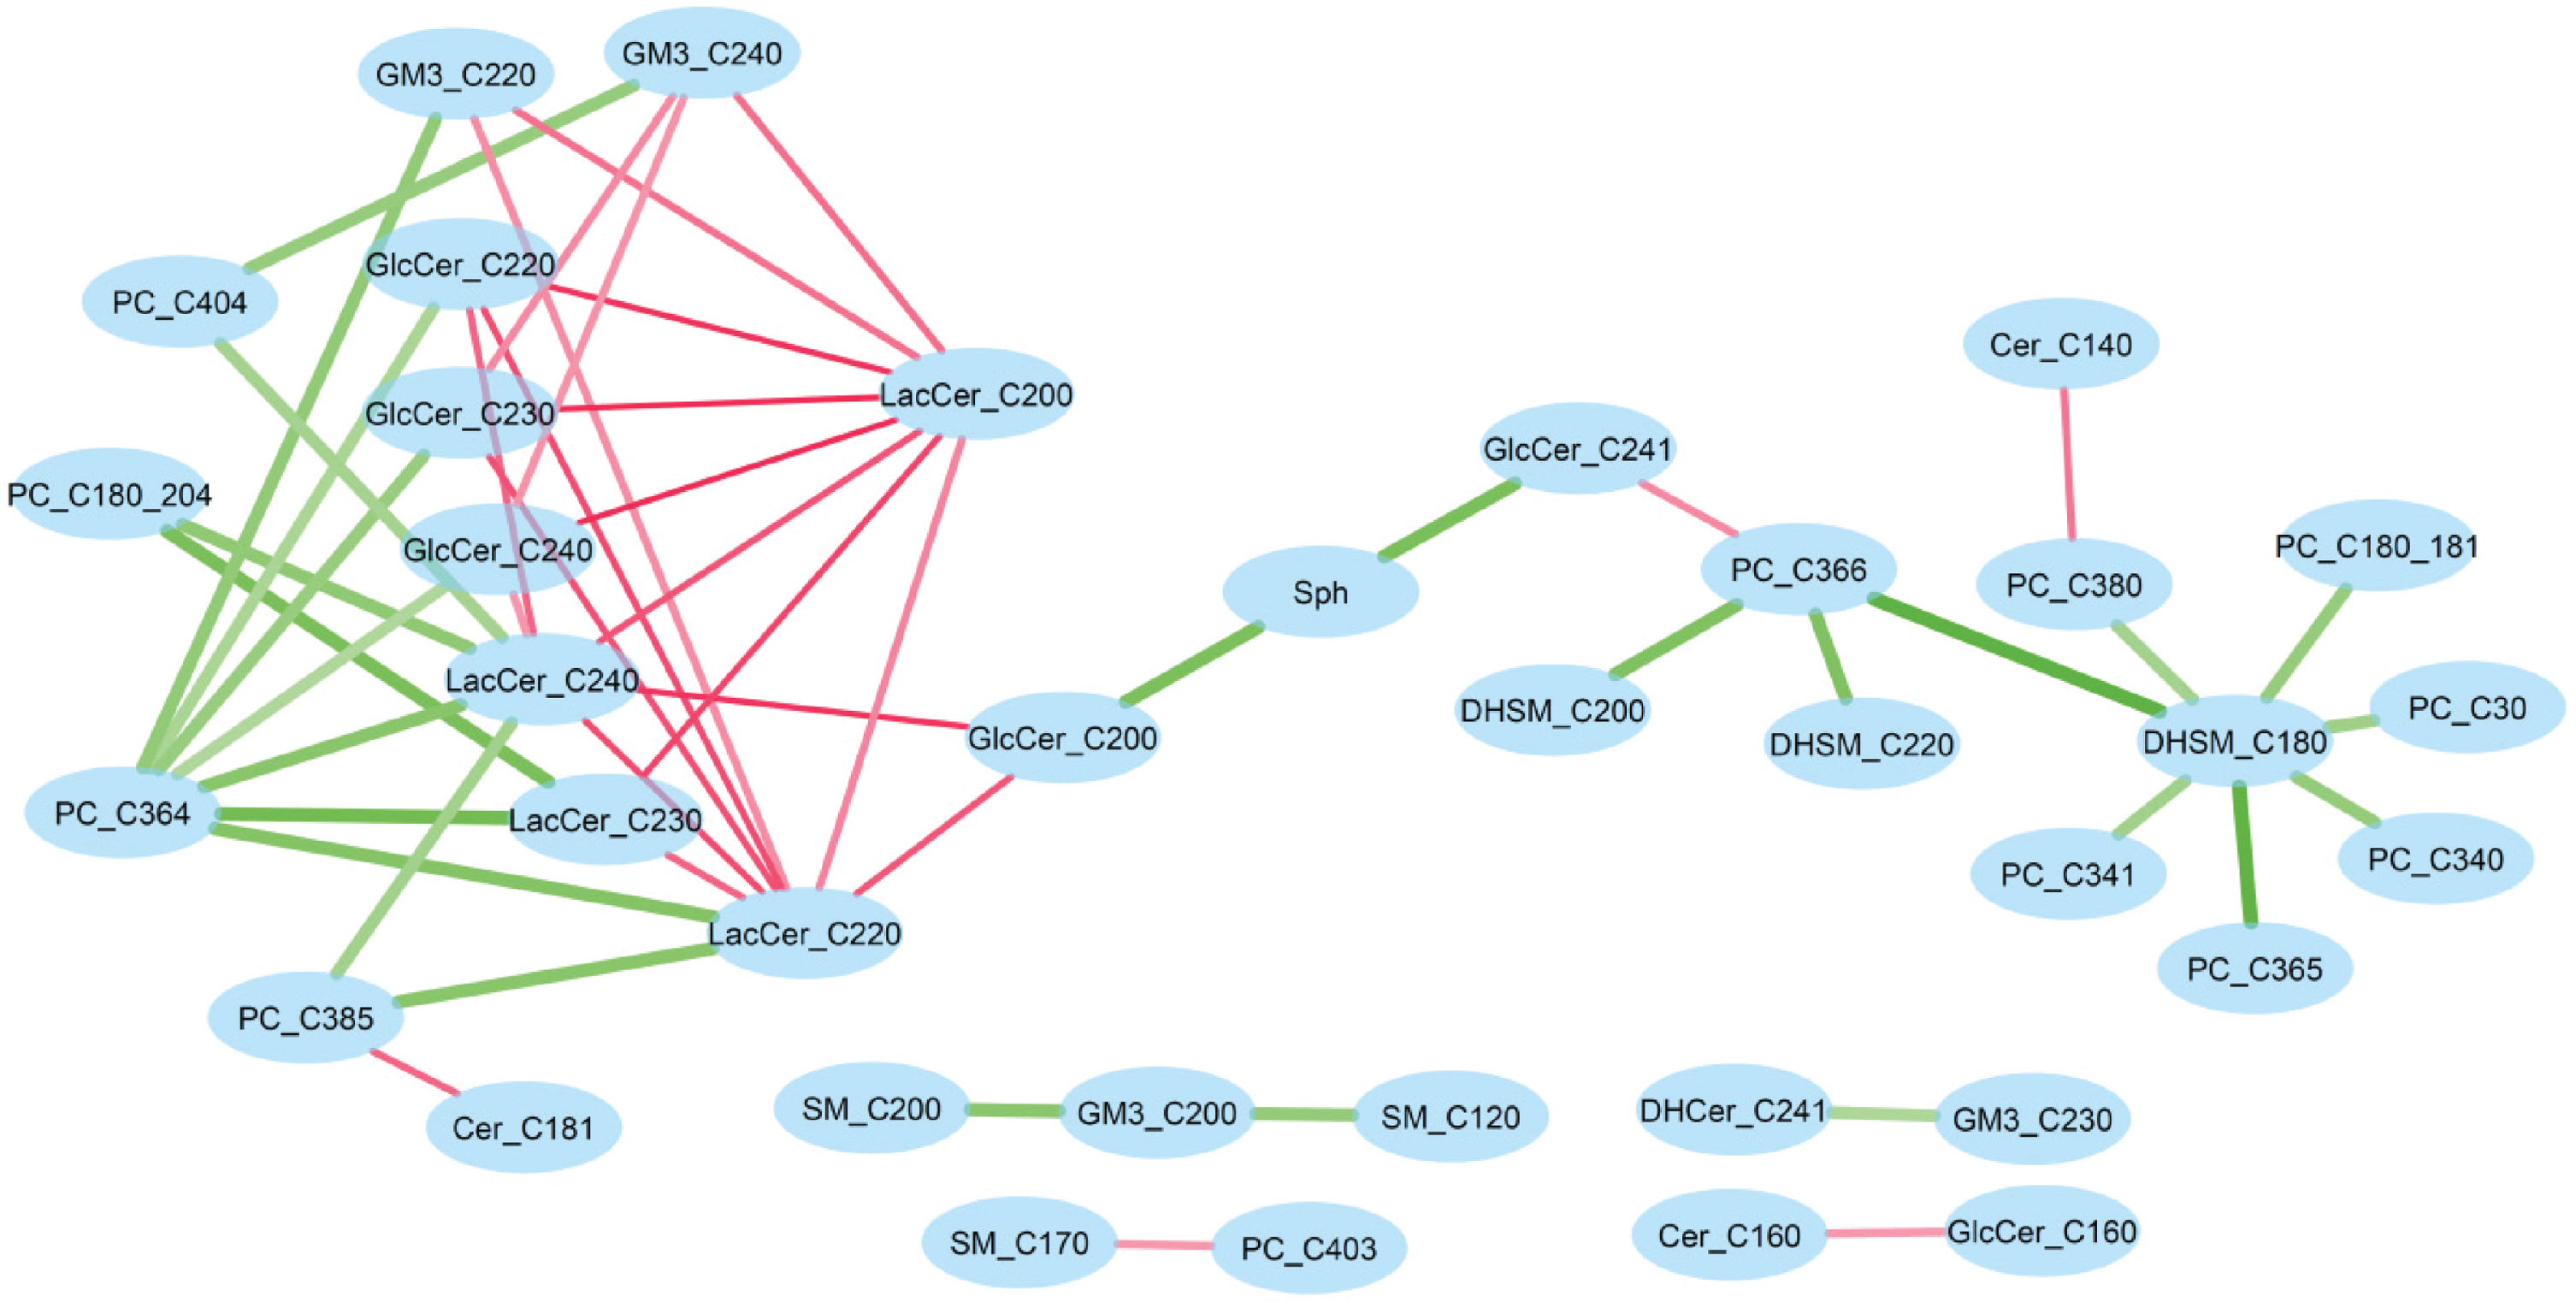
Differential correlation network common to MCI and amyloid status. Green edge represents increased correlation (from CU to MCI, or from A- to A+), whereas pink edge represents decreased correlation.
This common network showed some interesting patterns. In particular, DHSM_C18:0 increased its correlations to a few PCs in MCI (versus CU) and A + group (versus A-). LacCer_C20:0 consistently decreased its correlation to a group of glucosylcer-amides (GlcCer 22:0, 23:0, and 24:0) and lactosylceramides (LacCer 22:0, 23:0, and 24:0), whereas PC_C36:4 increased correlations to the same group of lipids. Further, the three hub nodes (DHSM_C18:0, LacCer_C20:0 and PC_C36:4) were not significantly associated with amyloid or cognitive status, suggesting differential network analysis provides insights complementary to association analysis.
Differentially correlated lipids exhibit interaction effect on cognitive status
The differential correlation analysis identified lipid pairs with different correlations by cognition and amyloid status. We further explored the interaction effects of these lipid pairs. By introducing interaction terms in association analysis, 50 of the 177 lipid pairs were identified to have significant interaction with cognitive status. To determine whether this observation was due to chance, we also evaluated the interaction effect for all 3,160 lipid pairs and found 178 pairs with significant interaction effect on cognitive status. The 177 differentially correlated pairs (for CU versus MCI) and the 178 pairs with interaction effect significantly overlapped (p = 5.08e-25). This suggests that differential correlation could be an effective approach to capture such interaction effects among lipids.
DISCUSSION
Lipid alterations have consistently been observed in the pathogenesis of dementia [1–4]. However, to date, the vast majority of studies have used association analyses. Additional approaches including correlation-based network analyses are needed to further inform the role of lipids in AD. In this study, we quantified eighty sphingolipid species with LC/ESI/MS/MS in 1,255 plasma samples from the population-based MCSA cohort. We used multiple computational analyses to better understand these lipids among participants without dementia, including by clinical diagnosis (CU versus MCI) or elevated brain amyloid status. The identified lipid correlation changes from our study could help better understand the pathogenesis of AD and warrant further analyses in other studies as biomarkers for the diagnosis of MCI. Our results demonstrate that systems-level approaches will be promising to extract insights from lipidomics for understanding the pathogenesis and clinical phenotypes of AD.
The association analysis revealed seven sphingol-ipids (three GM3 gangliosides, two glucosylcerami-des, one lactosylceramide, and one PC) significantly associated with cognitive status (CU versus MCI), but very few lipids differed by amyloid status. Notably, previous studies have shown that the concentrations of the same GM3 gangliosides were elevated in the entorhinal cortex region of AD dementia patients [33] and also Parkinson’s disease patients [34]. In addition, our findings of associations with ceramide C24:1 and lactosylceramide C24:1 are congruent with the literature that suggests ceramide (C24:1) is higher in Parkinson’s disease patients with cognitive impairment [35] and also is inversely associated with insulin sensitivity which has been associated with risk of AD [36].
The lipid correlation network analysis characterized the correlation structure among the measured lipids. We determined that some sphingolipids species had stable correlations across all conditions, demonstrated by the sub-networks around relatively long-chain ceramides or the linear pathways with PCs or SMs. Similar to another lipidomics study [9], long-chain PCs are correlated and tend to form sub-networks in the correlation network. In addition, we utilized differential correlation network analysis to investigate the sphingolipid correlations under specific conditions and identified system-level alterations of lipidomics. A common differential correlation network from both MCI and amyloid was identified. Such network-level analysis provides insights beyond that provided from individual lipids in association analysis.
Differential correlation network methods can provide insights that would otherwise be overlooked when using association analyses at the individual lipid levels. Such systems biology methodology complements traditional association analyses and extracts more biological insights. Indeed, although we only found several lipids that differed between CU and MCI in association analyses and none before amyloid positive and negative, there were several findings using differential correlation network methods. Between CU and MCI, 112 pairs had increasing correlations in MCI and 65 pairs had decreasing correlation in MCI. Further, between amyloid negative and positive groups, 163 pairs had increasing correlations whereas 174 pairs had decreasing correlations in A + . Current differential correlation methodologies stratify patients into different groups based on individual outcome variables (i.e., cognition status or amyloid in this study), and then derive the difference of lipid correlations from these patient groups. However, such methods do not consider clinical covariates in the stratification step. Therefore, there is a need for further methodological development.
Strengths of the study include the large population-based cohort with information on brain amyloid and cognitive status, as well as the large number of quantified plasma sphingolipids. However, limitations warrant consideration. First, although we examined a large number of sphingolipids, additional lipids such as cholesterol have been implemented in the pathogenesis of AD and need to be included in future studies. Global approaches like untargeted mass spectrometry, although less quantitative, may help empower studies at a larger scale. Second, lipid concentrations in the blood can differ from cerebrospinal fluid and brain. Therefore, further validation of the findings using cerebrospinal fluid samples or brain tissue is needed and will help establish the validity of blood-based lipid measurement as potential biomarkers. Third, diet can affect some lipids. We did collect blood in the fasting status to make the data more uniform. In addition, we did not include individuals with dementia, partly because patients with dementia tend to have change in eating habits.
